
Weekly Market Overview#
Gold did not give traders one comfortable direction during September 14–18. Early pressure, a failed sell idea, a rapid midweek buy, and two opposite Friday setups made this a week in which the next decision mattered more than the last prediction. MO's most revealing moment was Tuesday: the first sell lost its premise, the loss was acknowledged, and a new plan was published with a fresh boundary. The recovery story starts there, not with a cropped winning screenshot.
Want to see how this approach works in real time? Message support @GTMOBest to ask about free VIP access. Read the five daily reports and the selected proof below first; historical results are individual reports, not a promise of what your account will make.
The documented public record contains eight distinct trade plans across five sessions: one Monday, two Tuesday, one Wednesday, two Thursday, and two Friday. The local signal extraction also contains openers and follow-up messages; those are not counted as extra plans. This distinction matters in a fast market. A trader needs to know whether the desk changed its view, protected an existing position, or issued an entirely new setup.
What Drove Gold This Week#
Monday's market research described pressure around the $4,300 area as inflation and energy headlines sharpened rate concerns. Tuesday's snapshot still showed defensive trading ahead of the Fed decision. Wednesday and Thursday brought wider intraday swings around that event, while Friday's packet described a rebound as the oil backdrop eased. These were snapshots captured before the global spot sessions had closed. They explain the environment MO was responding to; they do not support a precise Monday-to-Friday closing return.
The September 14–18 forecast framed the week before those decisions. This recap tests the actual public sequence against that uncertainty. The archive of weekly summaries gives the wider context, and Gold Trader Mo keeps the current education and support route together.
Weekly Performance Snapshot#
The strongest evidence this week is the order of decisions. Monday's buy was posted with a zone and four checkpoints. Tuesday's first sell was cut when continuation failed, then the second sell ran through a staged target sequence. Wednesday had one fully specified buy, although a brief opener appeared earlier in the channel. Thursday's first sell ended with a modest protected result; a later buy reached five reported target checks. Friday contained a sell and a buy, each with four reported target checks. Eight plans describe this record more honestly than treating every alert or follow-up as another winning signal.
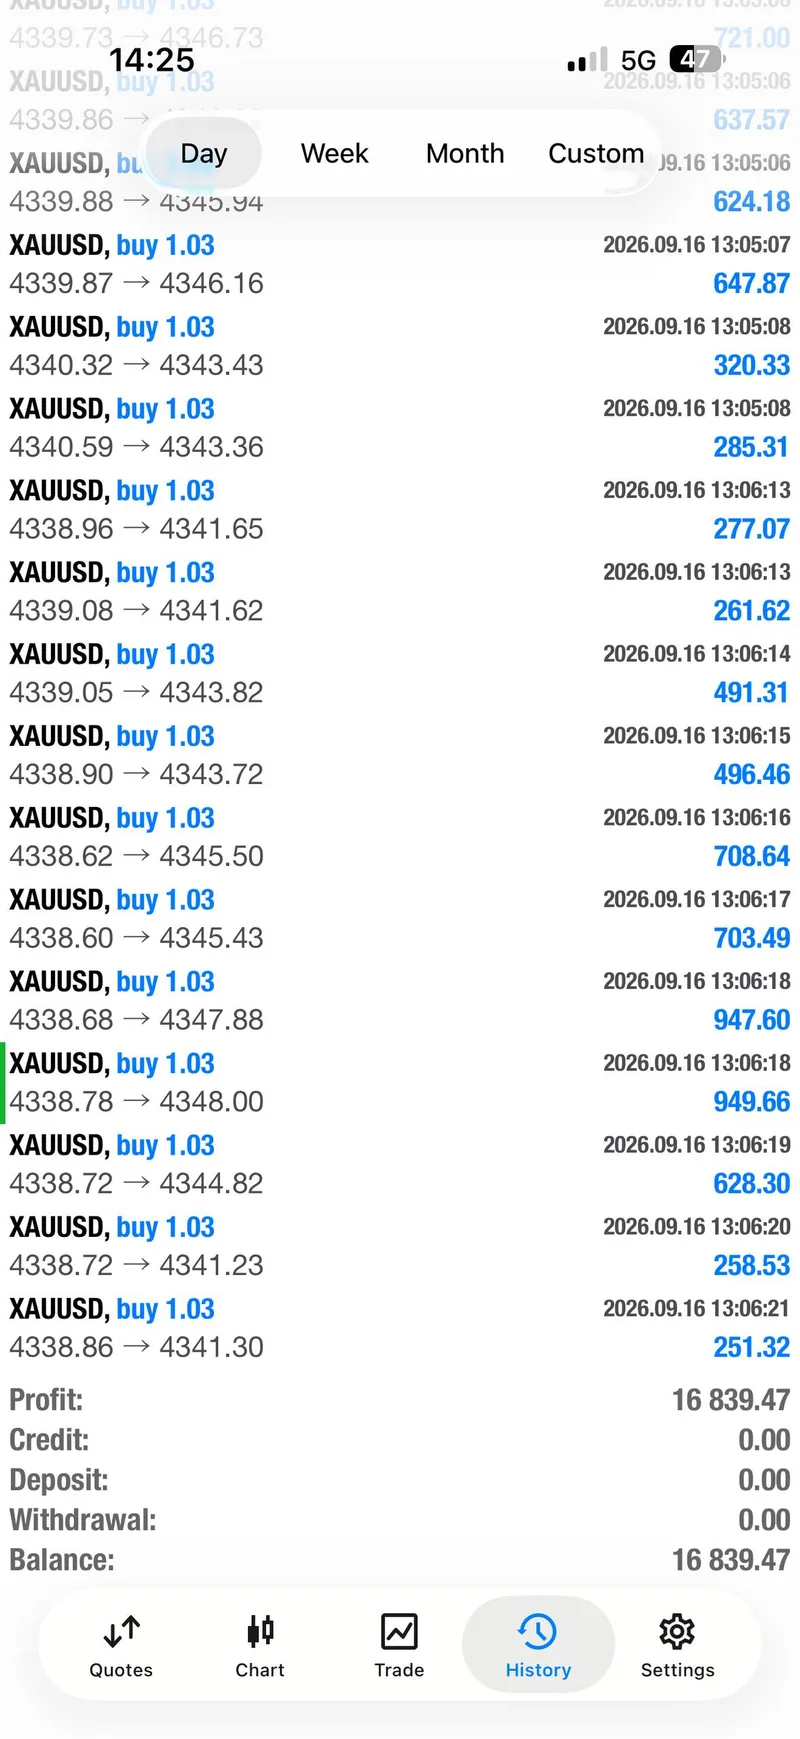
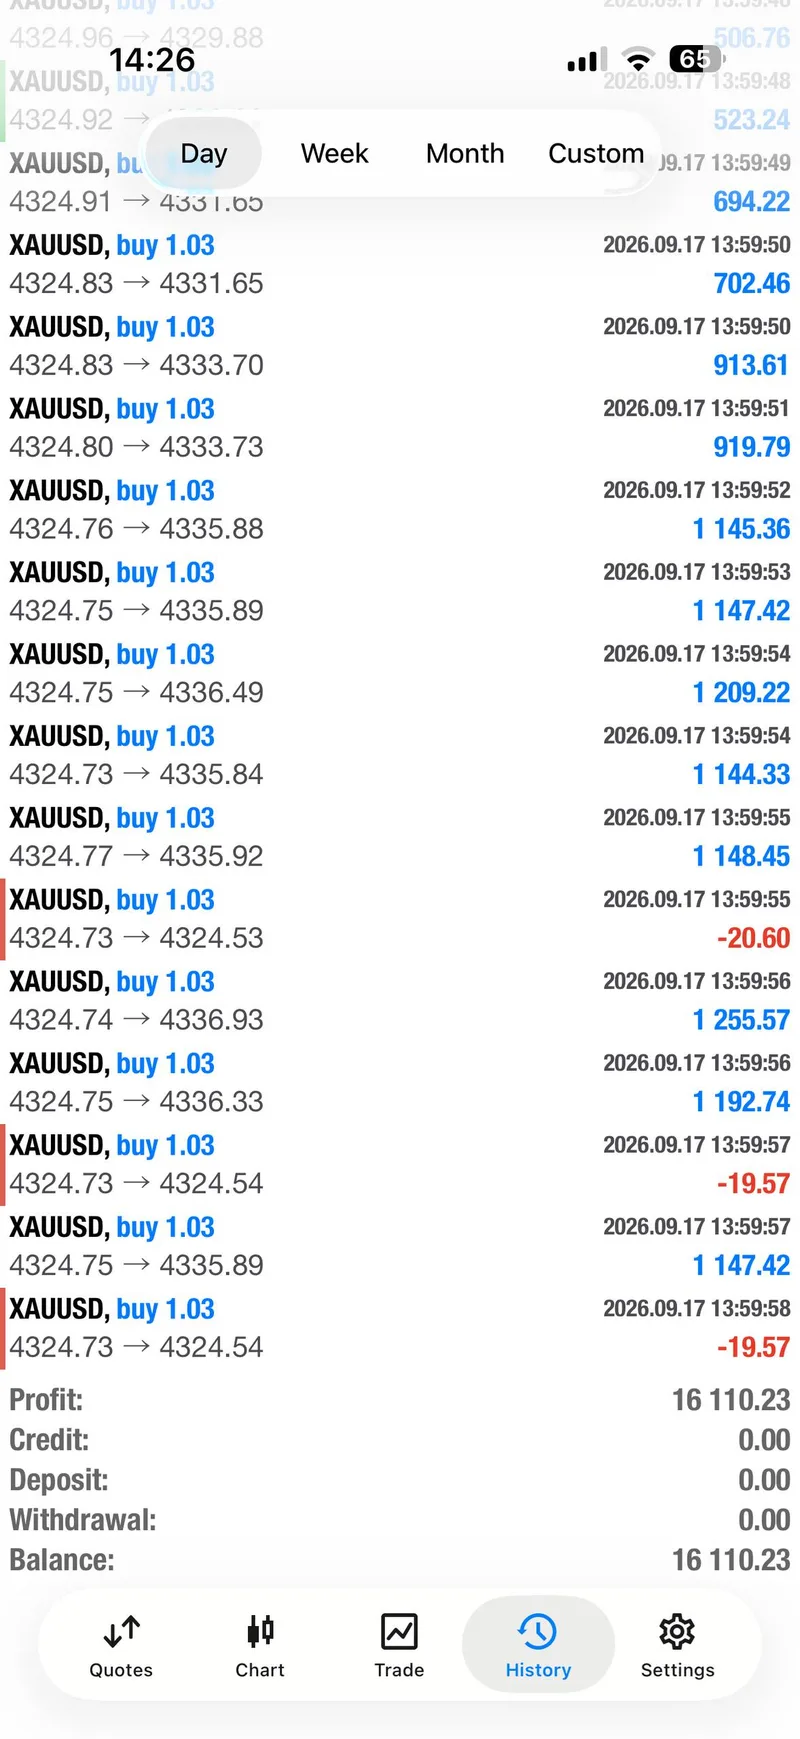
The daily archive also contains reported account figures. Monday carried a $25,000 channel headline; Tuesday carried a $30,000 channel message; Wednesday showed a $16,800+ same-day claim and one account screenshot; Thursday reported $16,000+ for one account; Friday's channel said more than $13,000 had been secured. The $30,000 message was a Tuesday single-session claim, not a weekly total. These are public, self-reported results or account-specific screenshots, not audited returns or results every follower received. Friday's separate $750 comment came from a member and is not MO's result.
Best Trades and Recovery Moments#
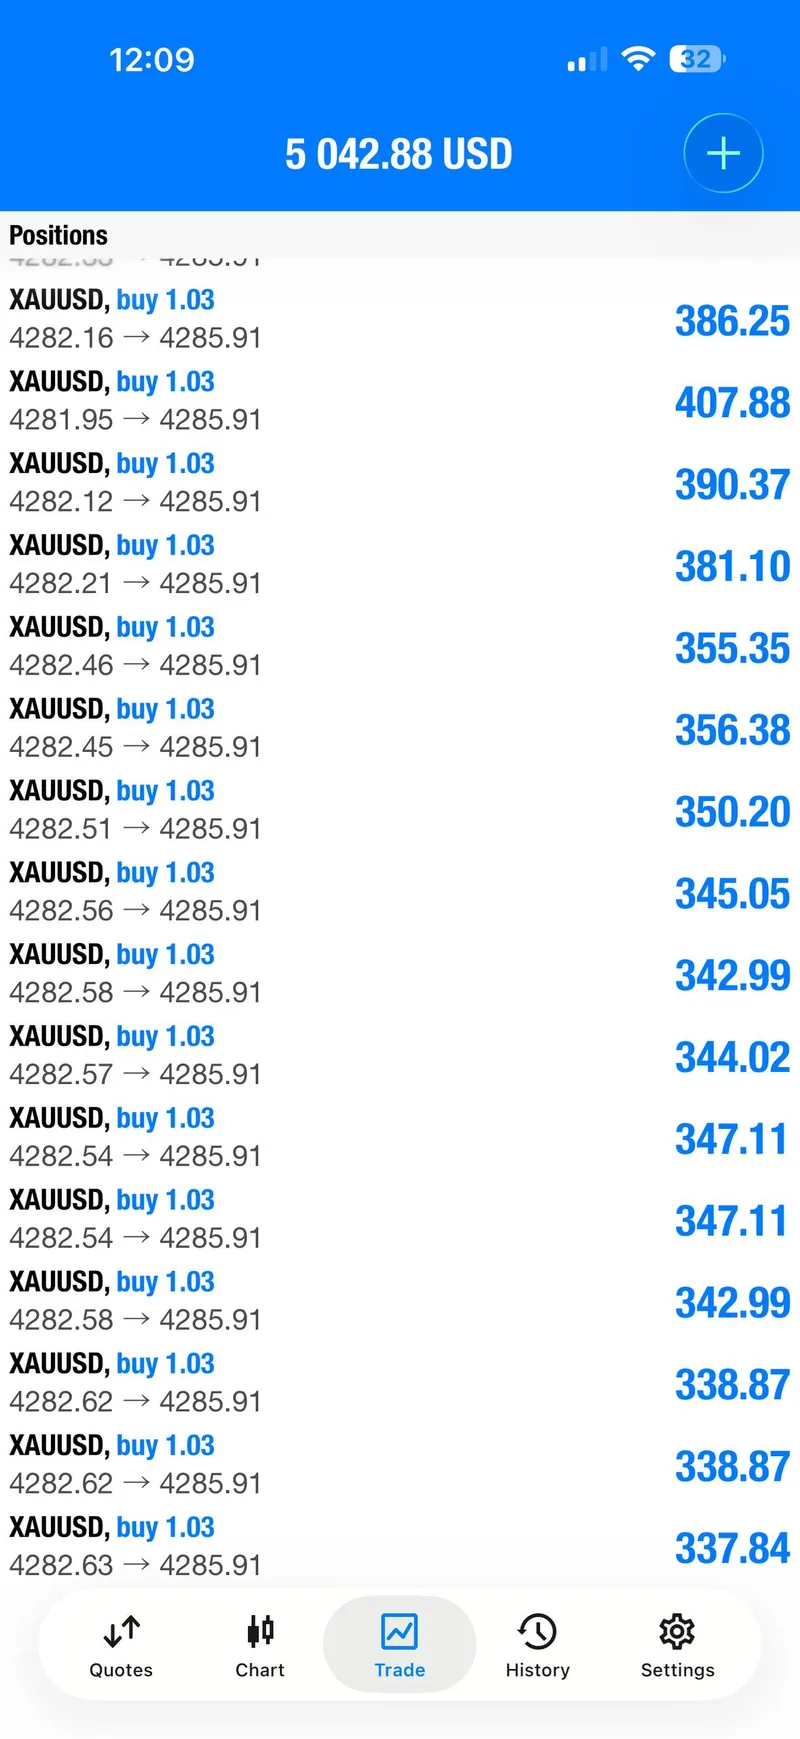
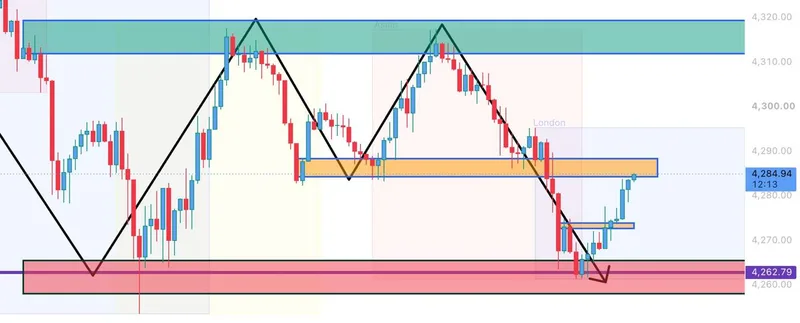
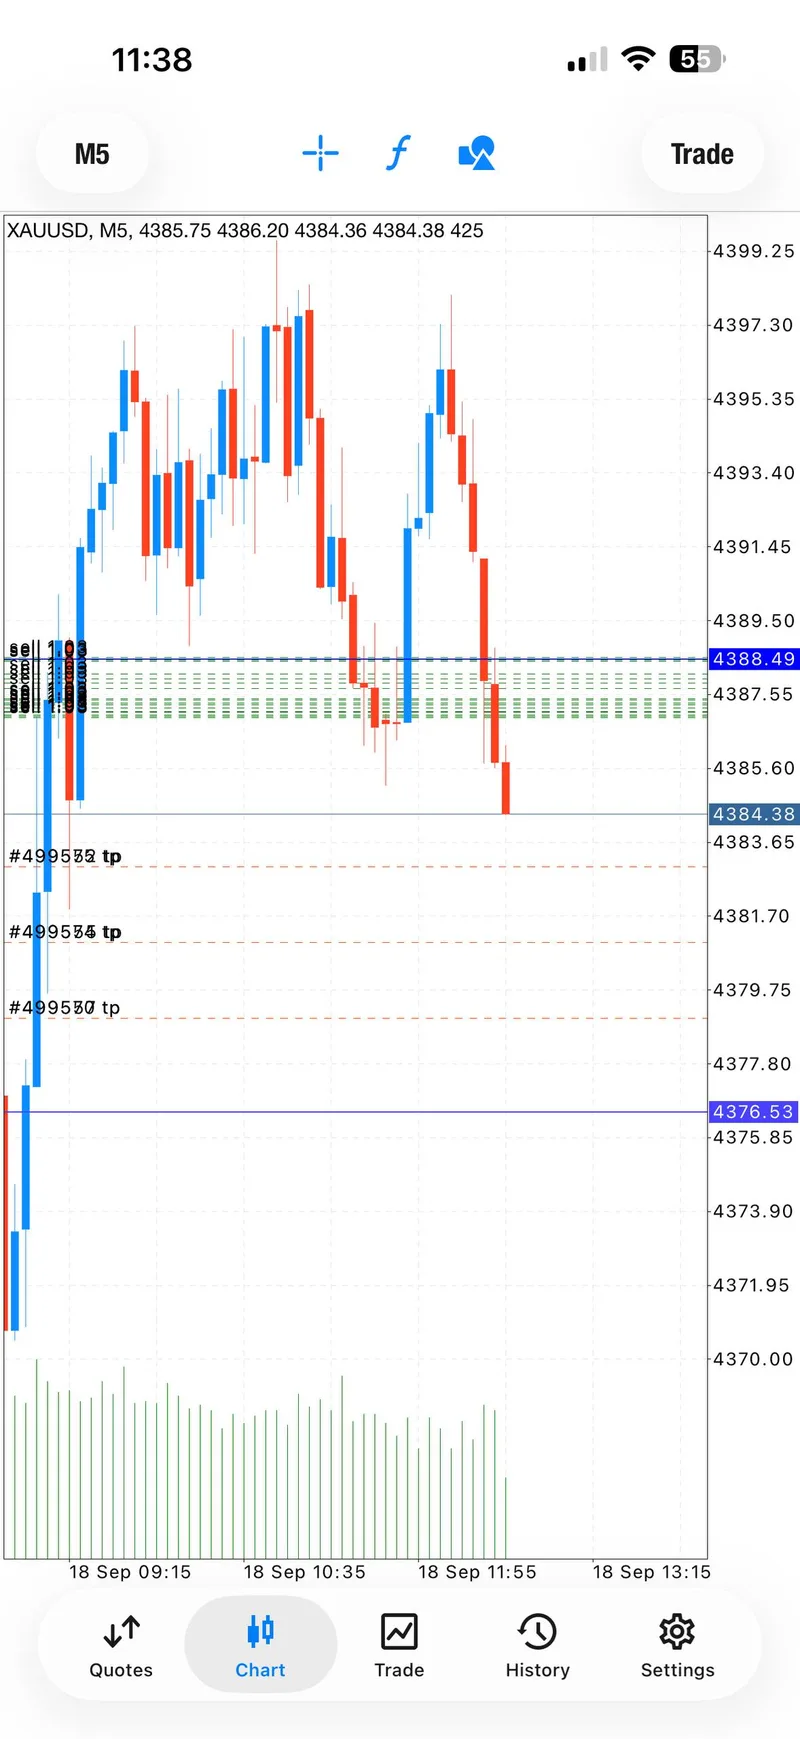
Tuesday shows the desk's character under pressure. The first 4,274–4,278 sell idea had a defined invalidation at 4,283. Early target checks did not prevent a later return to the zone. The public record said “Cut loss” and “Setup failed”; MO explained that accepting a small loss was preferable to defending a broken London-continuation assumption. The second sell was a new 4,284–4,288 plan with a new invalidation at 4,293, not a retroactive rescue of the first call. After price revisited entry, the desk waited for bearish hourly structure, took profit in stages, and later protected the remaining entries at the starting point. See the Tuesday risk-reset report for the complete sequence.
Wednesday's one defined buy offers the opposite lesson: a clean opportunity still required protection. The 4,340–4,336 zone listed 4,332 as the risk boundary and four fixed checkpoints. As the move accelerated, MO told readers to move protection to the starting point before the last checkpoint was reported. One runner was later closed while two stayed protected. The Wednesday report links the timing and account-specific proof without pretending the opening shout was a second trade.
Thursday began with a sell that checked two targets but returned to entry. MO said plainly that it had not made much profit. The later buy carried its own zone, stop, and five target levels; the public messages show protection being moved before the final milestone. That shift from modest defense to participation is more useful than a one-line “five targets” victory claim. The Thursday report preserves both halves of the day.
Day-by-Day Trading Narrative#
- Monday, September 14: One buy plan met four public checkpoints after the desk adjusted risk in a bearish session. The $25K daily report attributes the headline to the channel and keeps the account screenshot separate from follower outcomes.
- Tuesday, September 15: A failed first sell was closed and explained. A second, separately defined sell became the recovery sequence; the $30K message is a reported single-session figure.
- Wednesday, September 16: One fully parameterized buy moved rapidly through four reported checkpoints while protection tightened. The four-target report distinguishes the account screenshot from universal performance.
- Thursday, September 17: A protected sell produced little; the following buy recorded five target checks. The two-part report is the clearest contrast between patience and participation.
- Friday, September 18: The desk handled a sell and then a buy as separate plans. Each had a published risk boundary and four reported target checks. The Friday report shows why adapting direction matters more than defending one bias.
What Worked, What Failed, and Why#
What worked was making a new decision when the old one stopped being valid. Tuesday's first sell had early progress, yet MO still closed it when the expected continuation failed. That visible loss is important: a process that only displays profitable exits does not teach a reader how to survive the wrong call. The later recovery used a fresh entry band, stop, and target ladder. Thursday repeated the same discipline in a quieter way by accepting a small protected outcome before a new buy opportunity developed.
What failed was the assumption that a single direction would carry the whole week. Macro headlines and the Fed window made reversals fast. The desk's documented responses were concrete: define a zone, name the point where the idea is wrong, reduce exposure as targets arrive, and treat a new setup as new risk. Those choices do not eliminate losses or slippage. They give the reader a way to evaluate MO's judgment beyond the final account headline.
Community Proof and Trader Confidence#
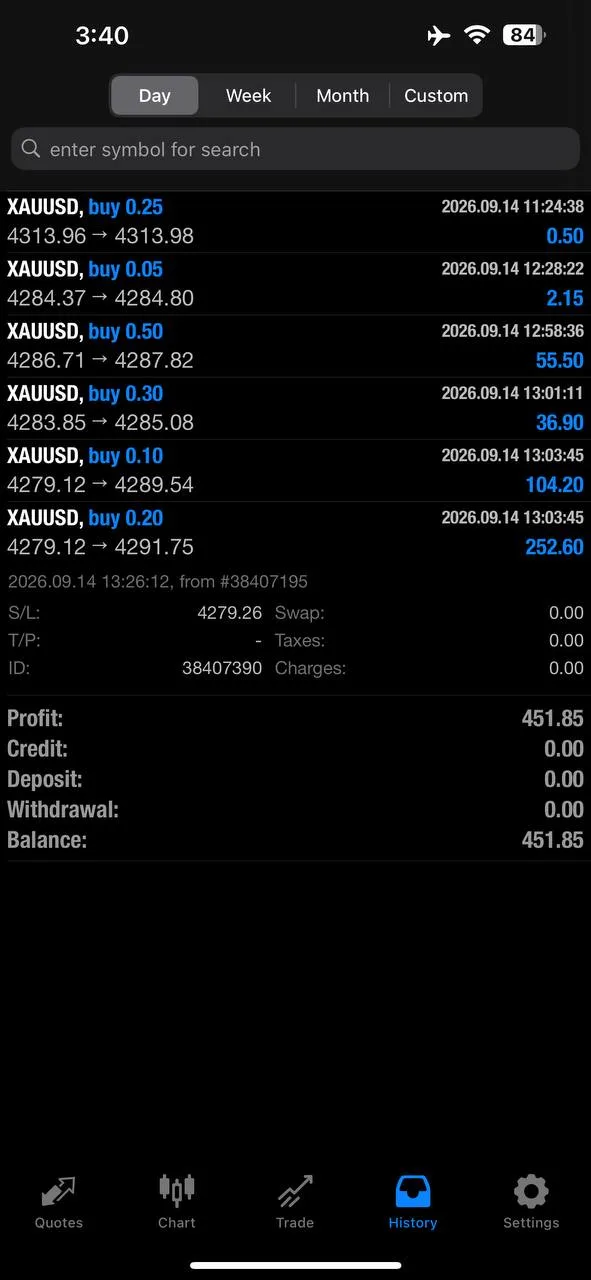
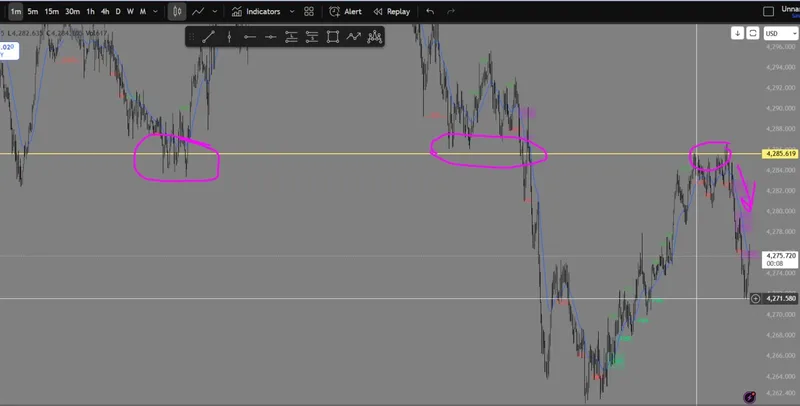
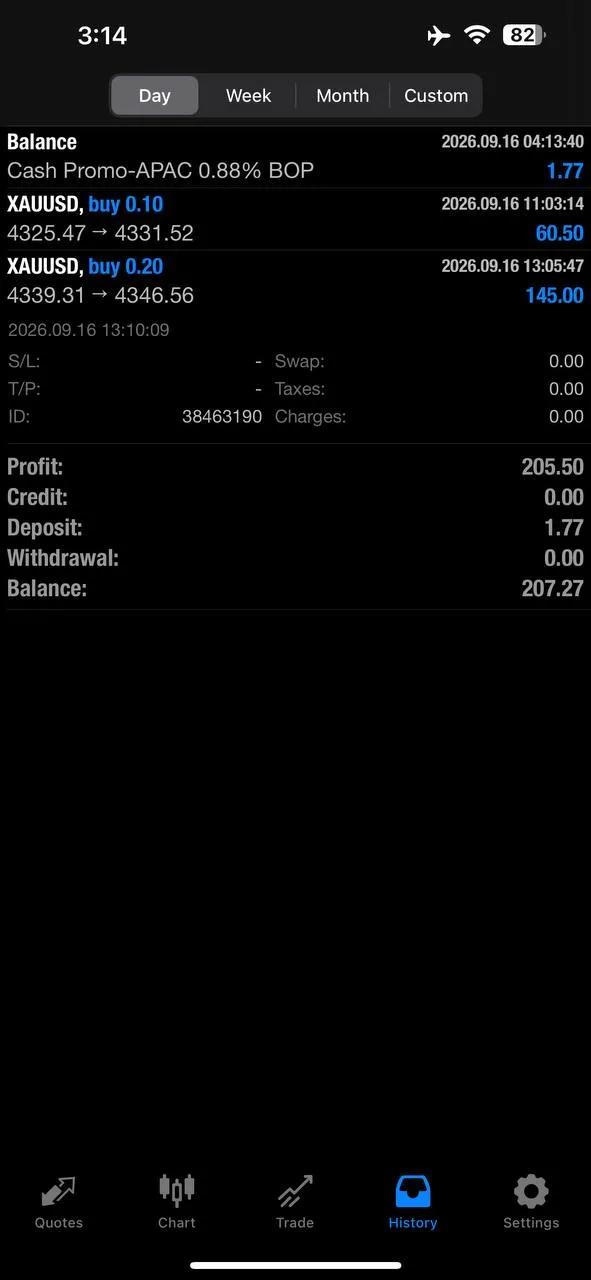

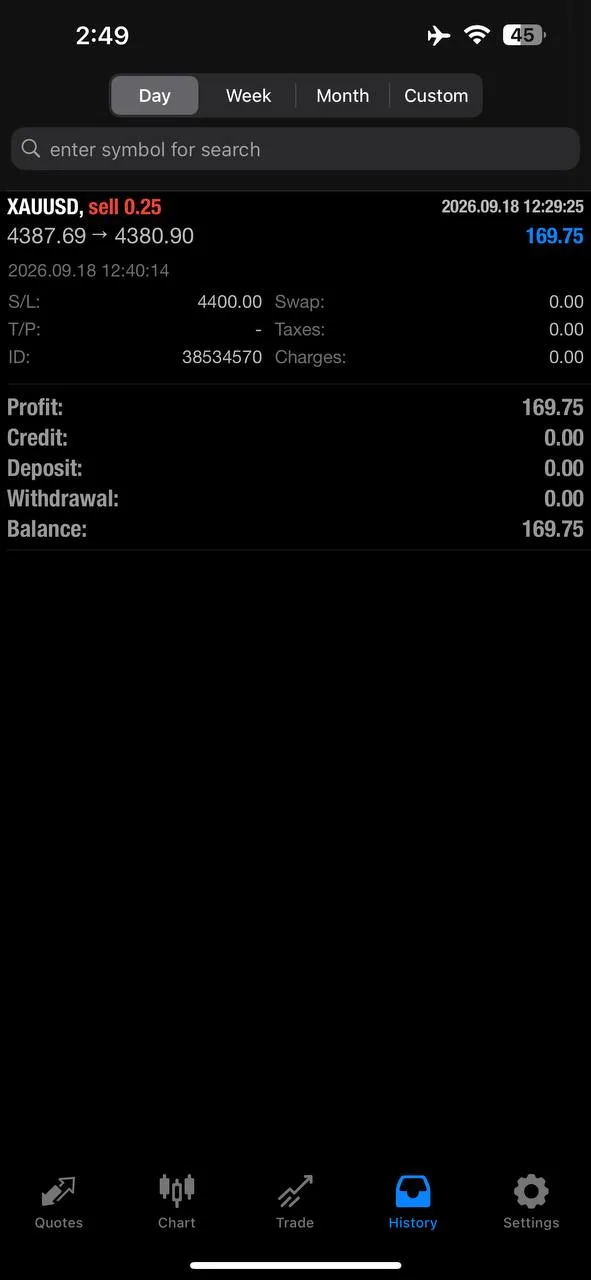
The selected weekly package includes five trade-sequence images and five community images, one of each from every day. The trade images help readers check the order of zones, target updates, and protection. Community screenshots show how individual readers responded, including smaller outcomes and earlier losses. They are examples, not a survey of typical performance. The full daily articles contain more context and more selected visuals than this weekly gallery; the ten images here are a route into that record, not the complete week's message count.
A particularly useful Friday distinction is the member who reported $750. That comment belongs to one person's experience. MO's separate channel statement about more than $13,000 is also a self-reported account claim. Keeping those voices apart is how the story stays compelling without borrowing one person's result to sell another person's process.
Key Levels and Scenarios for Next Week#
Friday's market research listed 4,380 and 4,335 as support references, with 4,400 and 4,439.80 as resistance references. Those are dated observations, not standing orders for Monday. If price holds above the nearer support and begins to accept higher levels, MO can wait for a fresh, bounded continuation plan rather than chase Friday's last move. If support fails quickly, the more useful response is to reassess the bias and keep risk small until a new zone and invalidation are clear. A move toward resistance without confirmation is still capable of reversing.
The practical lesson for next week is simple: carry forward the method, not the old entry prices. Review the prior forecast for the pre-week questions, then compare fresh market conditions with this week's daily evidence before acting. The next public setup needs its own current levels, risk boundary, and confirmation; a historical target ladder is not a live alert.
FAQ#
Did MO win every trade this week?#
No. Tuesday's first sell was publicly cut and marked failed. Thursday's early sell ended with limited profit after protection. Those moments are central to understanding the week.
Is $30,000 the weekly profit total?#
No. It was a self-reported Tuesday single-session message. Other daily figures refer to different sessions or individual account screenshots and are not added into an audited weekly total.
Why count eight plans when local records contain more signal-like messages?#
Several messages were openers, target updates, or risk changes for an existing plan. Counting only distinct published trade plans avoids presenting follow-up communication as new opportunities.
Can I use Friday's levels as a Monday signal?#
No. They describe Friday's snapshot. Wait for current context and a fresh plan with a defined invalidation before deciding whether any level still matters.
Connect with Gold Trader Mo#
If the combination of a visible loss, a disciplined reset, and staged protection is the way you want to study gold, message support @GTMOBest and ask about free VIP access. Start with the linked daily reports and judge the process for yourself. Access is an invitation to follow future education and updates, not a guarantee of profit.
This article is educational commentary. Trading involves risk of loss. Public messages and account screenshots show historical, individual records; fills, position size, costs, and outcomes differ between traders. Past results do not predict future results.