Market Snapshot#
September 17 was a reset-and-recovery session. The public @GTMO channel opened the day by noting that the previous day’s FOMC-driven gold drop of more than 1,000 pips had nearly recovered. That detail matters because the session did not begin from a clean chart: it began with traders deciding whether a dramatic move was still unwinding or ready to reverse again.
At the time of the intraday market snapshot used for this recap, XAUUSD was 4349.70 after a reported 4301.40-4354.60 range. DXY was 100.15, the U.S. 10-year Treasury yield was 4.952%, WTI was around 99.50, and the stated Fed target range was 3.75%-4.00%. These are open-session observations, not closing prices. No close is presented because the session was still active when those values were captured.
The useful headline came later in the same-day record: “Gold has recovered the entire FOMC crash,” followed by a single reported result of “$16,000+ UP.” That is one public result note, not an average, guarantee, or claim that every account moved the same way. Readers who want the next free gold signals and FREE channel access can message @GTMOBest early, then follow the evidence below.
The rest of this report keeps the market context in its proper role. Levels and macro snapshots help explain the setting, but the story is the sequence of two public calls, the protection decisions between them, and the feedback that followed.
Why The Tone Changed So Fast#
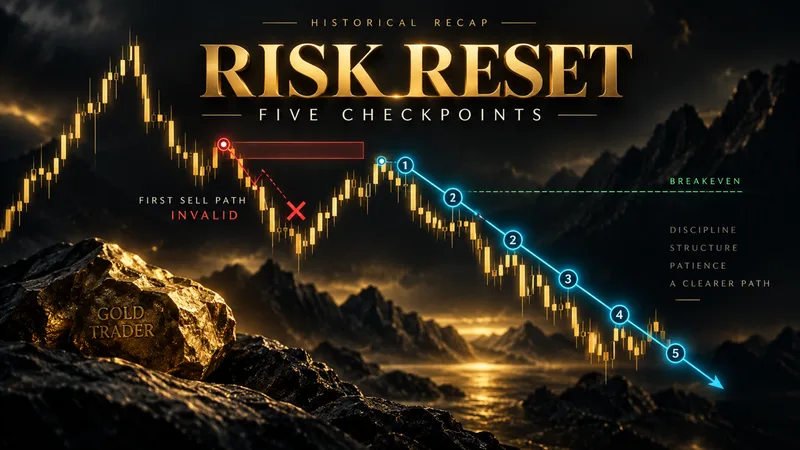
The tone changed because the first idea did not become a one-way victory. A SELL call appeared at 09:43:37 UTC, moved through an initial target, and then returned toward entry. Instead of hiding that uncomfortable middle, the channel recorded a breakeven move and a smaller-profit outcome. That pause reset expectations.
By 10:33 UTC, the public commentary described the FOMC retest as difficult and urged very low risk. At 10:38 UTC, a member message said the earlier breakeven decision avoided a loss and closed small profits. That is the point where the day’s tone changed: protection became more important than forcing another entry.
The second call arrived at 10:59:44 UTC, less than half an hour after that caution. It was a BUY setup with a defined zone and a ladder of five target levels. The record then became much cleaner, but only after the earlier trade had shown why patience and a no-risk decision were necessary.
This is a different lesson from simply posting a winning screenshot. Compare the sequence with the September 16 daily report, where a four-target move carried the story. On September 17, the more important contrast is between a protected first attempt and the stronger continuation that followed.
Technical Outlook#
The intraday context places 4300 and 4282 as reference supports, with 4355 and 4400 as reference resistances. They are observational levels from the market snapshot, not instructions to place an order. The public trade zones were narrower and time-specific: the first SELL was 4310.2-4314, while the later BUY was 4325.7-4322.
That distinction is useful. A market can print a broad range while a signal still depends on a small execution area and a clear invalidation point. The first call listed 4318 as its stop. The second listed 4317. Those numbers describe the historical plans that were shared; they do not turn this recap into a live trading prompt.
Gold’s observed intraday range also explains why the protection language kept returning. A move from 4301.40 to 4354.60 leaves plenty of room for false confidence. Traders reading the next session should watch whether price accepts above the 4355 reference, rejects it, or rotates back toward the 4300 area. Confirmation matters more than assuming the recovery must continue.
For another risk-reset comparison, see the September 15 daily report. Its value is not a promise that the same pattern repeats, but a reminder that a clean recap must show the conditions that made the setup usable.
Trading Signals#
Signal 1#
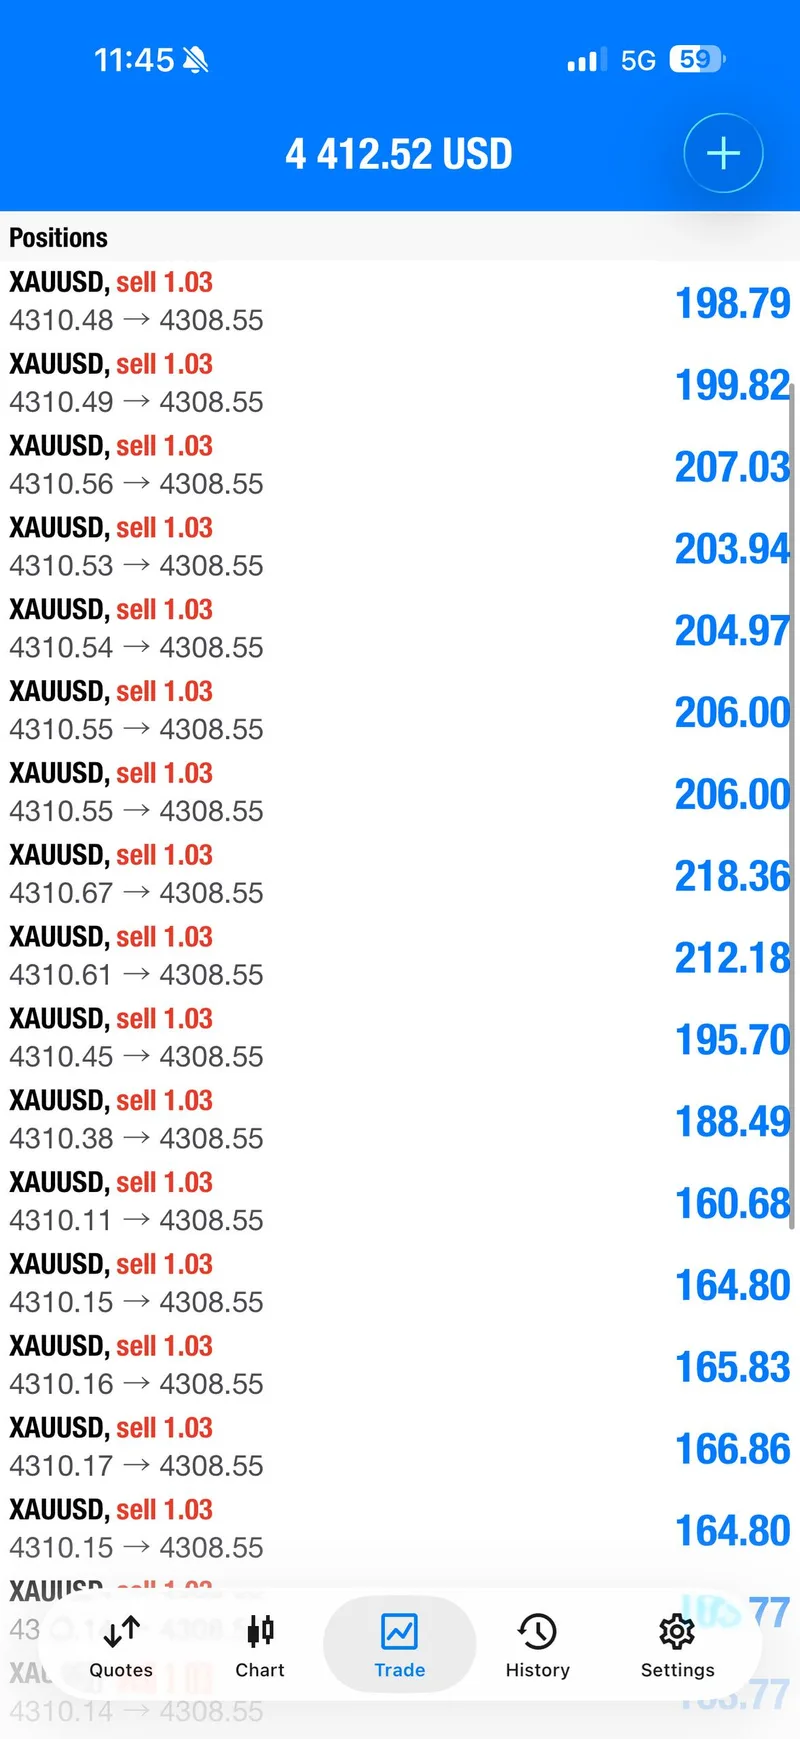
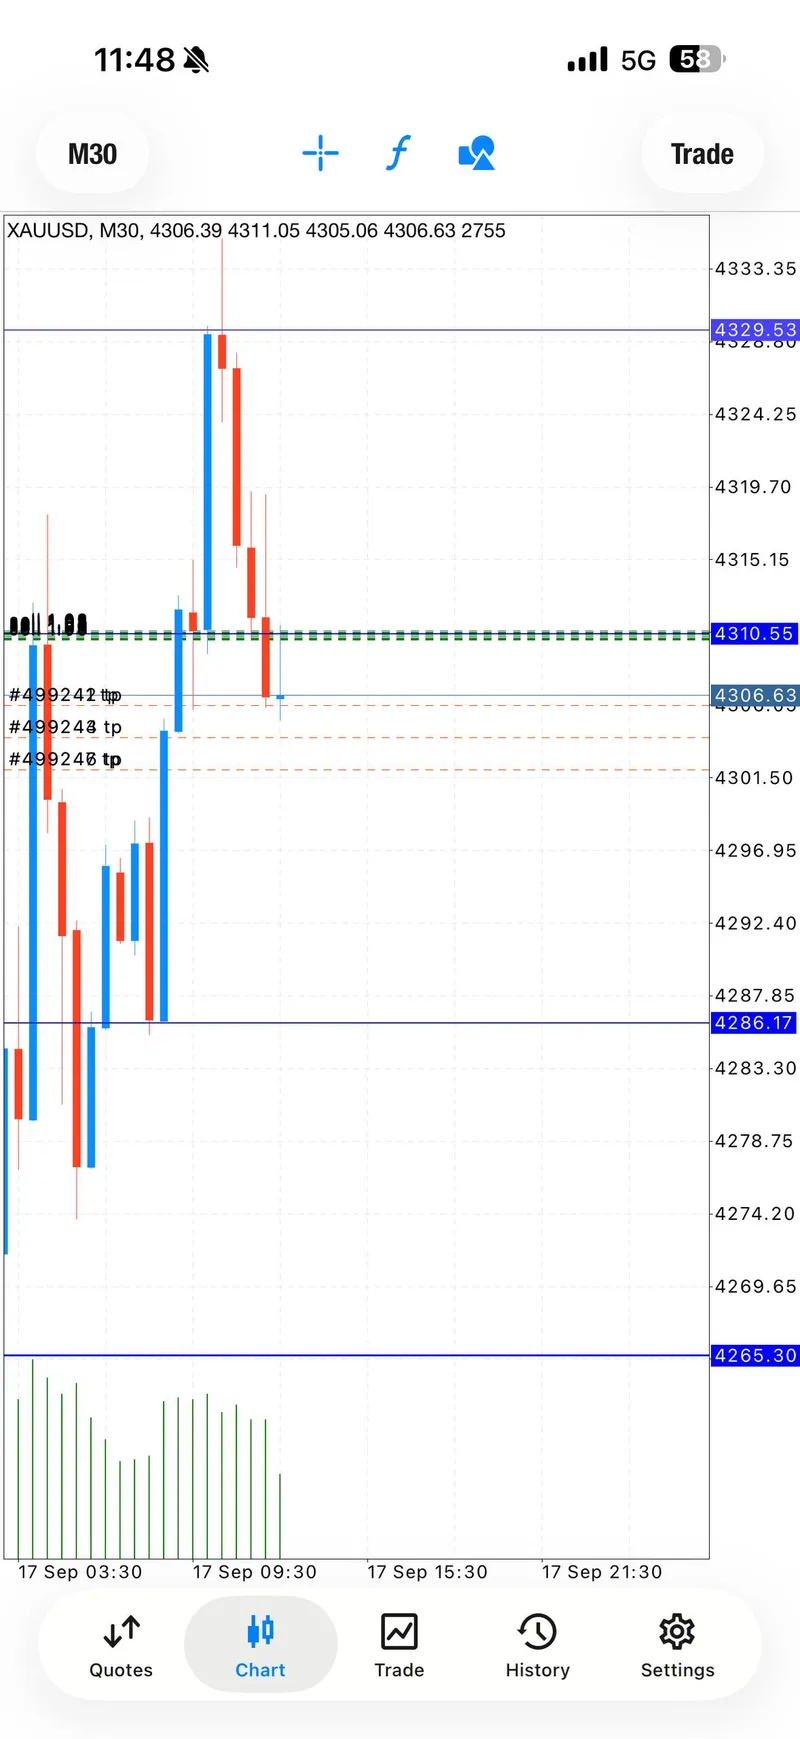
The first historical call was a SELL at 09:43:37 UTC. The shared zone was 4310.2-4314, with a listed stop at 4318 and target levels at 4308, 4306, 4304, 4302, and an open extension.
The public record then moved quickly: TP1 was posted at 09:46:09, TP2 was described as inbound at 09:48:49, and price was back at entry by 09:54:30. At 09:59:46, the channel said breakeven had been set so the remaining position carried zero risk while traders could take profit according to their own comfort. Breakeven was reported hit at 10:06:35, followed one minute later by a clear two-target check and the decision to keep the rest at no risk.
The important line came at 10:11:05: the channel acknowledged that this trade did not make much profit. That admission is why this signal belongs in the report. It demonstrates that a target check and a breakeven exit can still be a useful outcome without being inflated into a major win. A later member message described the same choice as avoiding a loss and closing small profits.
Signal 2#
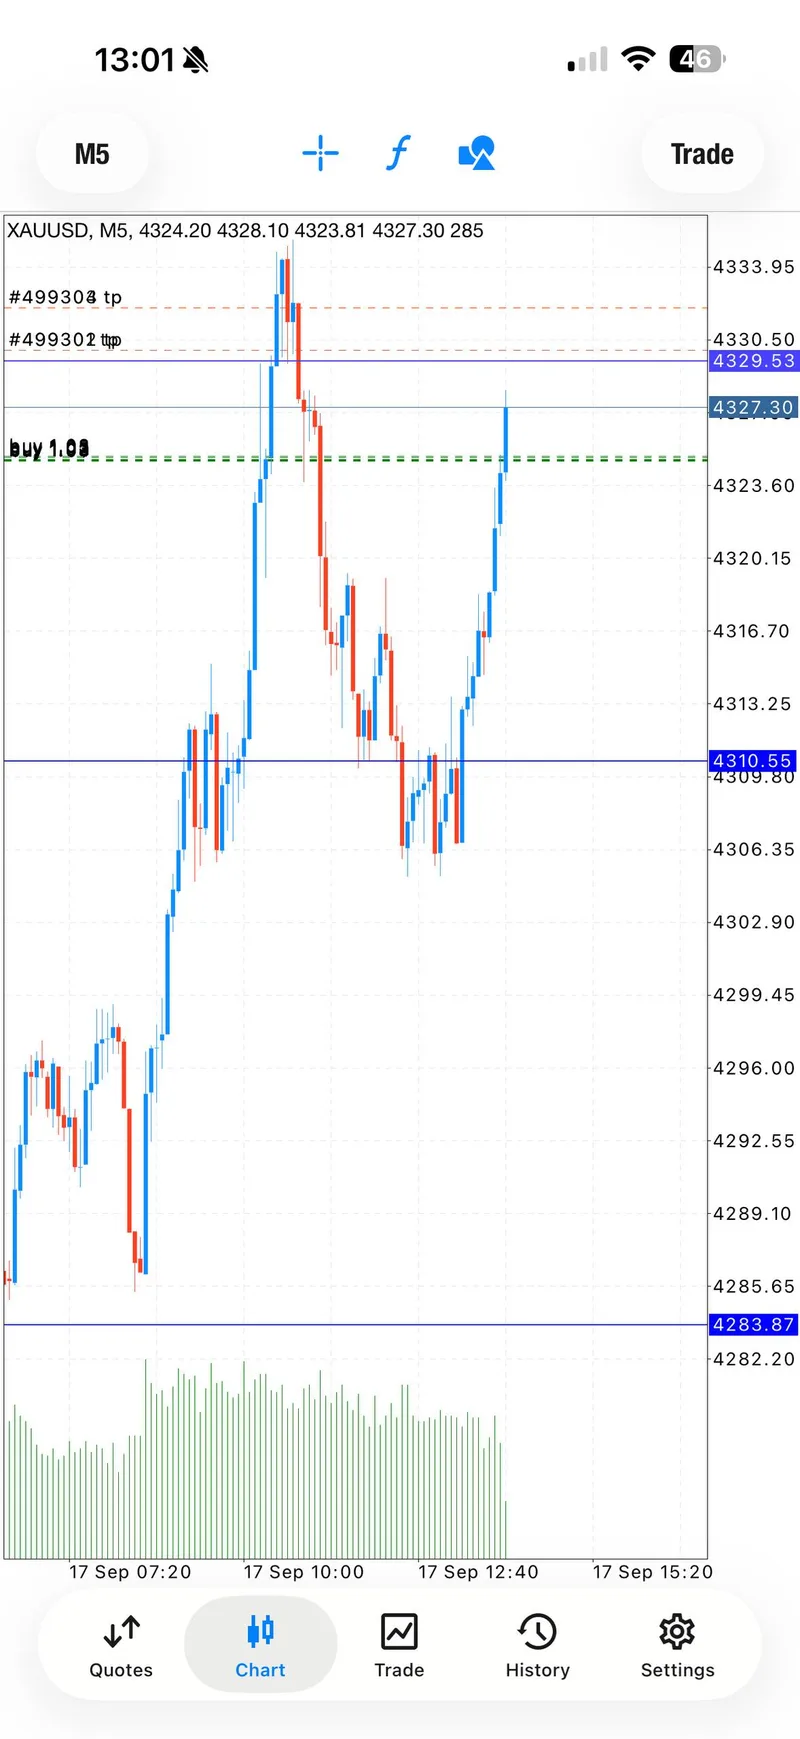
The second historical call was a BUY at 10:59:44 UTC, followed by the detailed zone at 11:00:39 UTC. The entry area was 4325.7-4322, the listed stop was 4317, and the target ladder was 4328, 4330, 4332, 4334, and 4336, plus an open extension.
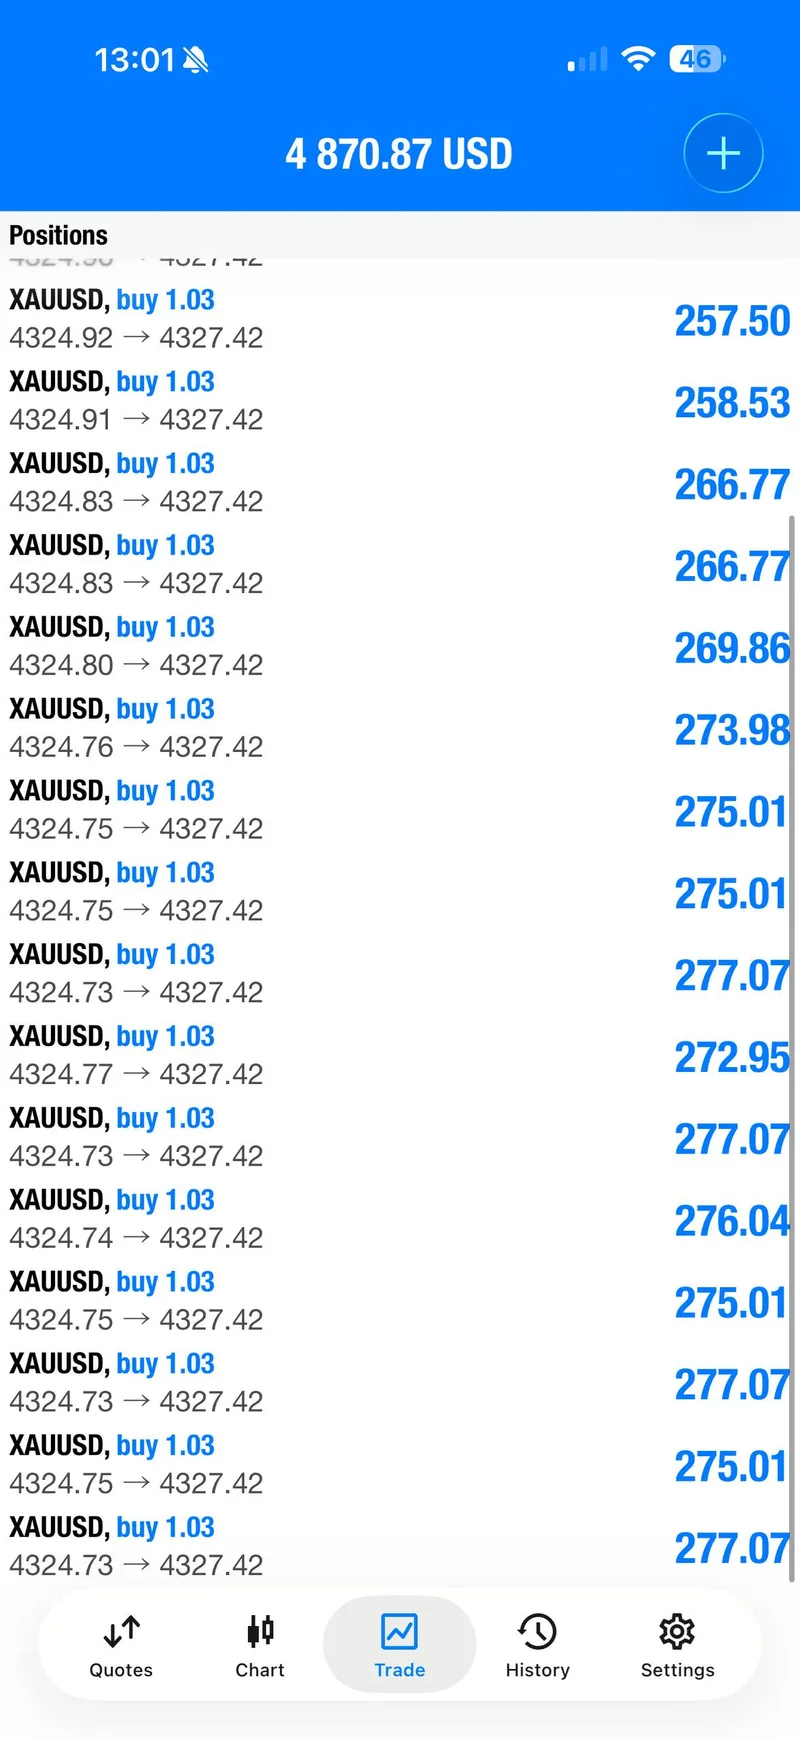
The follow-through was documented step by step. A floating profit update appeared at 11:01:29. TP2 was incoming at 11:02:11, TP3 was coming at 11:05:21, and breakeven protection was set at 11:05:38. TP3 was posted at 11:07:38, TP4 at 11:09:52, and a TP5 check at 11:10:11. The next messages reported 130+ pips at 11:10:52 and 150+ pips at 11:11:11. At 11:40:33, the follow-up stated that all five target checks had been hit.
That is a strong historical sequence, but it still has boundaries. It describes the public record for this call and its follow-ups. It does not describe every trader’s fill, spread, size, or exit, and it is not a signal for the next session.
Signal Performance Breakdown#

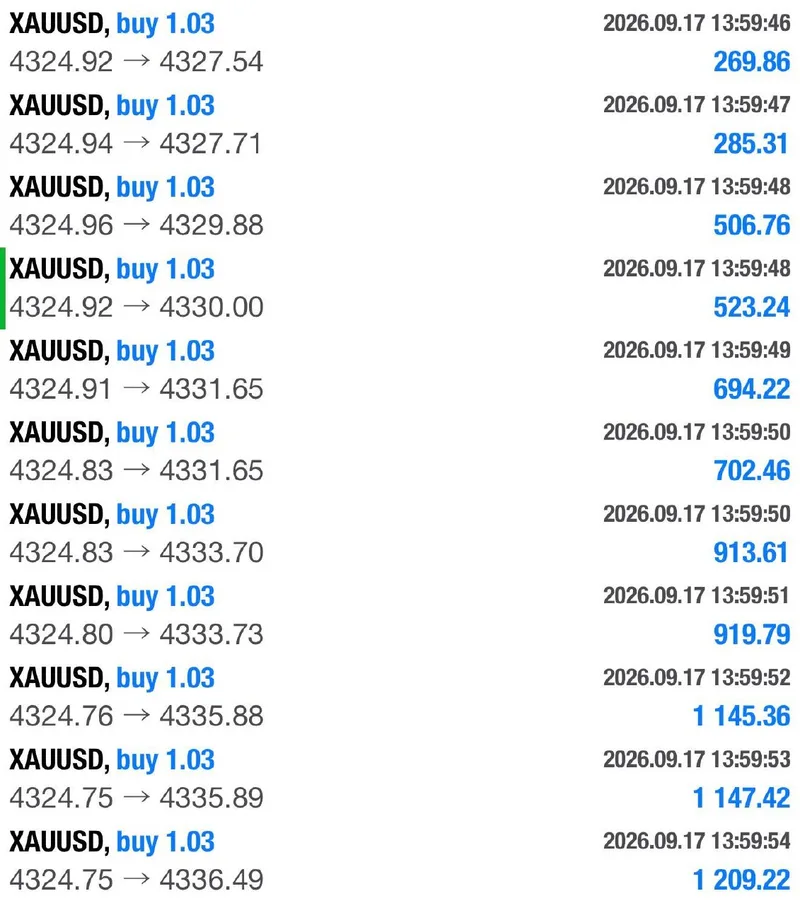
The cleanest way to read the day is as a transition from protection to participation. The SELL sequence produced two target checks and then protected the remaining exposure when price returned to entry. The BUY sequence used the same risk language, moved protection to breakeven, and then documented five target milestones. One public result note later reported $16,000+ up after the recovery. Those statements can coexist because they describe different moments and one reported account, not a single universal score.
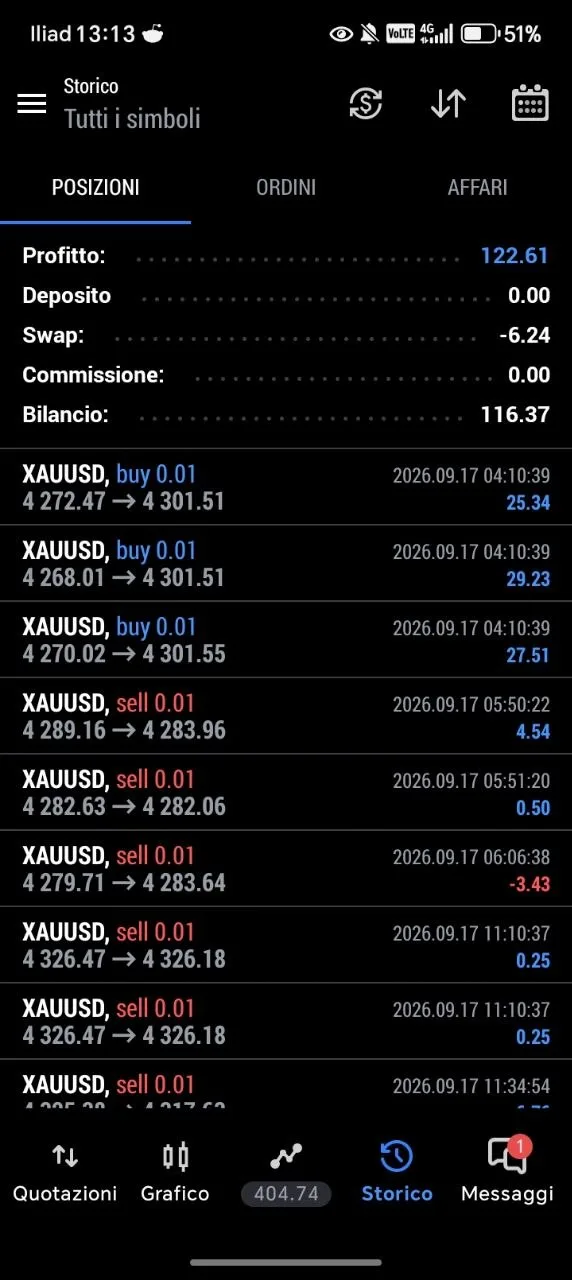
Exactly 19 member feedback messages were recorded for September 17. This article selects 10 public proof screenshots for the gallery: six trade-sequence frames and four member-feedback frames. The counts are deliberately separate. Nineteen is the total response volume; ten is the selected visual proof count. The member subset of those visuals is four.
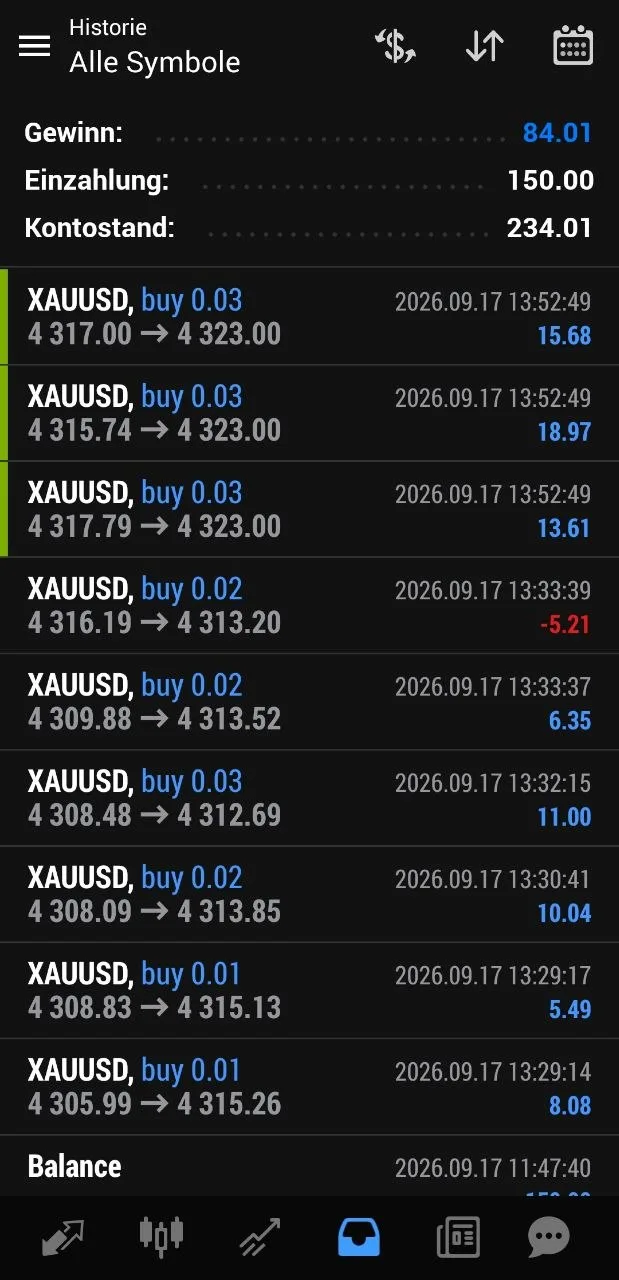
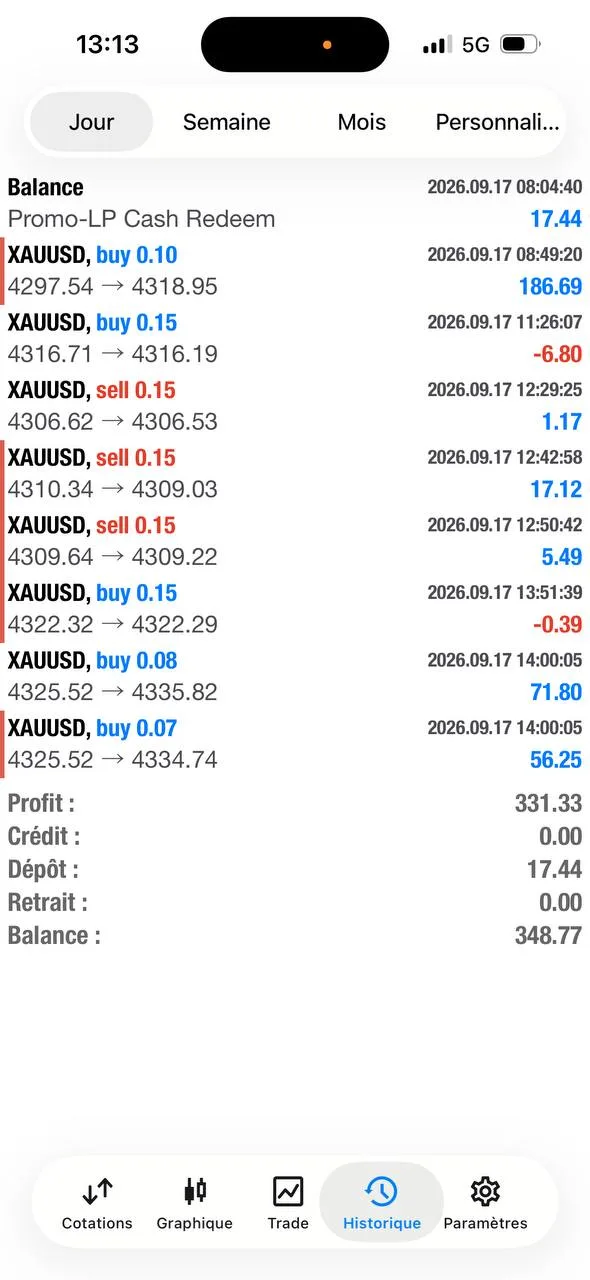
The member responses also vary in size and tone. One screenshot accompanies a reported 94.08 result. Another shows a 122.61 result line while the member talks about learning and discipline. A German-language history view shows an 84.01 line, and another history screen shows 331.33 while leaving small losing entries visible. None of those images is used to imply a typical return. Together, they show why feedback is supporting context rather than a substitute for the signal record.
For a broader benchmark, the September 14 daily report shows how a larger result can become misleading if the path is omitted. September 17 is more useful when the path stays visible.
Execution Lessons#
First, a protected trade is still information. The SELL plan had a zone, stop, and multiple targets, but the market returned to entry. Moving to breakeven limited the downside and kept the recap honest. The channel’s own “not much profits” message is more valuable than a cropped chart that removes the difficult part.
Second, staged targets give a fast move structure. The BUY plan did not rely on one dramatic exit. It named five levels, checked them in order, and moved protection before the final stretch. The reported 130+ and 150+ pips came after that sequence had already been made safer, not before.
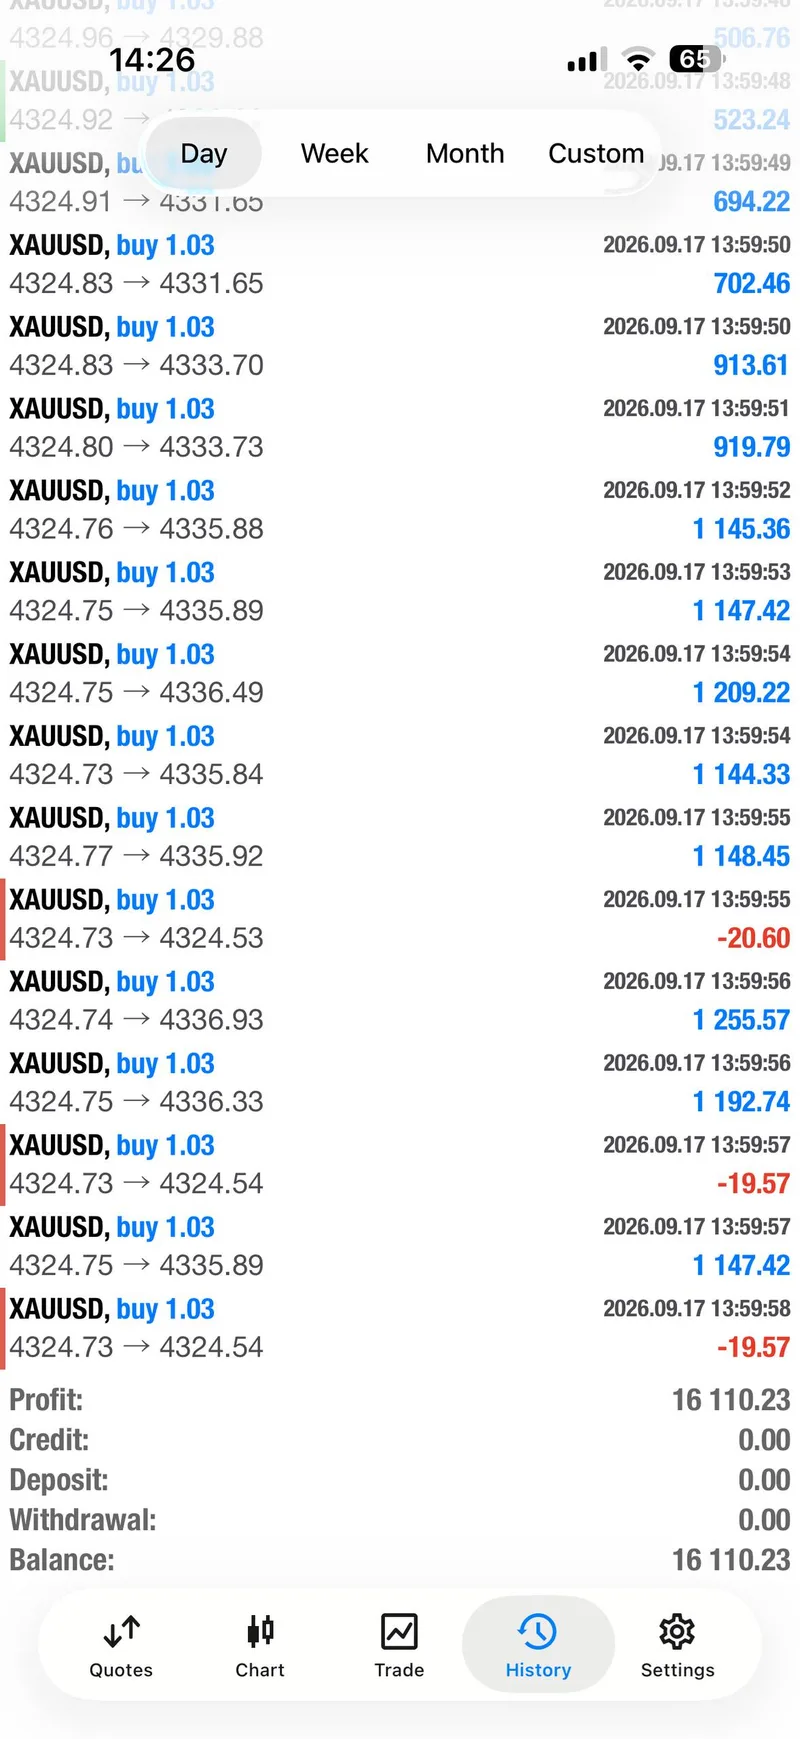
Third, account screenshots need scope. The 16,110.23 line visible in one public result image is consistent with the separate “$16,000+ UP” message, but it is still one account’s displayed result. It is not a promise, a benchmark, or a reason to increase risk.
Finally, the day rewards confirmation over bravado. A trader can acknowledge a small result, wait through a retest, and still participate when the next structure becomes clearer. That combination of honesty and adaptation is the actual edge illustrated by this recap.
What The Day Means Going Forward#
The next session should not be approached as a replay button. The intraday snapshot was still open, and closing values were unavailable, so the safest forward-looking conclusion is conditional: watch how price behaves around the 4355 and 4300 reference areas, and require confirmation before assuming the same recovery path.
The public record also leaves a practical checklist. If a move reaches an early target and then returns to entry, decide in advance how breakeven protection changes the plan. If a later continuation starts to print sequential milestones, protect the position before celebrating the last one. If the market remains headline-sensitive, reduce the temptation to turn one account result into a forecast.
That approach preserves what was good about September 17 without pretending the day was easy. The first call was modest, the second was stronger, and the community response added color without changing the underlying evidence. Readers get a useful report because the recovery, the reset, and the risk boundary are all in the same frame.
FAQ#
Was the first SELL a large winning trade?#
No. The public record shows two target checks, a return to entry, breakeven protection, and a later acknowledgement that the profit was limited. It should be read as a risk-managed sequence, not a large-win claim.
What does “five targets” mean in this report?#
It refers to the five target levels listed for the historical BUY setup and the follow-up messages that checked TP1 through TP5. The 11:40:33 public update said all five checks had been hit. Individual fills, sizing, and exits can differ, so the phrase does not guarantee the same result for every reader.
Is the $16,000+ figure a typical member result?#
No. It is one same-day public result note, supported by a matching result screenshot that displays a 16,110.23 line. The article keeps it scoped to that report and separately counts the 19 feedback messages.
Where can readers follow the next update?#
Readers can follow the free GTMO channel and message @GTMOBest for free signals and FREE channel access. The invitation is for access to future public updates, not a promise about the next trade.
Connect with Gold Trader Mo#
If this kind of evidence-first recap is useful, start with the Gold Trader Mo home page and keep the daily reports archive nearby for comparison. Then message @GTMOBest for free gold signals and FREE channel access.
The public channel is where readers can follow the next setup as it develops. The reports add the slower layer: entry zones, direction, target progression, breakeven decisions, pips or points reported, and the conditions that made the result possible. That combination is more useful than a single cropped profit number.
This report is historical education and commentary, not financial advice or a live instruction. Gold and leveraged trading can lose capital. Past results, including the five-target sequence and one reported $16,000+ account result, do not guarantee what happens next.