Market Snapshot#
September 14, 2026 was a sharp, headline-sensitive gold session in which the public @GTMO record documented one buy setup, four planned checkpoints, and a later $25,000 day claim. At 21:03 GMT+7, while the global spot session was still open, XAUUSD was quoted at 4,286.36. That is an intraday snapshot, not a daily close, so this report does not turn it into a settled closing price. Readers who want the next free gold-signal update can message @GTMOBest.
The same-day market range was reported around 4,266.66 to 4,355.26. The distance between those levels explains why risk control mattered as much as direction. The visible market coverage tied the pressure below 4,300 to stronger-than-expected August CPI at 3.4%, higher energy prices after reported disruption around Saudi oil infrastructure and shipping, and rising yields that revived expectations of tighter Federal Reserve policy ahead of the next FOMC meeting.
| Metric | September 14 reading |
|---|---|
| XAUUSD spot | 4,286.36 at 21:03 GMT+7 |
| XAUUSD intraday high | 4,355.26 |
| XAUUSD intraday low | 4,266.66 |
| DXY | Not available in the captured snapshot |
| US 10Y yield | Precise snapshot not available |
| WTI | Precise snapshot not available |
| VIX | Not available in the captured snapshot |
| Fed target range | Not available in the captured snapshot |
The missing macro fields are left blank on purpose. A transparent intraday snapshot is more useful than a complete-looking table filled with numbers that were not isolated at the observation time.
Why The Tone Changed So Fast#
The tone changed because gold was falling hard even as the public trade record was managing a rebound from a tightly defined buy zone. The macro backdrop encouraged caution, while the tape rewarded a fast reaction when price returned to the area Mo had marked.
That contrast is the central story. The report is not claiming that one Telegram setup controlled the market. It shows that the public sequence stayed readable under pressure: define the zone, state the risk cap, reduce risk as price improves, and avoid pretending a volatile session is effortless.
For context, Gold Report — September 11, 2026: Two Setups, $17.4K Closed covered a more complicated Friday with two public directions. September 14 was narrower: one documented buy idea, then a long chain of protection and target updates.
Technical Outlook#
The market snapshot leaves four useful reference points for the next session:
- 4,266.66 is the first support reference from the reported intraday low.
- 4,221.00 is the next lower support reference if that floor gives way.
- 4,355.26 is the first resistance reference from the reported intraday high.
- 4,400.00 is the next upside reference if price can reclaim the upper range.
Those levels are not a forecast or an instruction to trade. They are a map for asking better questions. Does price hold the lower support after a retest? Does a recovery stall below 4,355.26? Does a move through 4,400 come with follow-through, or only a brief spike?
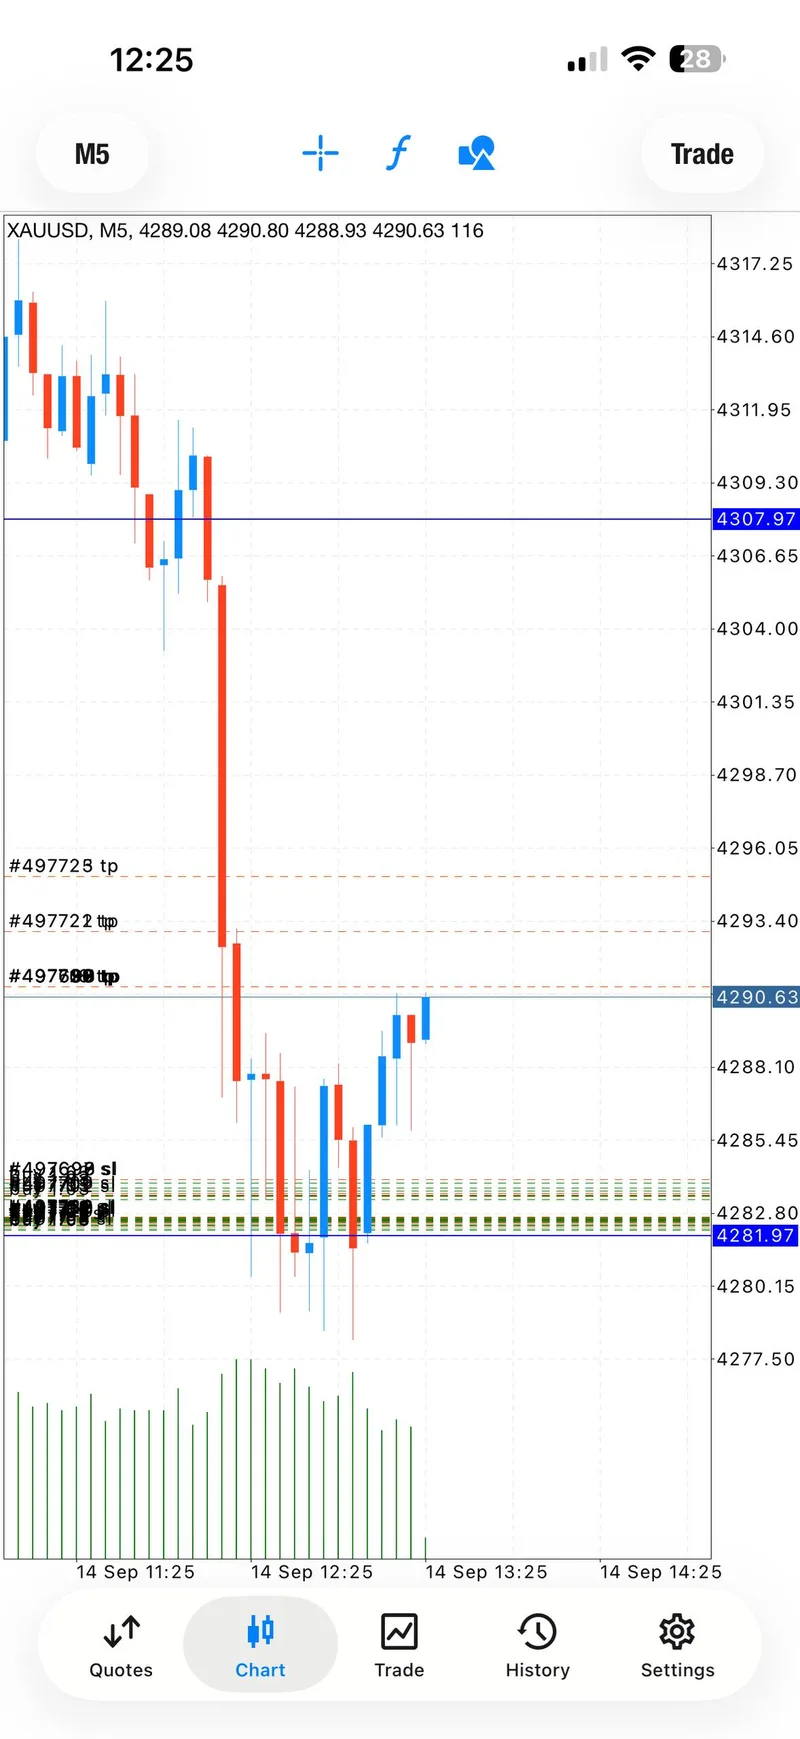
The public chart sequence also showed why level selection should be paired with timing. The buy plan was shared near 4,286.5–4,282, while the broader market was still capable of printing a much wider range. Readers who want a second comparison can review Daily Gold Trading Report — September 10, 2026: Six Targets, where target progress and a later reset produced a different type of day.
Trading Signals#
Signal 1 — BUY zone at 4,286.5–4,282#
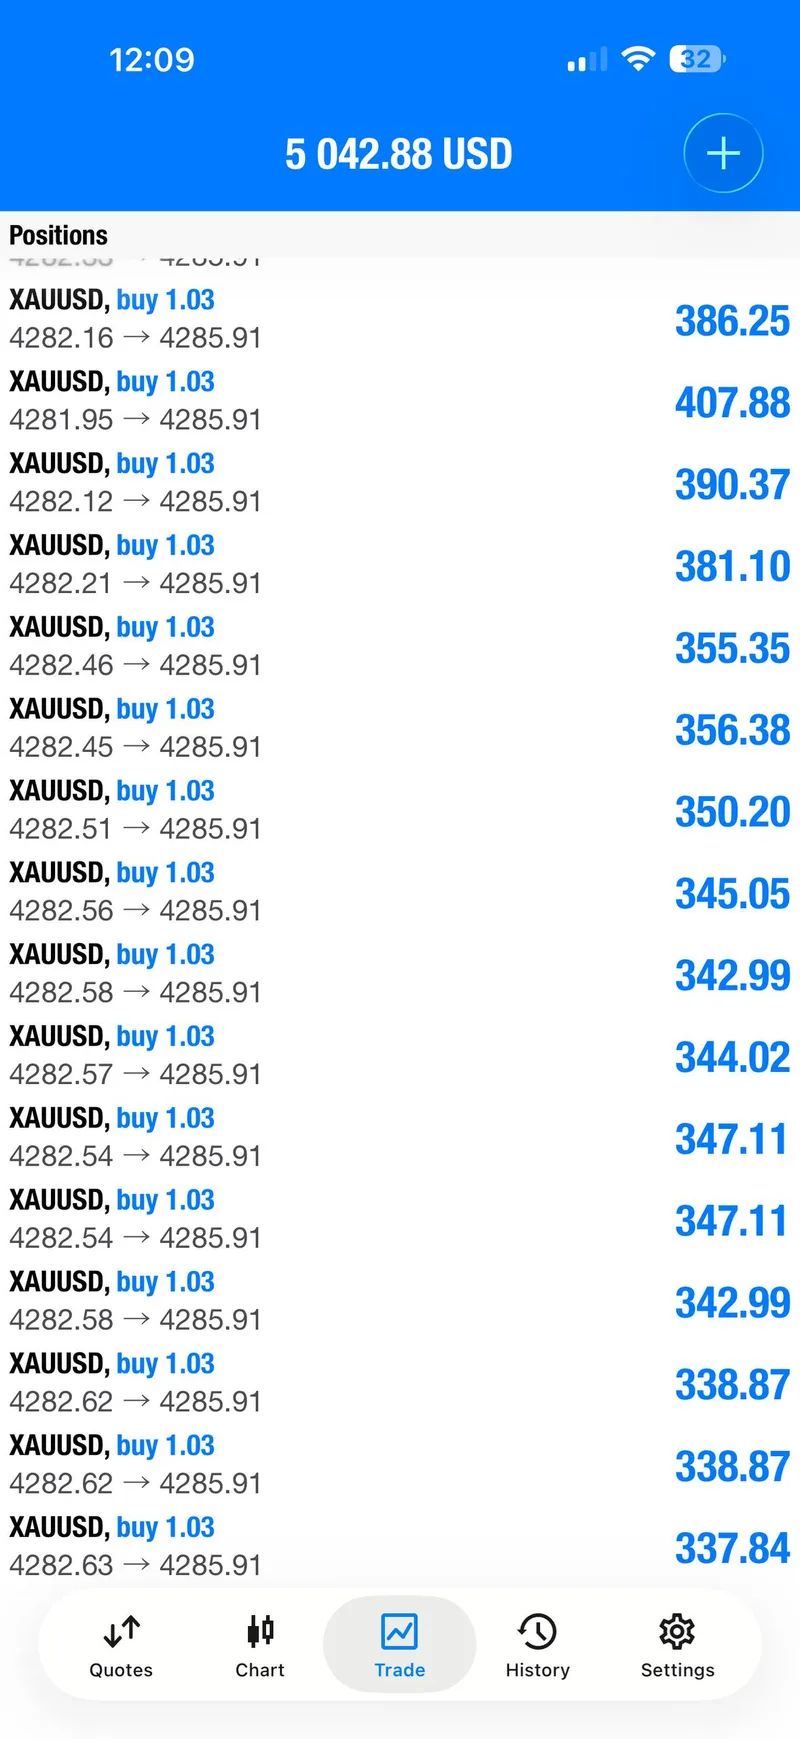
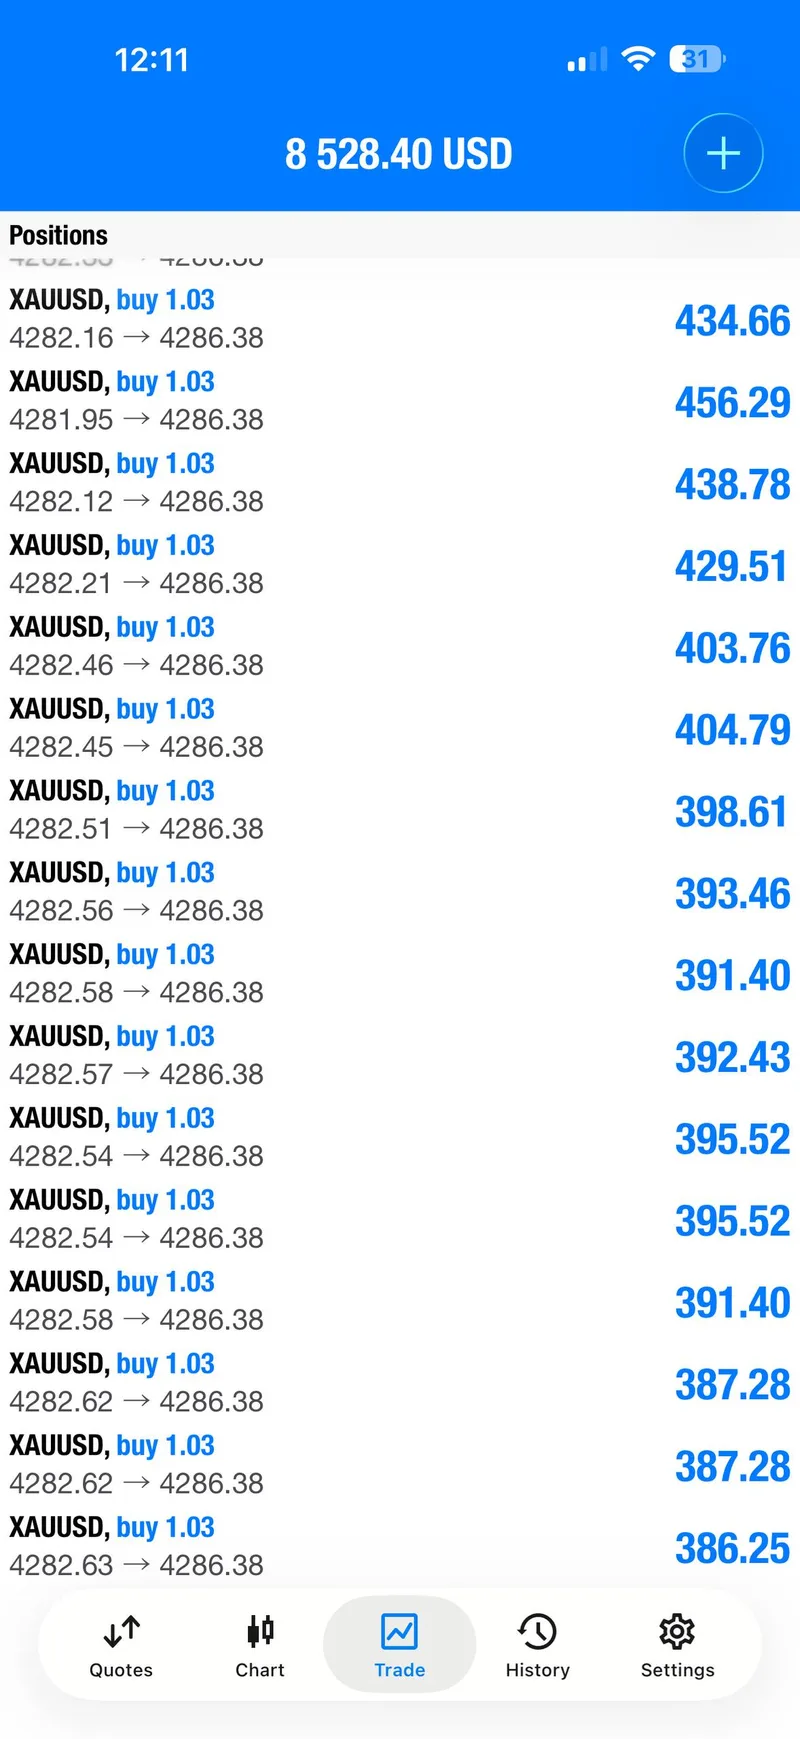
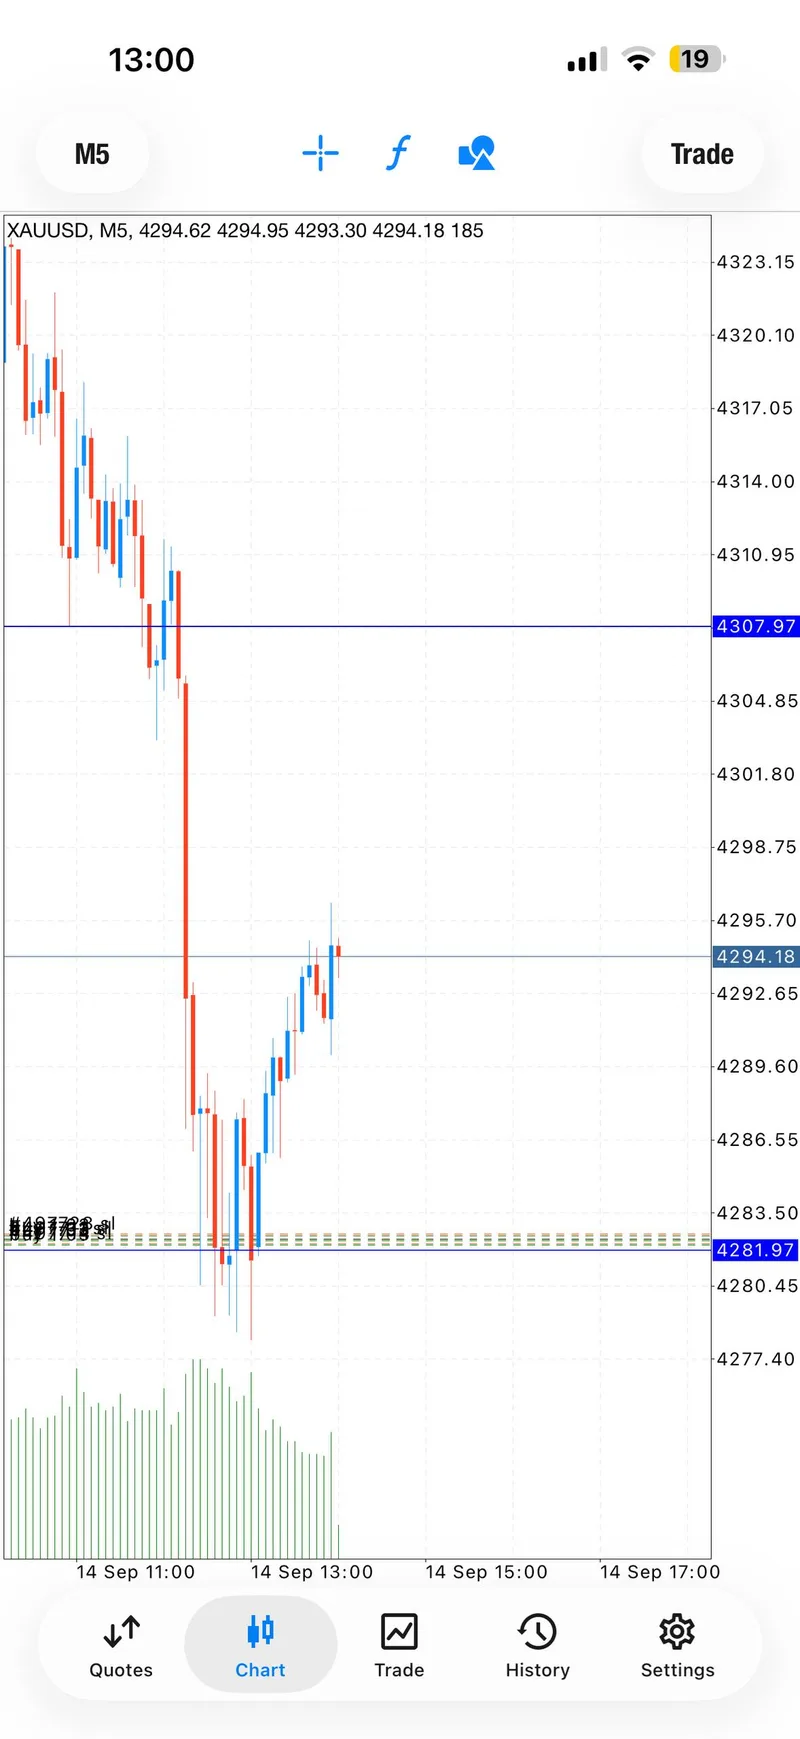
At 09:59:51 UTC, the public record posted “Gold buy now” with a 4,286.5–4,282 zone. The original risk cap was 4,276. The planned checkpoints were 4,289, 4,291, 4,293, and 4,295, with a runner left open rather than a promise that every position would close at one price.
At 10:04 UTC, the risk cap was moved to 4,275. A few minutes later the public updates described the move as back in profit and then showed all tracked positions in profit. That change in language matters because the record did not hide the difficult part of the move: gold had pushed into the lower end of the zone before the rebound appeared.
By 10:13 UTC the first checkpoint was being tested. At 10:16 UTC, Mo said the best positions were being moved to break-even because the day’s bearish pressure was dangerous. The record then marked the second checkpoint near 4,291, followed by the third near 4,293 and the final planned checkpoint near 4,295.
What the sequence proves#
The sequence proves a process, not a guaranteed outcome. The public messages show a defined area, a visible risk adjustment, partial profit-taking, and a decision to protect the best positions before the broader market had settled. They do not prove that every reader received the same fill, size, spread, or account result.
The channel later described a 100-plus-pip move from one position and a 120-plus-pip extension across the sequence. Those are historical channel statements, not an independently calculated universal return. The cautious reading is still compelling: the trade moved far enough for protection to be tightened and for four checkpoints to be marked in the public record.
Signal Performance Breakdown#
From first reaction to four checkpoints#
The timing was unusually easy to follow. The zone was posted at 09:59:51 UTC, the risk cap was adjusted at 10:04 UTC, and the first profit language arrived around 10:10 UTC. By 10:26 UTC the record said the best positions were at break-even and that half could be taken around 4,291. Around 11:01 UTC, the public chart check showed all four planned checkpoints with four runners still open.
That last detail is why this report uses the wording “four checkpoints completed” instead of claiming one universal account close. The later messages discussed closing another position and still holding three, while the 13:11 UTC recap posted a $25,000 day headline. The headline is a real same-day public claim; it is not a broker-audited statement for every follower.
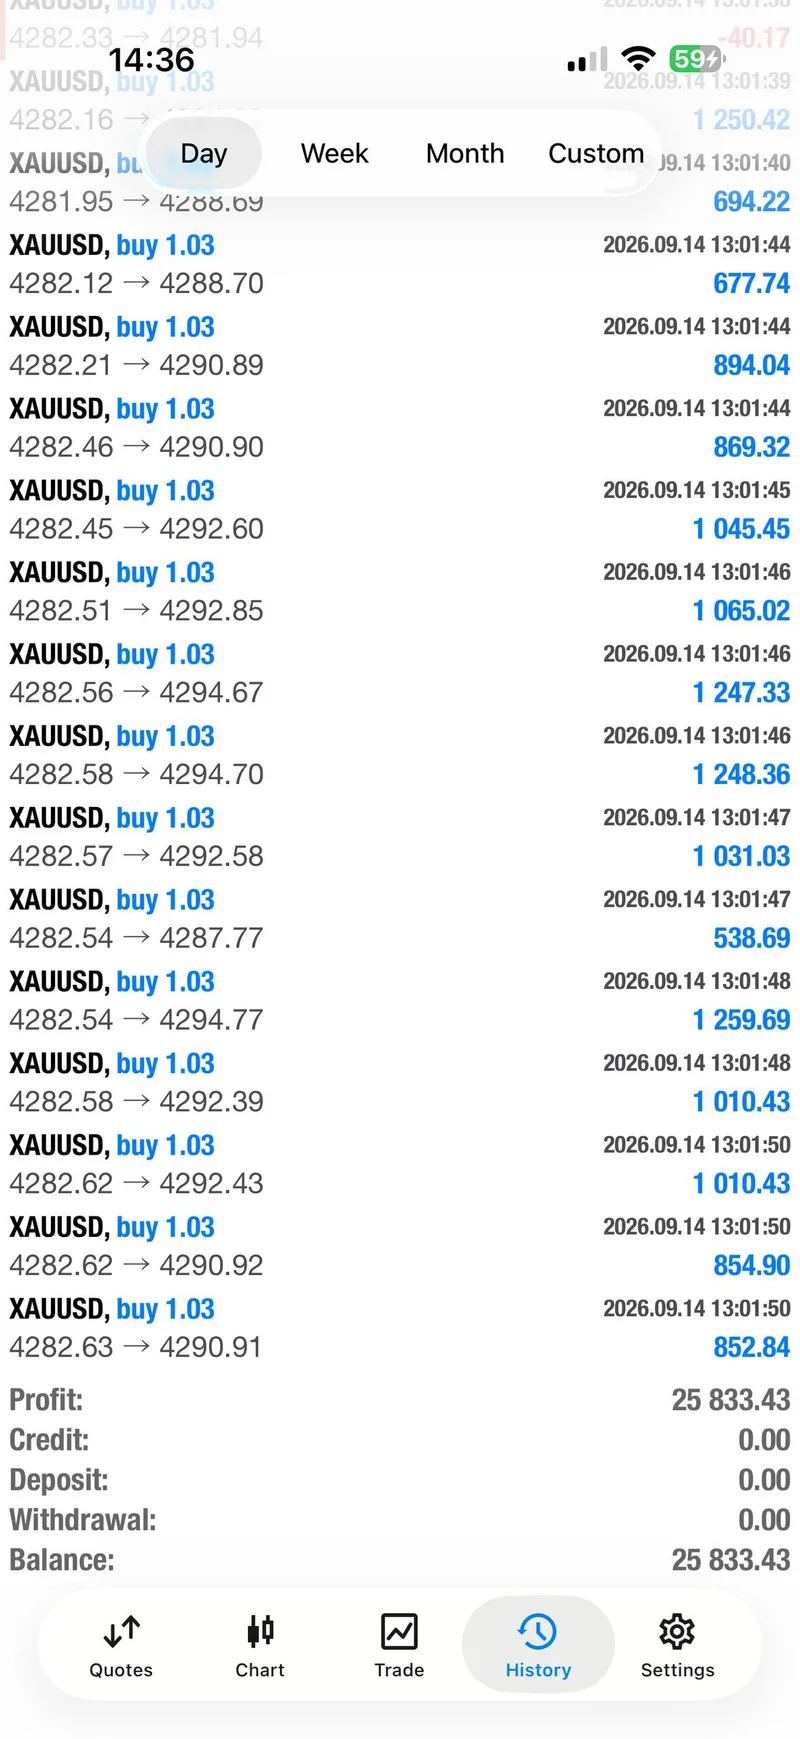
The strongest visual proof follows the sequence itself: chart screenshots show the rebound and risk-reset phase, the four-checkpoint chart preserves the target map, and the day-summary history screenshot shows an account-specific $25,833.43 profit and balance figure. That account screenshot should be read as one visible account record, not as a promise of identical results.
Selected community proof#
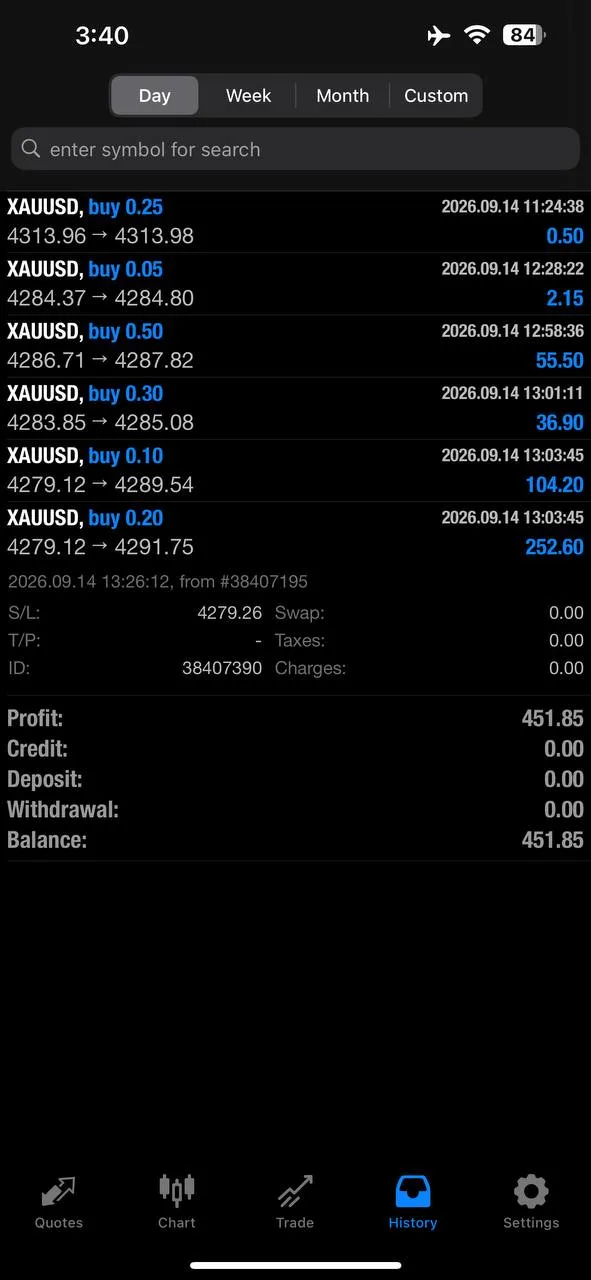
Eighteen member feedback messages followed the main sequence. The three selected screenshots below are the clearest public examples with readable context:
- Nick wrote that he was happy with his profits; the accompanying history screen shows a $451.85 profit and balance figure.
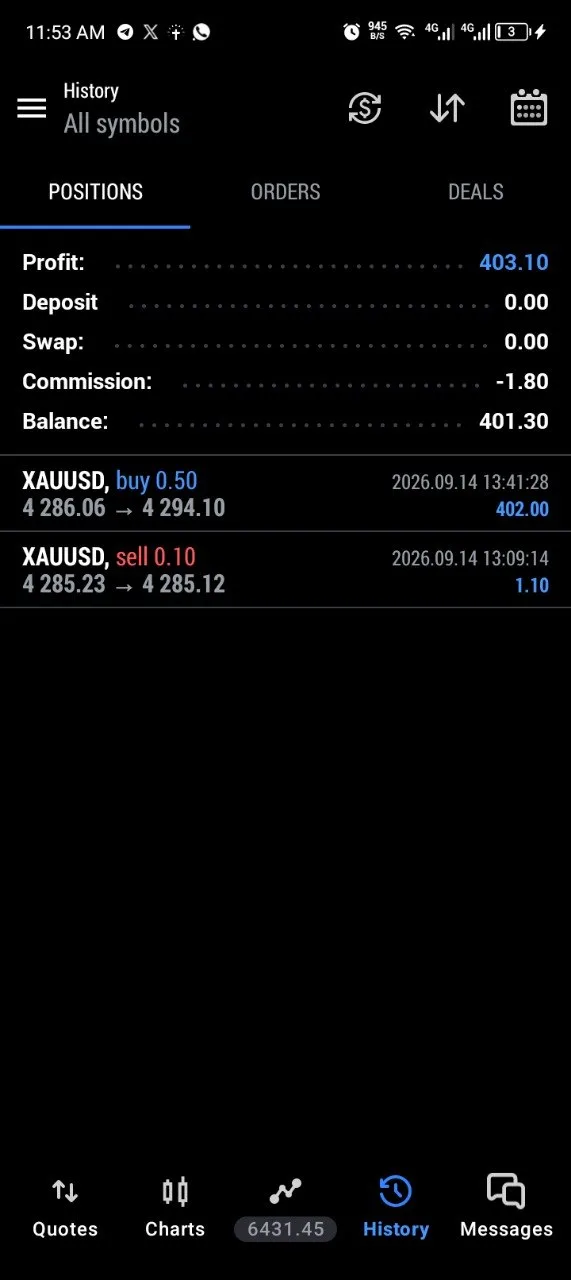
- Big Chief reported “402 bucks from you today”; the accompanying screen records $403.10 profit and a $401.30 balance after commission.
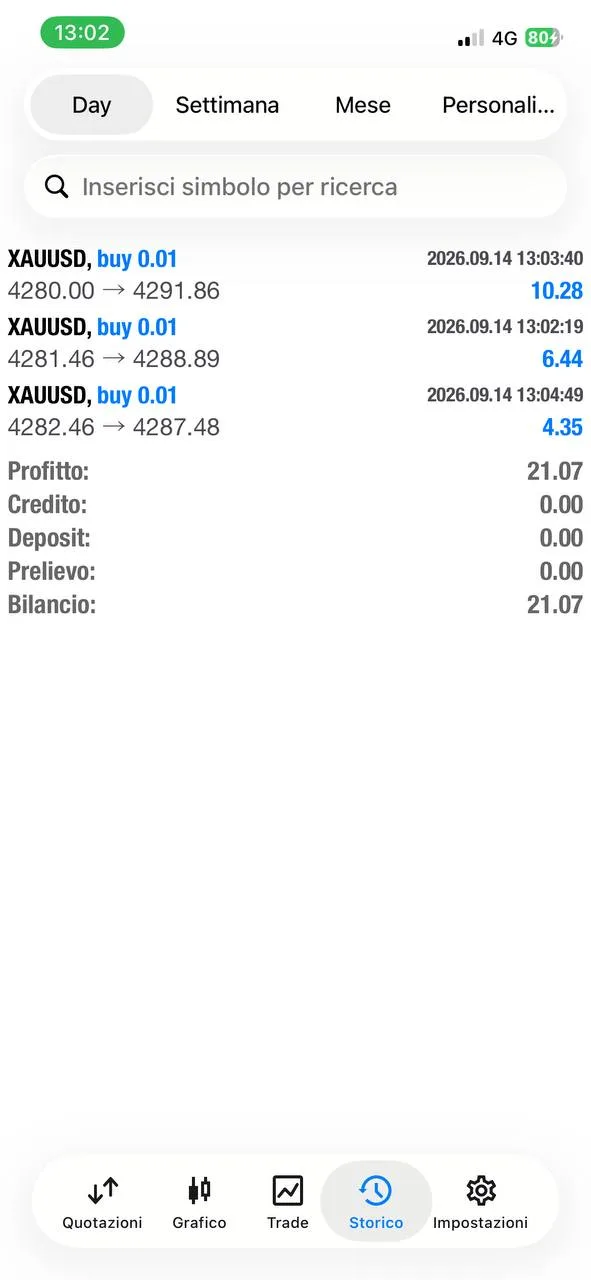
- Katarzyna Pirogowicz described it as her first day after a long break; the accompanying screen records €21.07 profit.
These are individual accounts and individual messages. They add context to the public response without turning community screenshots into a promise, endorsement, or average return.
Execution Lessons#
First, a risk cap is useful only when it can move with new information. The adjustment from 4,276 to 4,275 was visible before the recovery had fully developed. That made the later break-even decision easier to understand than a recap that only shows the final chart.
Second, partial profit-taking can lower emotional pressure. The public record did not need to guess one perfect exit. It marked 4,289, 4,291, 4,293, and 4,295, then kept a runner open. That structure allows a trader to protect a portion while leaving room for continuation.
Third, a strong historical recap separates what the channel said from what a screenshot can prove. The $25,000 headline, the 100-plus-pip language, and the account-specific $25,833.43 screen are related but not interchangeable. Keeping those boundaries is part of professional reporting.
Finally, volatility can turn a good idea into a bad chase. The macro backdrop was bearish and the session range was wide. A reader who copies a historical level without waiting for fresh confirmation is not following the same process. For another example of why the reset matters, see Daily Gold Trading Report — September 9, 2026: Intraday Reset.
What The Day Means Going Forward#
September 14 matters because the public record stayed useful even while the market tone was uncomfortable. One buy setup was enough to show the full operating loop: a zone, a risk cap, a rebound, staged checkpoints, and protection before the late recap.
The next session should not be treated as a repeat instruction. Watch how price behaves around 4,266.66 and 4,355.26, then demand fresh confirmation. If the lower reference fails, 4,221.00 becomes the next area to monitor. If the upper reference is reclaimed, 4,400.00 is the next visible test. Those are conditional observations, not promises.
Readers comparing the archive can also open Daily Gold Report — September 8, 2026: $20K Two-Way Session. The comparison makes the point: different sessions need different risk conversations. What stays consistent is a public record, clear levels, and honest boundaries around results.
FAQ#
Why does this daily gold report focus on trade management?#
Because the most useful evidence from September 14 was not just the direction. It was the sequence of moving the risk cap, taking partial profits, protecting the best positions at break-even, and continuing to label the checkpoints as the market moved.
Was 4,286.36 the official daily close?#
No. It was an XAUUSD intraday snapshot captured at 21:03 GMT+7 while the global spot session was still open. A daily close was not available in the same captured market packet, so this report labels the number correctly.
Does the $25,000 claim represent every follower’s result?#
No. The $25,000 figure was the strongest same-day public headline. A separate account history screenshot showed $25,833.43 for that visible account. Position size, fills, costs, and risk differ by account, so neither figure should be read as a universal return.
Where can readers follow the next update?#
Readers can message @GTMOBest for free gold-signal updates and follow the public @GTMO record.
Connect with Gold Trader Mo#
Follow Gold Trader Mo for the daily archive, then message @GTMOBest for free gold-signal access. The public channel is the place to see the next setup in its own market context rather than copying a historical number after the move is over.
The clearest reasons to follow are simple:
- Public updates show the zone, the risk conversation, and the checkpoints.
- Historical reports separate channel claims from account-specific screenshots.
- The free lane gives readers a direct way to ask questions before risking capital.
This article is for education and commentary only. Trading involves risk, capital can be lost, and past performance does not guarantee future results.