Market Snapshot#
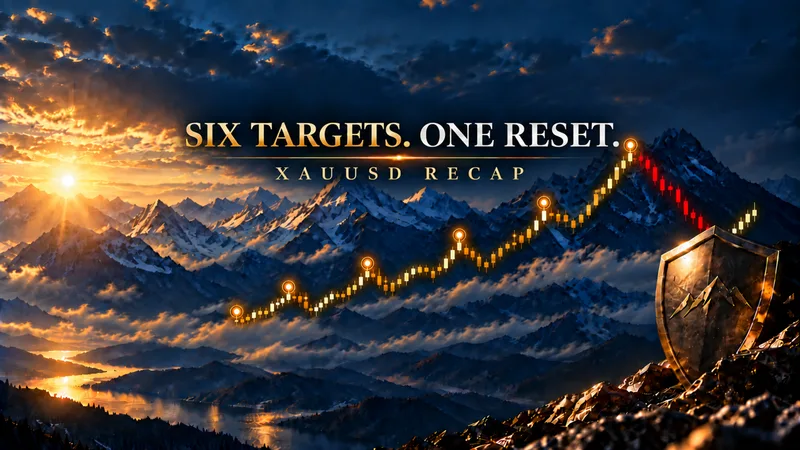
September 10 was not a straight-line gold story. The public @GTMO record first showed two BUY sequences moving through six target milestones with protection moved toward zero risk. A later BUY then met a sharp volatility event, was cut, and was followed by a candid decision not to force another trade. That complete sequence is the useful result. Readers who want free signals and FREE VIP channel access can message @GTMOBest.
| Metric | Value |
|---|---|
| XAUUSD current spot | 4383.46 (intraday snapshot) |
| DXY | 98.443 (intraday snapshot) |
| XAUUSD close | Not available at capture |
| XAUUSD session range | Not published at capture |
The dashboard is deliberately labelled as a live-day snapshot rather than a final close. The latest observed spot was 4383.46 at 18:15 GMT+7, while other same-day feeds showed materially different regional observations. No official close or synthetic range is stated here. DXY 98.443 is an intraday context snapshot, not a settlement figure.
The broader backdrop was still sensitive to upcoming US inflation data, a softer-dollar tone, and safe-haven demand. Those cues help explain why the tape could reward an early rebound and then punish a later attempt. They are not a substitute for the public trade record.
Why The Tone Changed So Fast#
The first tone change happened before the first entry. Mo described a 15-minute chart as an ugly sideways range, marked the top and bottom, and waited to see how price reacted around the lower blue support zone after London touched the Asia-session low. That was a conditional read, not a chase.
At 10:01 UTC, the first public BUY was called from 4392.7-4388 with a planned stop at 4385 and target steps at 4395, 4397, 4399, and 4401. The record then moved quickly: target one, target two, a risk-reset instruction, and target three were posted within minutes. A second BUY from 4393-4388 repeated the same structure and again produced staged confirmations.
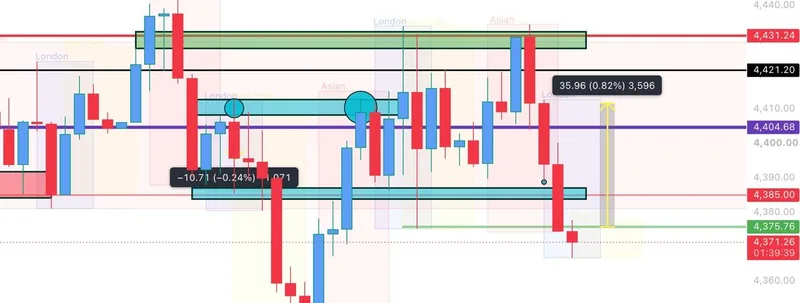
The tone changed again when the later BUY from 4381-4377 met a large wick during the US session. The risk cap was adjusted from 4372 to 4370 and then 4368, but the setup was ultimately closed. At 12:32 UTC, after that stop, a same-day @GTMO message attributed the subsequent waterfall to a PPI print of 5.4% above expectations and a rising dollar. This recap presents that as the channel's contemporaneous explanation, not as an independently settled macro benchmark.
For a nearby comparison, Daily Gold Trading Report — September 9, 2026: Intraday Reset also shows why a gold recap can be more useful when it documents the reset instead of hiding the difficult middle.
Technical Outlook#
The session map marked 4448.00 as a reference resistance and 4345.00 and 4340.00 as reference supports. They are historical context levels for this report, not live entry instructions. With the latest spot snapshot at 4383.46, the distance between those areas is wide enough to explain why a clean-looking rebound could still reverse violently.
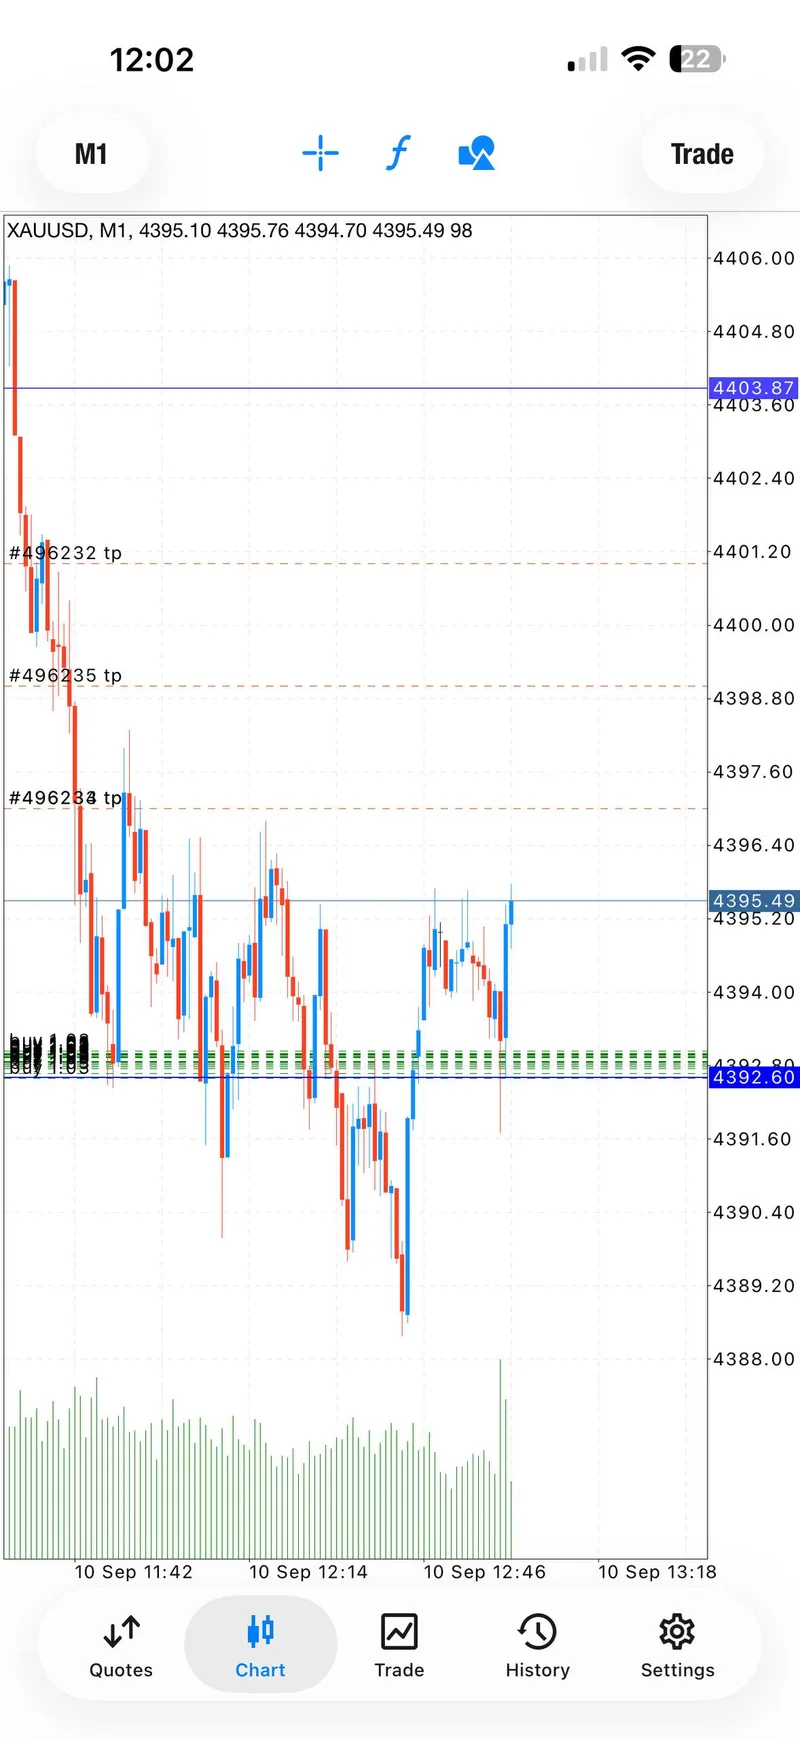
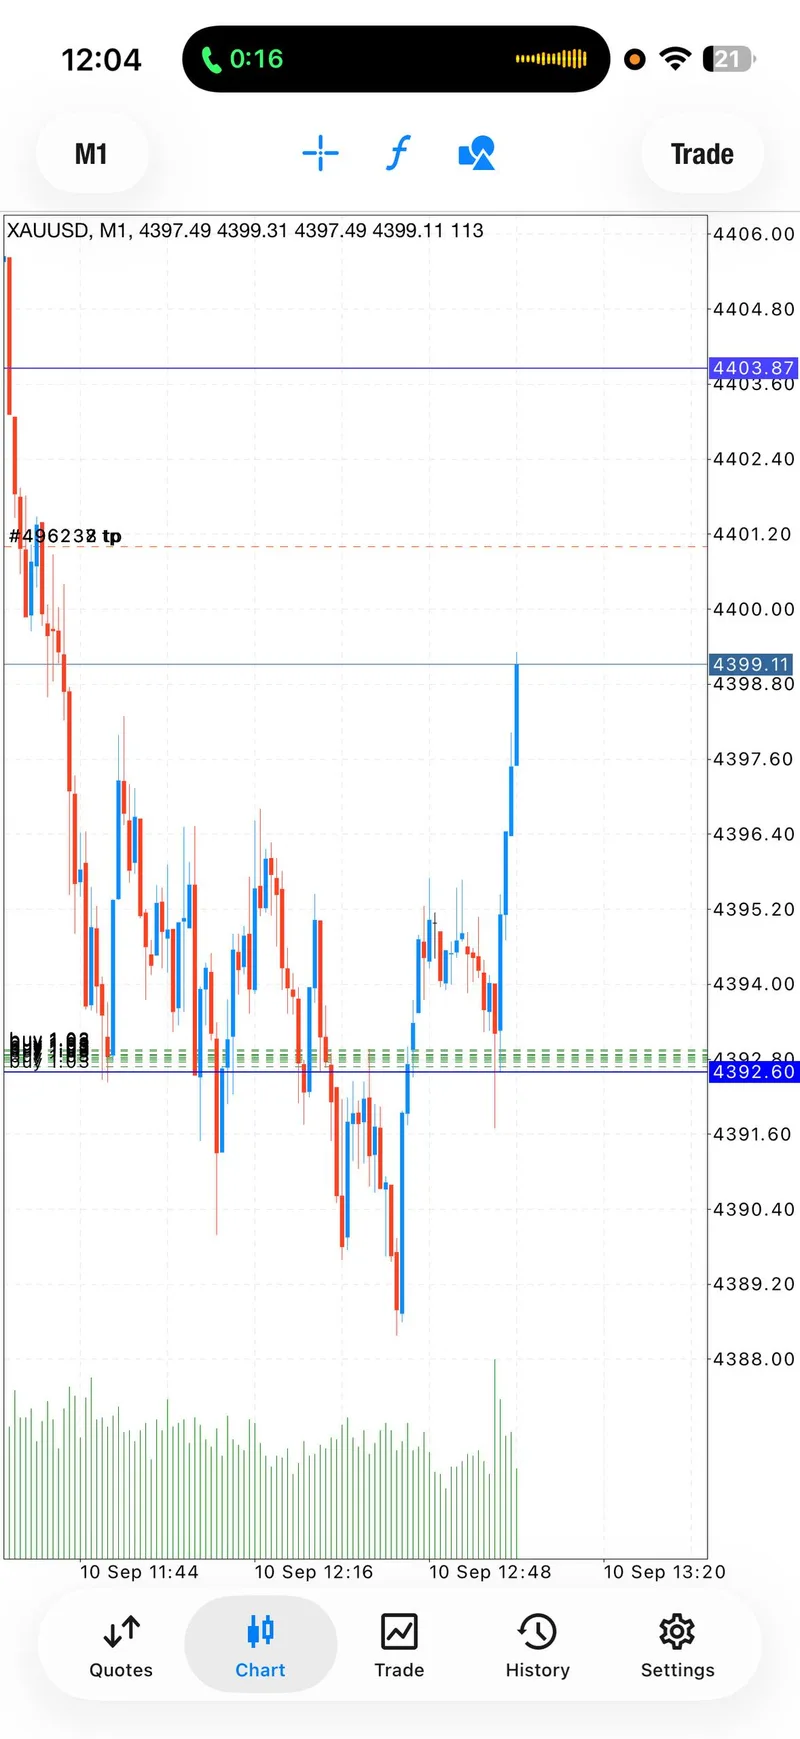
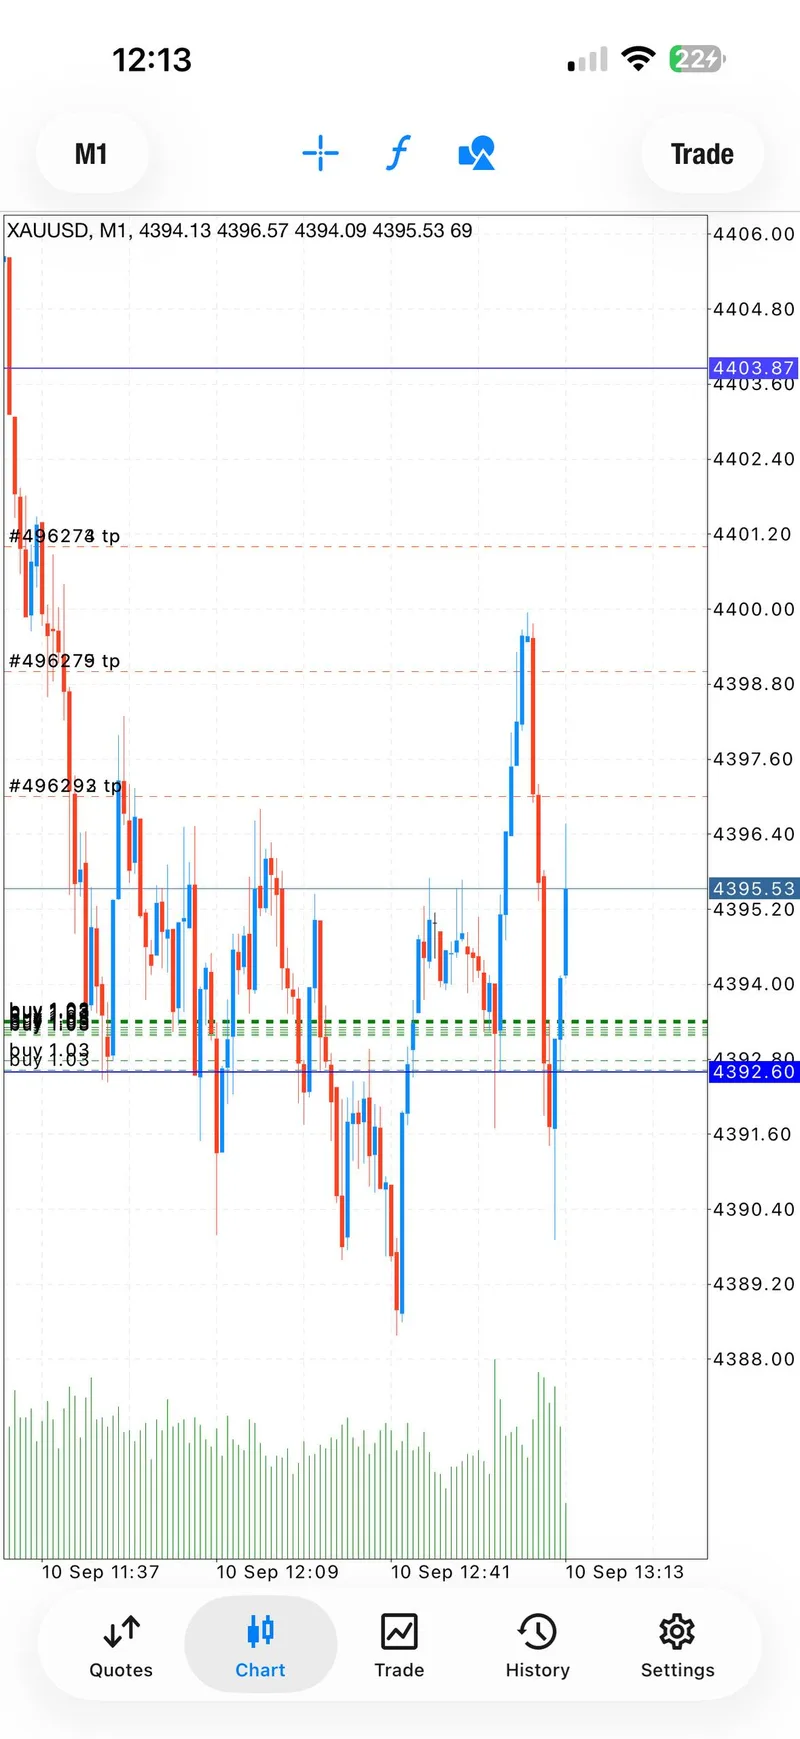
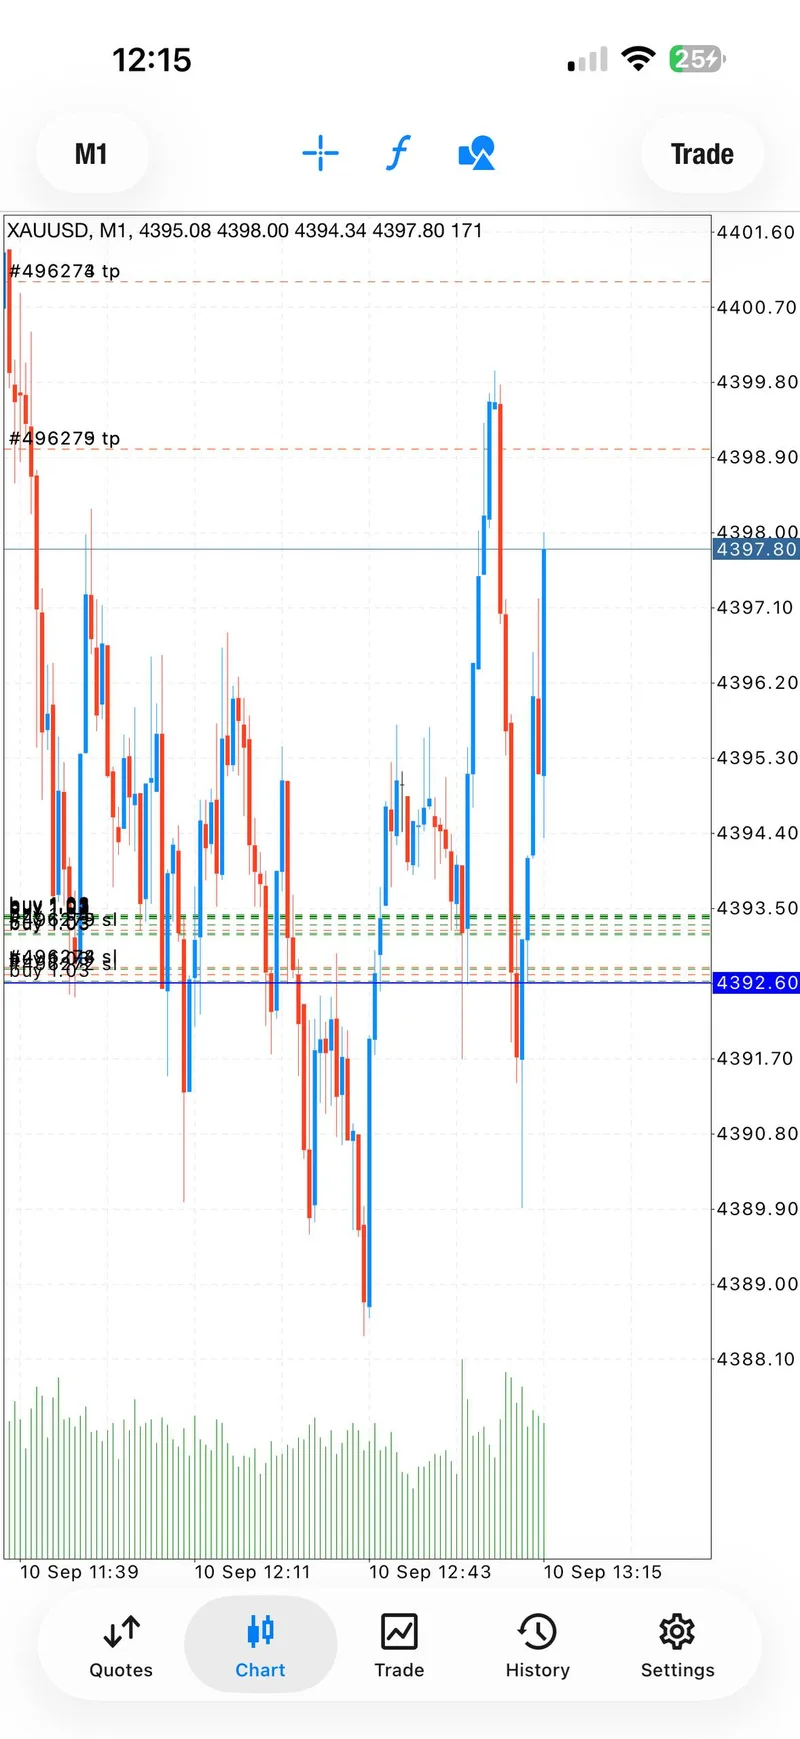
The early public zones were narrower and more actionable inside the channel: 4392.7-4388 and 4393-4388 for the first two BUY sequences, followed later by 4381-4377. The screenshots show those zones and target ladders as they appeared at the time. They should be read as past-session evidence, not a signal for the next candle.
Daily Gold Report — September 8, 2026: $20K Two-Way Session is a useful contrast because that recap followed a BUY recovery and a fast SELL run. September 10 was different: the key lesson was protecting early progress when the tape stopped behaving cleanly.
Trading Signals#
First BUY: the protected rebound#
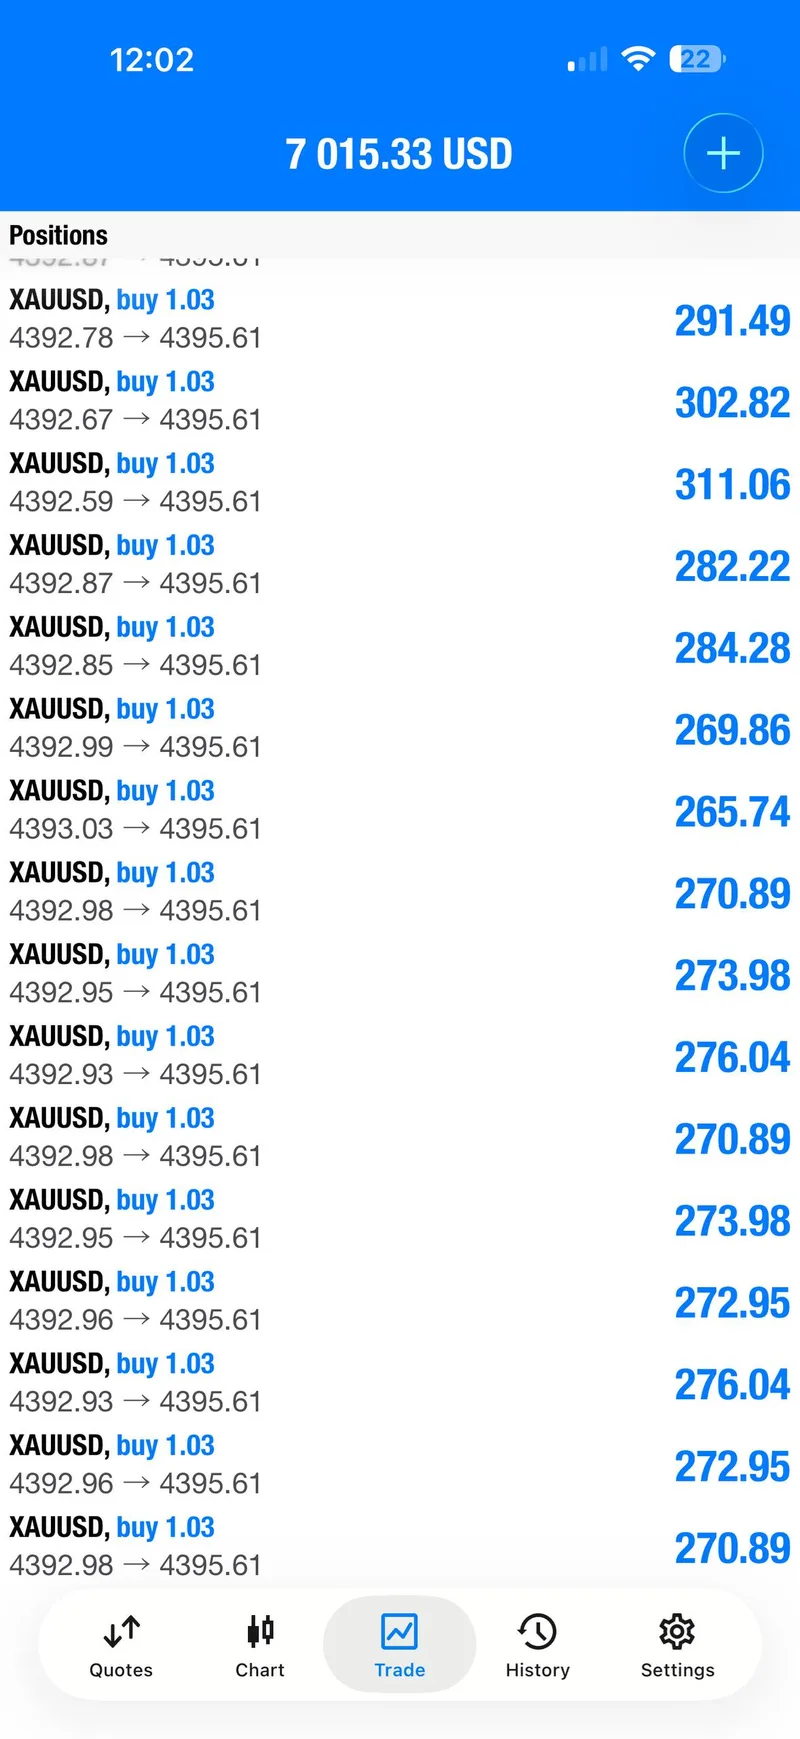
The first parameterized BUY was shared at 4392.7-4388 with a planned stop at 4385 and four fixed target levels ending at 4401. The public record showed target-one confirmation at 10:02:54 UTC, target two at 10:03:28, a risk-reset instruction immediately afterward, and target three at 10:04:59. A later message described three target milestones in three minutes.
The important detail is not speed alone. The sequence paired the move with protection guidance. When the price returned to the risk-reset level, the channel reported that the position was protected rather than pretending every remaining target had to be reached.
Second BUY: the six-target sequence#
A second BUY was called from 4393-4388 with the same 4385 planned stop and target ladder through 4401. It moved into profit almost immediately, reached another target, and again had its risk reduced before the next push. The public messages later described the two early trades together as two winners with six target milestones.
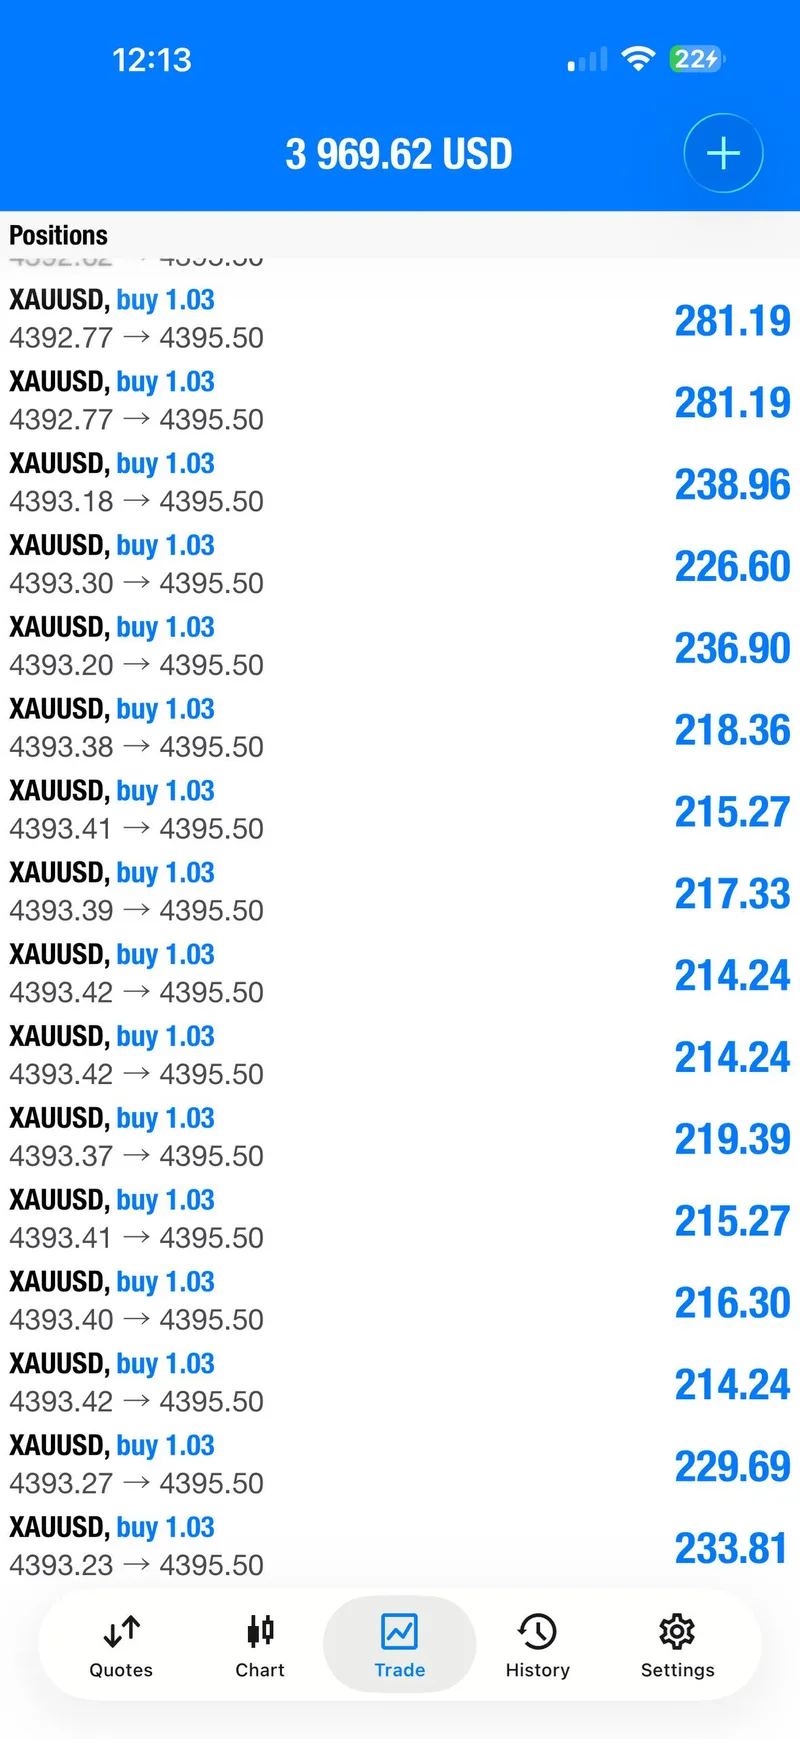
The public channel presented that combined result, while seven selected trading screenshots let readers inspect chart and account-level surfaces without confusing a selected image count with the full message count.
Later BUY: when discipline meant cutting#
The later BUY from 4381-4377 had a planned stop at 4372 and targets at 4383, 4385, 4387, and 4389. As US-session volume increased, the risk cap was moved first to 4370 and then 4368. Mo then called out the large wick, warned that the setup might either accelerate or hit the stop, and closed the trade before the channel later linked the waterfall to PPI.
The follow-up is what makes this a useful historical recap. He acknowledged the loss, explained that more global activity can make a price-action setup less reliable, and said he would take the day as it was rather than force another attempt before the PPI release. That is a visible decision, not hindsight.
Signal Performance Breakdown#
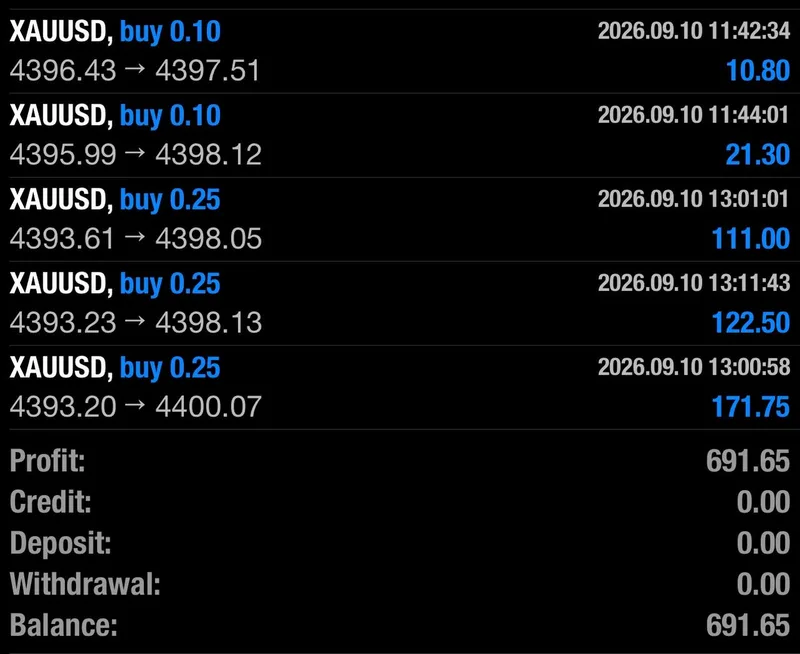
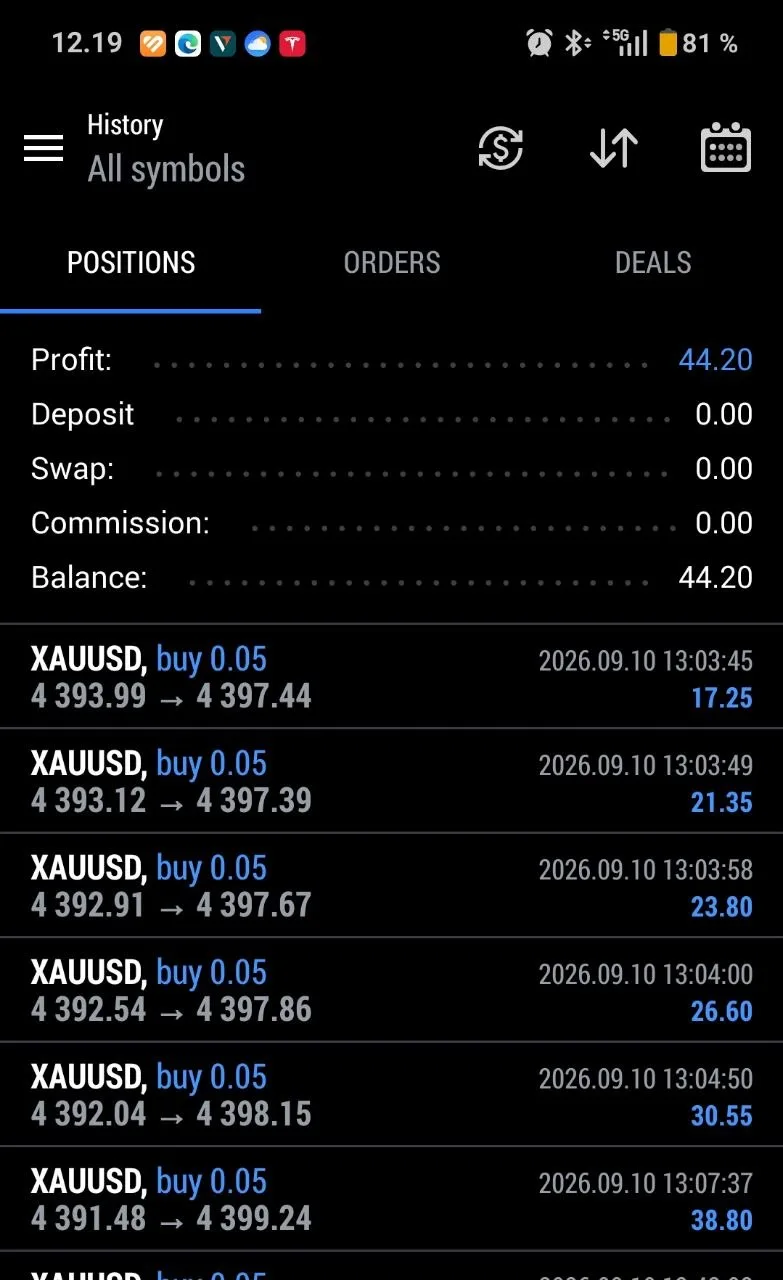
The strongest same-day result line came after the first two sequences: the public channel reported 2 trades, 2 winners, 6 target milestones, and $14,000+ closed with zero floating exposure. That figure is presented as reported because individual account sizes differ. The selected screenshots include account-level displays, but they are not promises about what every reader earned.
The full archive contains 17 member messages. Twelve were trade reactions or result posts, and members also shared two public proof screenshots for the community gallery. Member reactions included short comments celebrating the quick target run and several account-level amounts in different currencies; no sender identity is inferred from those messages.
Daily Gold Trading Report - September 7, 2026: $11K Closed provides another reference point for separating a channel-reported result from the individual proof surfaces that accompany it.
The performance story therefore has two halves. First, staged targets and risk resets created a protected early result. Second, the later loss stayed visible and changed the operating decision. A recap that includes both is more useful than a headline that only repeats the best screenshot.
Execution Lessons#
First, a planned stop is the boundary that keeps a volatile idea from becoming an uncontrolled position. On the later BUY, the stop was widened from 4372 to 4370 and then 4368, which increased the allowed downside. The trust-positive action was making that change visible and cutting the setup once the wick broke the read.
Second, taking targets in layers changes the decision pressure. The first two sequences did not need a perfect final print to document useful progress. Once the risk was reduced, a return to the entry area could be handled without turning a winning move into a new emergency.
Third, a public recap should include the point where the plan stopped working. Mo did not turn the PPI-area loss into a new promise. He called the trade, described the wick, accepted the result, and stopped looking for another forced entry. That is the risk lesson worth carrying into the next session.
This report is historical education, not a live instruction. Anyone studying the zones should wait for fresh structure and confirmation rather than copying an old price.
What The Day Means Going Forward#
Going forward, September 10 belongs in the recovery-and-reset category. The reference map is clear enough to watch: 4448.00 remains the marked resistance, while 4345.00 and 4340.00 are the marked support areas. The next session still has to prove whether price can hold a zone; no old BUY level should be treated as current.
The more durable takeaway is behavioural. When the public record shows early progress, risk reduction, a later stop, and a decision to pause around high-impact data, readers can see how a desk responds when conditions change. That is a stronger trust signal than pretending every day is a clean sweep.
For another recovery comparison, Daily Gold Trading Report — September 4, 2026: $10K Recovery Day shows a different mix of protection and follow-through. The point of the archive is not that every session repeats; it is that the decisions stay visible.
FAQ#
Was September 10 a pure winning session?#
No. The public record reported two early winning BUY sequences and six target milestones, then showed a later BUY being closed after a large wick. Both the winning sequence and the losing stop remain visible, so the day is not presented as risk-free.
What does the $14,000+ figure mean?#
It is a channel-reported same-day account result attached to the two early trades. It is not a guaranteed outcome, a verified return for every member, or a substitute for reviewing the entry, target, and protection messages.
Can I use the old zones for a new trade?#
No. The zones and targets in this article are past-session evidence. A new decision requires new price action, new risk limits, and confirmation that the market is responding to the structure again.
Where can I follow the next public update?#
Message @GTMOBest for free gold signals and FREE VIP channel access, or follow the public @GTMO channel for the next historical and intraday updates when they are shared.
Connect with Gold Trader Mo#
Readers who want a clearer way to follow the next gold session can start with Gold Trader Mo and the free public lane, then message @GTMOBest for free gold signals and FREE VIP channel access. Gold Trader Mo keeps the useful parts visible: zones, target progress, protection changes, and the moments when a setup is closed instead of forced.
What the free lane gives readers:
- Free daily gold-signal updates with readable context around levels and timing.
- Historical recaps that show both target progress and the risk decisions around it.
- A direct path to ask about FREE VIP channel access without relying on vague promises.
This daily report is for education and commentary only, not financial advice. Trading involves risk, capital can be lost, individual results vary, and past performance never guarantees the next session.