
Market Snapshot#
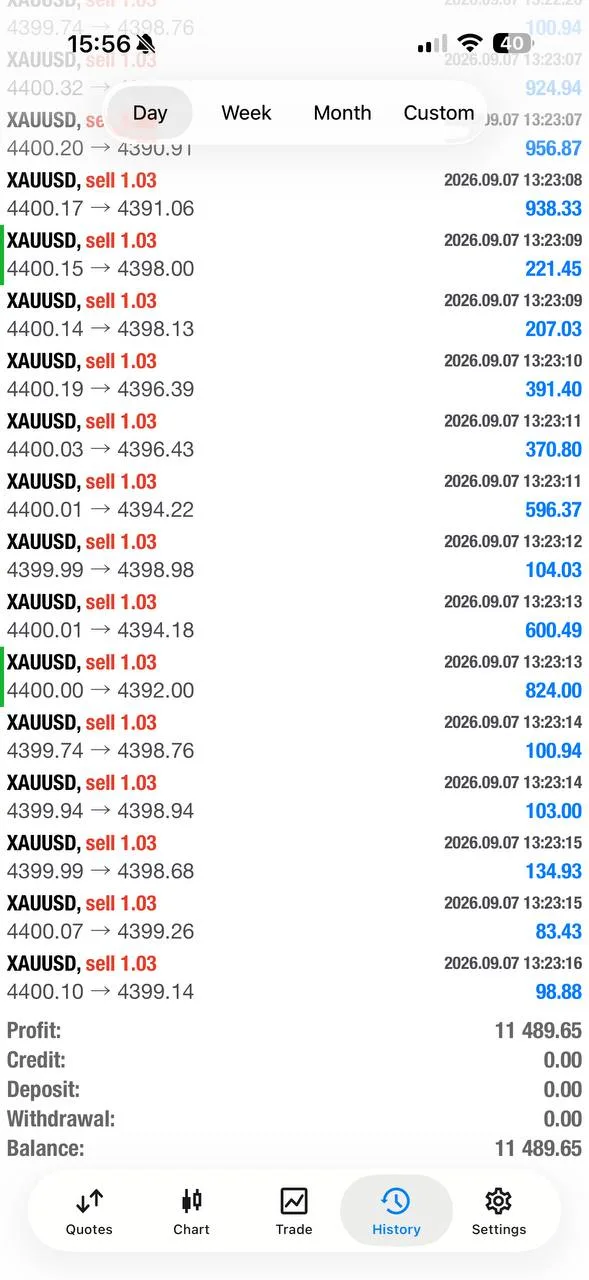
Monday, September 7, 2026 was a short, unusually disciplined gold session. The public @GTMO record showed one clearly parameterized sell idea moving from the 4400-4404 zone into a rapid sequence of target updates, then an early close as US holiday liquidity thinned. A separate account-history screenshot displayed $11,489.65 for that account; the day summary itself reported $11,000+ closed. Those are individual or channel-reported results, not a promise that every reader earned the same amount.
The market backdrop was quieter than a normal US session. The point-in-time XAUUSD snapshot used for this recap was 4406.14, observed at 10:41 ICT, and it must be read as an intraday reference rather than a final daily close. The working technical map placed nearby resistance around 4436-4451 and 4482-4514, with support near 4378 and 4366-4367. Because the US cash session was closed for a holiday, the cross-asset figures were treated as context snapshots rather than definitive closes.
| Metric | Historical reference |
|---|---|
| XAUUSD | 4406.14 intraday snapshot at 10:41 ICT |
| Immediate resistance | 4436-4451 |
| Wider resistance | 4482-4514 |
| First support | 4378 |
| Deeper nearby support | 4366-4367 |
| Session condition | Thin holiday liquidity; no verified daily close claimed |
The useful takeaway is not a manufactured closing number. It is the contrast between a fast public trade sequence and a deliberate decision to stop adding risk once the normal US volume window was unavailable. Readers who want the next free signals and FREE VIP channel access can message @GTMOBest early, before the next public recap is written.
Why The Tone Changed So Fast#
The tone changed because the public sequence moved quickly from confirmation to protection. The opening message did not need a long narrative: the parameterized call defined the 4400-4404 sell zone, a 4408 stop, and a ladder of downside targets. Once the first target was reported, updates arrived in short intervals. That made the day feel fast, but the risk process inside the move was not rushed.
The holiday calendar mattered as much as the direction. When the channel later noted that US banks were closed and volume would keep thinning, Mo did not turn a completed move into a reason to keep forcing new exposure. The final public update said the last entries had been closed and reported $11,000+ closed for the account shown in the day summary. That is a management decision readers can understand even if they never trade the same instrument.
A useful comparison is the September 4 recovery report, where the lesson was recovery after pressure. September 7 was different: the cleaner story was controlled continuation, staged profit-taking, and an early finish.
Technical Outlook#
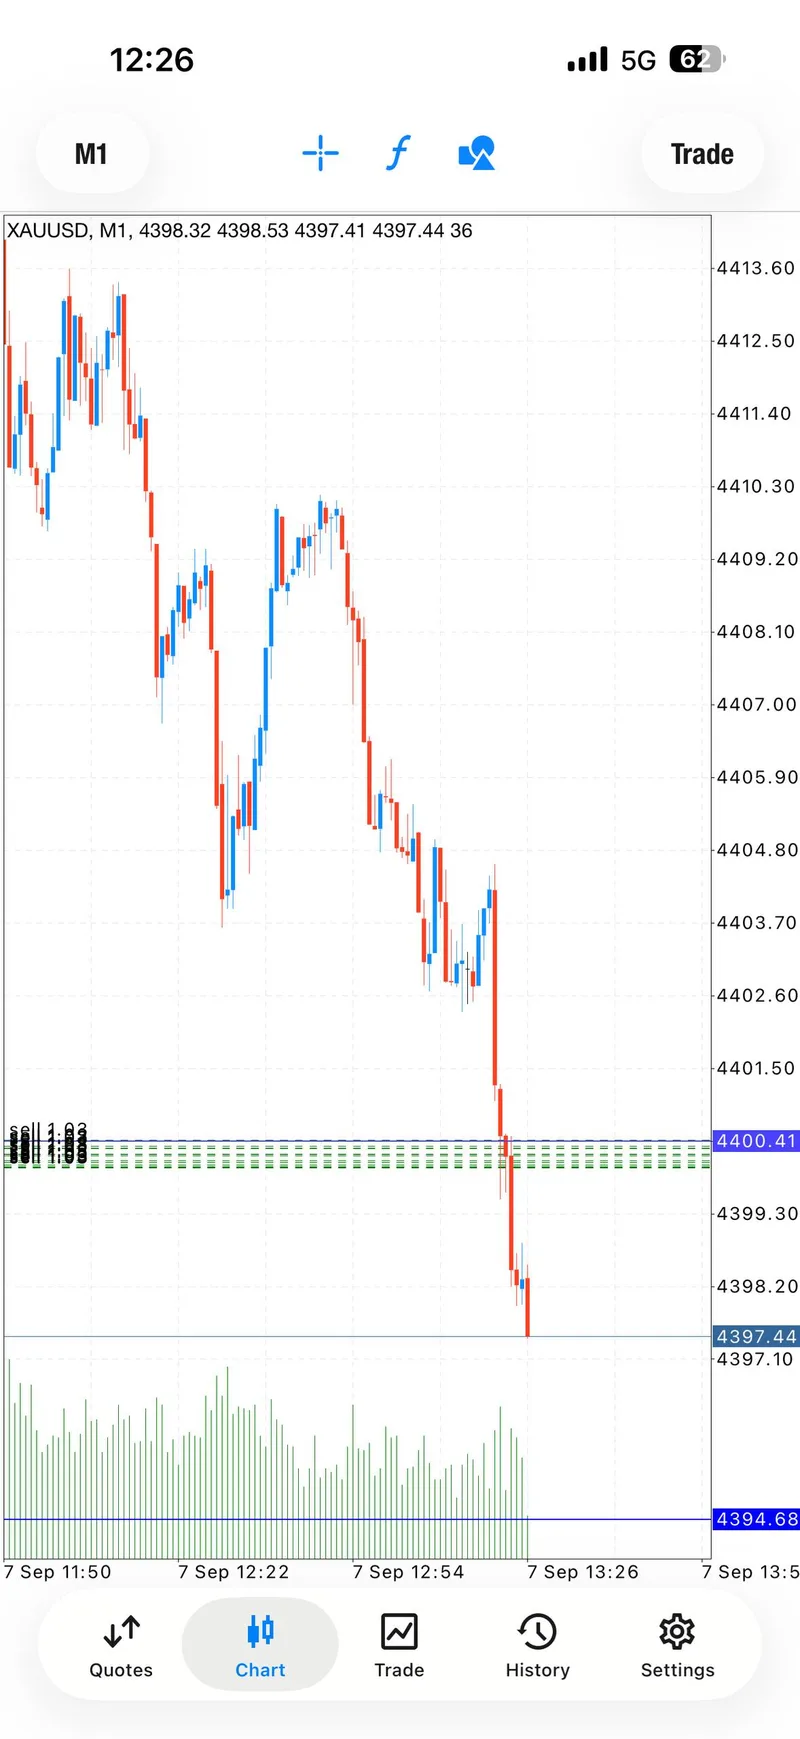
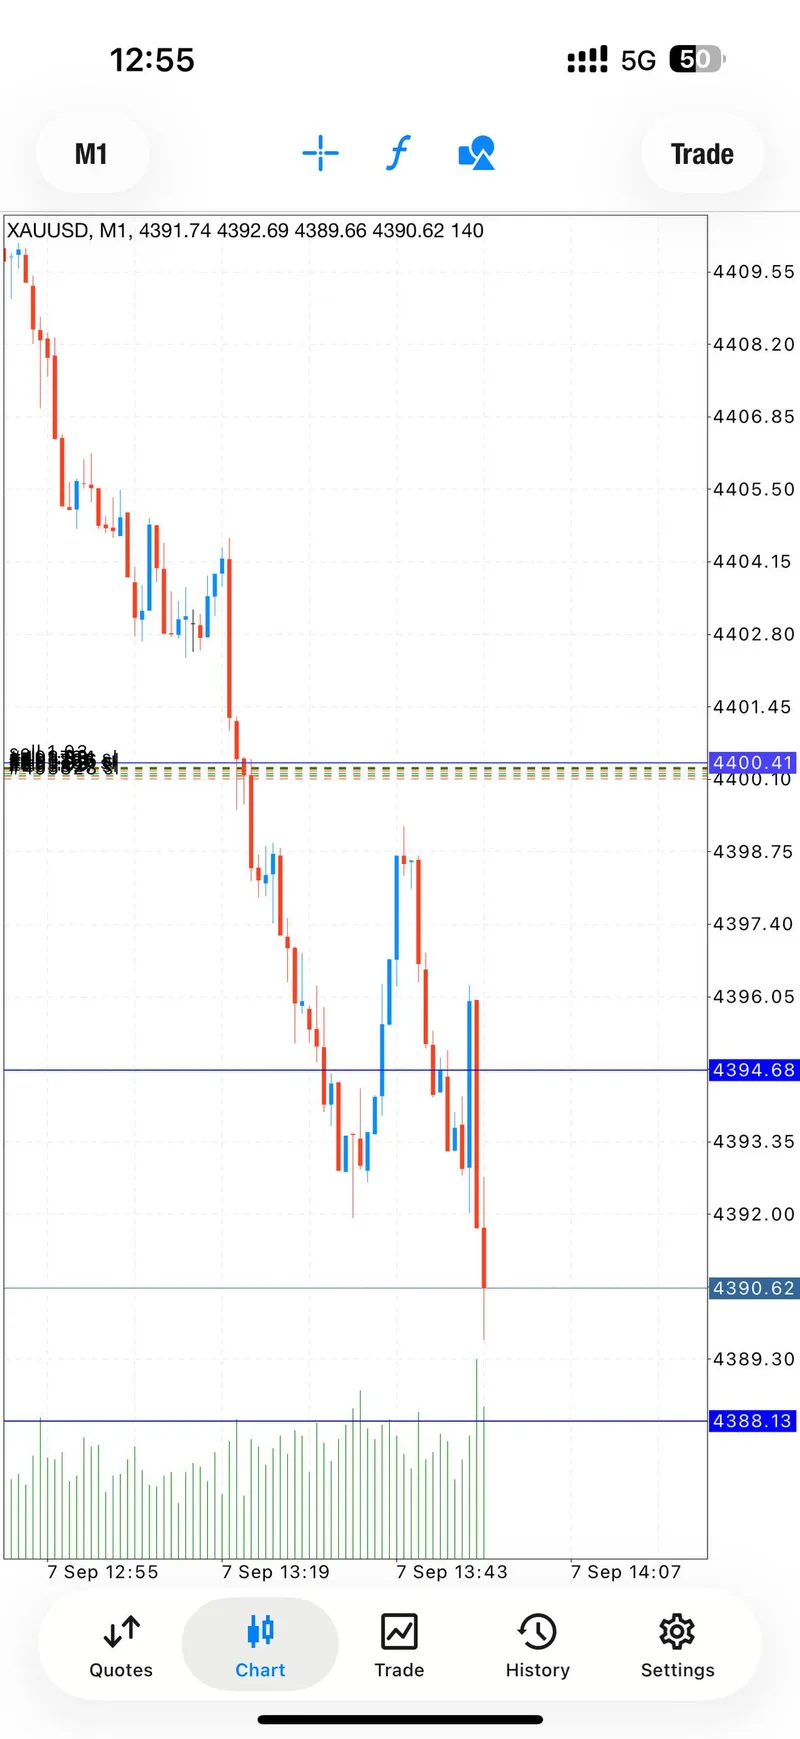
The historical chart evidence shows why the 4400 area mattered. The selected chart screenshots show price pressing through the zone and later printing around 4390.62 after the target sequence was reported. That is consistent with the public record's four fixed milestones, but it does not turn a past move into a live instruction.
The wider map remains conditional. A return above the 4436-4451 resistance band would challenge the short-term bearish structure described in the market snapshot. A failure to hold the 4378 area would put the 4366-4367 floor back in focus. These are observation levels for a future recap, not orders or recommendations. Thin holiday trading can produce a clean-looking move with less institutional participation than a normal session.
For readers who want a second reference point, the September 2 report documented two failed sell attempts before a later recovery sequence. That contrast is useful: the same market can reward continuation on one day and punish premature confidence on another.
Trading Signals#
One Canonical Sell Sequence#
The clearly parameterized setup was a historical SELL from 4400-4404, with a reported stop at 4408 and fixed targets at 4398, 4396, 4394, and 4392. The earlier “Gold sell now” line was an unparameterized preamble, so it is not counted as a second setup.
The public follow-through arrived in stages:
- TP1 was reported almost immediately, with the chart already breaking below the 4400 area.
- TP2 was then checked, followed by a direct instruction to move protection to breakeven.
- TP3 was reported next, and a later public update listed TP1, TP2, and TP3 as complete.
- The record then reported all four fixed targets hit and described the move as 100+ pips.
- A later update said two more entries were being closed at 150+ pips before the holiday close.
The optional open target was deliberately not converted into a fifth completed target. The defensible claim is four fixed target milestones, with the later 150+ pip wording kept as a reported channel result rather than a universal outcome.
The chart and account screenshots in the gallery are supporting evidence for this sequence. They show the move and individual executions, while the written @GTMO record supplies the timing and risk-reset context.
Signal Performance Breakdown#
This was a strong historical session, but the evidence is more useful when separated into layers.
First, the public signal record documented one parameterized sell sequence and four fixed target milestones. Second, the day summary reported $11,000+ closed, while one visible account-history screenshot displayed $11,489.65 profit. Third, the member response contained 10 feedback messages, from short thank-yous to individual screenshots. These layers should not be merged into a claim that every follower earned the same number.
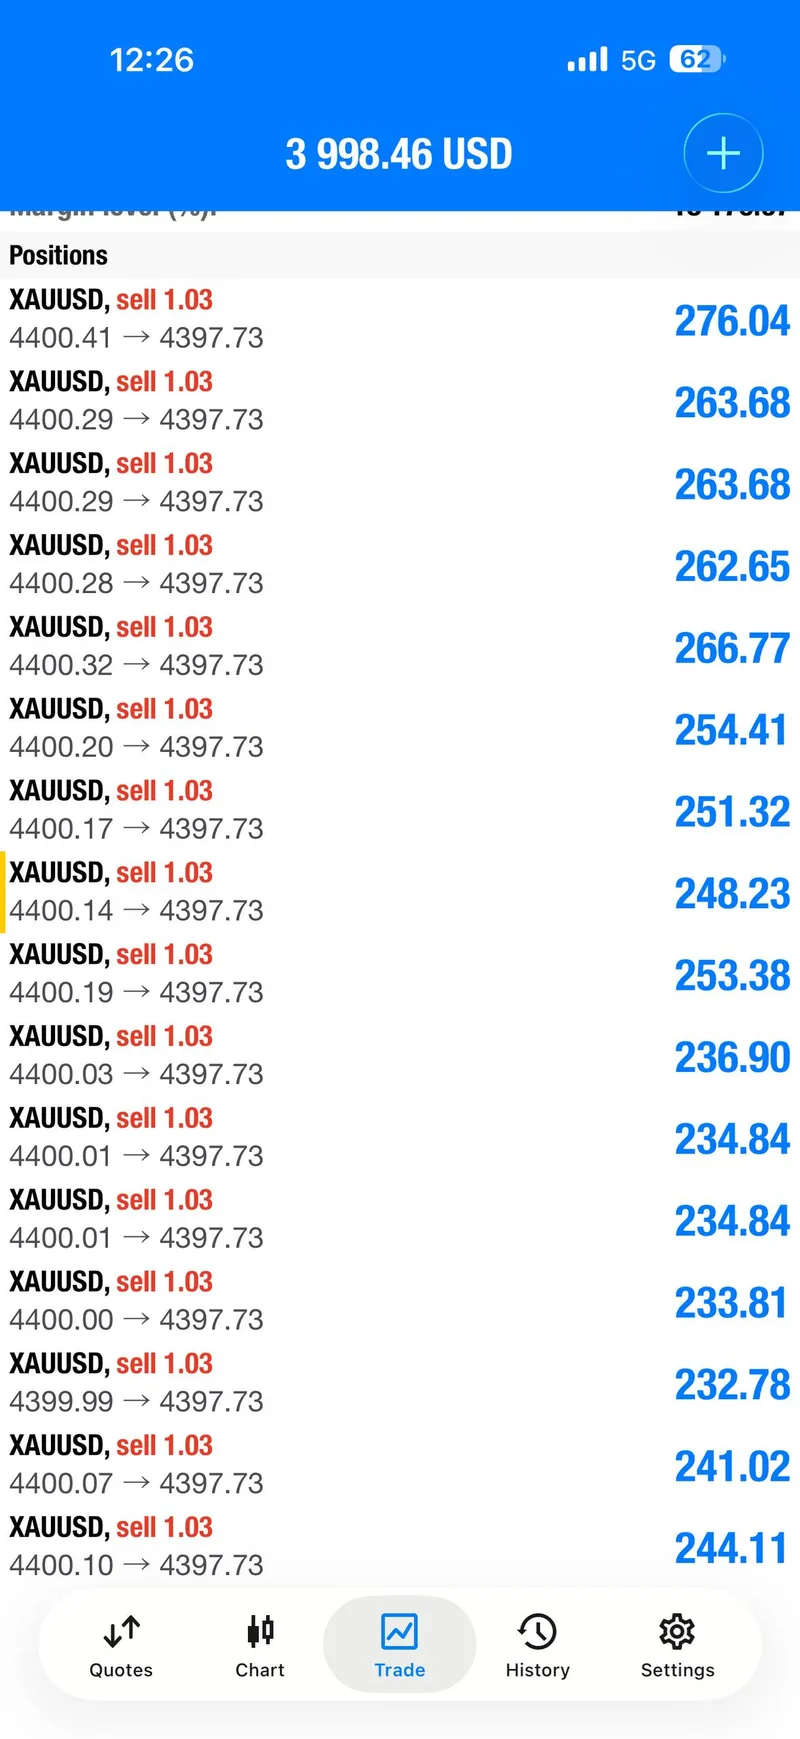
The selected trading proof gallery contains four screenshots. One is the day-summary history view, one captures the chart breaking through the entry area, one shows the later extension toward 4390.62, and one shows a separate account-history view with multiple sells around 4400. The community gallery contains three additional screenshots selected from the member response. Together they make the session inspectable without pretending that a screenshot is a broker-wide statement.
The member feedback was specific enough to add human context:
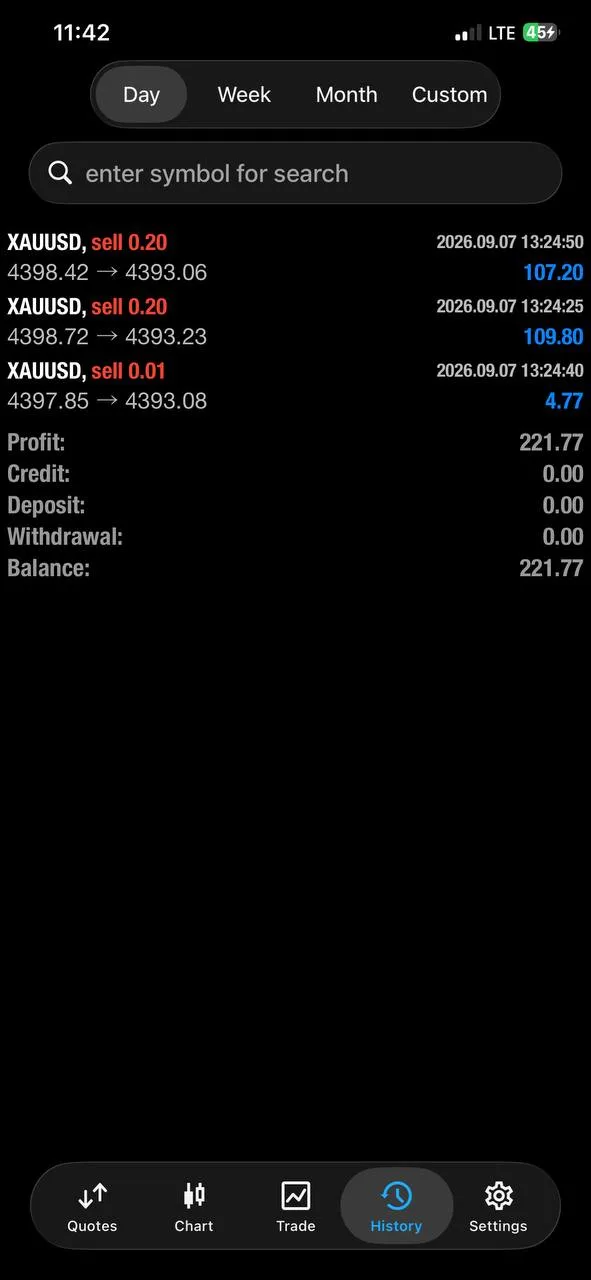
- VadrionYT shared a public screenshot showing $221.77 profit after the sell session.
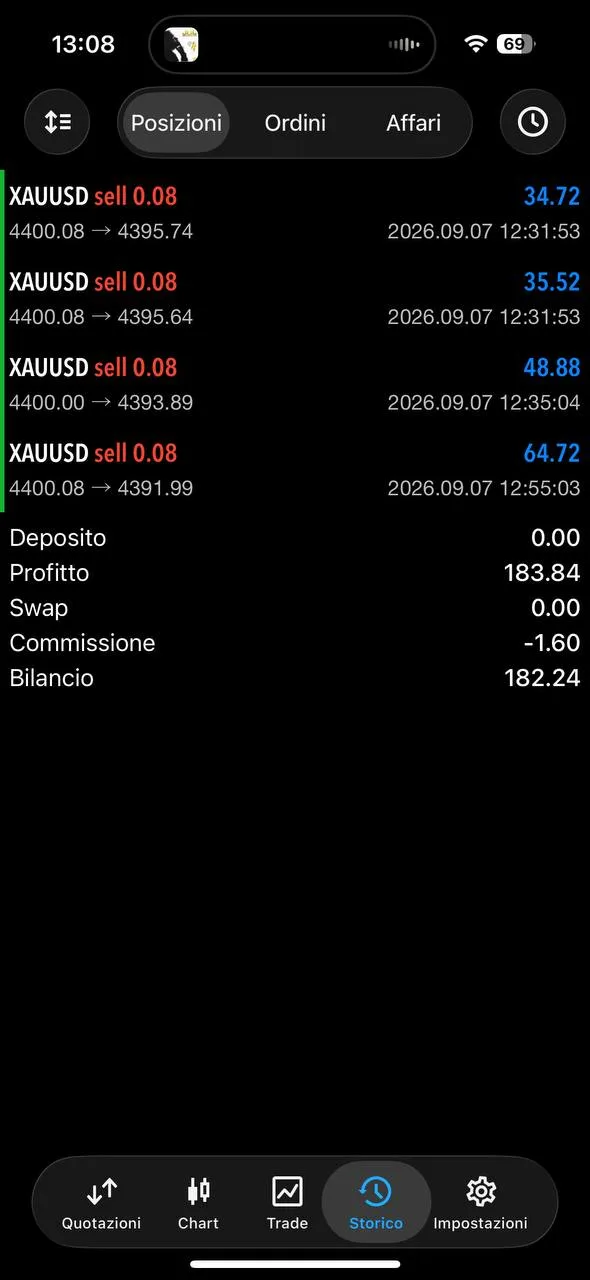
- Ludovico Bandecchi shared a screenshot showing $183.84 profit and a $182.24 balance after commission.
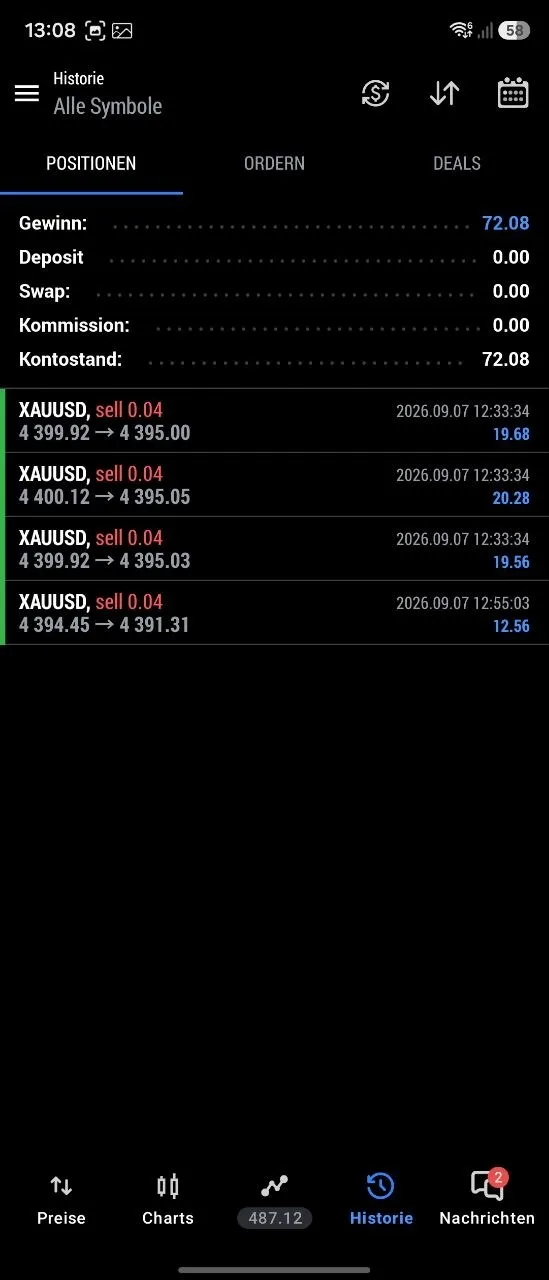
- Another member screenshot showed $72.08 across four XAUUSD sells.
Those are individual records. They demonstrate that members were responding to the same public move, not that a fixed return was guaranteed. The full 10-message feedback count remains separate from the three selected member proof screenshots.
For broader context, the September 1 report also shows why setup count and target count should be reconciled from the actual message sequence instead of inferred from repeated announcements.
Execution Lessons#
The first lesson is to count canonical setups, not excited openers. The public record began with a short “sell now” message, but the next message supplied the actual zone and protection. Treating those as two trades would exaggerate the story. One well-defined sequence is stronger than a padded count.
The second lesson is to make protection visible. After TP2, the channel explicitly called for breakeven. That changed the risk profile of the remaining move and gave readers a concrete management action to evaluate in hindsight. The later TP3 and TP4 updates therefore read as a protected continuation, not as a claim that the market was risk-free from the beginning.
The third lesson is to stop when the session conditions change. The US bank holiday was not used as a reason to chase a second wave. Closing the last entries early kept the recap aligned with the available liquidity and avoided turning a completed public result into an unsupported live promise.
The fourth lesson is evidence discipline. A chart proves price movement. An account screenshot proves what one account displayed. A channel message proves what was reported publicly. None of those alone proves a universal return. Keeping those boundaries visible is part of what makes the recap trustworthy.
What The Day Means Going Forward#
September 7 is best remembered as a clean, bounded continuation day: one canonical sell zone, four fixed target milestones, a visible breakeven reset, and an early close once holiday conditions reduced the quality of new opportunities. The sequence was persuasive because the record showed both the direction and the management.
It also gives readers a practical way to judge future updates. Look for a defined zone before counting a setup. Look for protection after the first meaningful move. Look for a clear distinction between a reported account result and a result available to everyone. And look for the moment when the desk chooses to stop.
That is the standard the next recap should meet. The public @GTMO channel remains the place to watch the next historical record, while @GTMOBest is the direct path for free signals and FREE VIP channel access. No past result removes the risk of a future trade; the value is in seeing the process clearly enough to make an informed decision about whether to follow.
FAQ#
Was September 7 one trade or two?#
The evidence supports one canonical parameterized SELL setup: 4400-4404 with a reported 4408 stop and fixed targets through 4392. The earlier “sell now” line was an opener without parameters, so it is not counted separately.
Did the public record show all four targets?#
Yes. The same-day @GTMO record reported TP1, TP2, TP3, then all four fixed targets hit. It also reported 100+ pips and later 150+ pips while closing the remaining entries. These are historical channel statements, not a guarantee for every account.
What does the $11,000+ number represent?#
It is the figure in the day-summary message, supported by an account-history screenshot that displayed $11,489.65 on one account. It is not presented as a universal member result or a forecast.
Why was there no verified daily close?#
The market packet was captured during a US holiday session. The 4406.14 value is an intraday snapshot, so the recap keeps it separate from a final close rather than filling the gap with an estimate.
How can I follow the next update?#
Follow the public Gold Trader Mo record and message @GTMOBest for free signals and FREE VIP channel access.
Connect with Gold Trader Mo#
If you want a clearer way to follow gold sessions, start with the public Gold Trader Mo reports and the free @GTMO channel record. Each recap should show the setup, the management sequence, and the limits of the evidence.
Message @GTMOBest for free gold signals and FREE VIP channel access. The invitation is simple: read the public record, ask questions, and decide whether the process fits your own risk tolerance.
What readers can expect from the free lane:
- Day-specific gold updates explained in plain English.
- Historical signal recaps with zones, direction, target progression, and risk notes when the public record supports them.
- Clear separation between channel-reported outcomes, individual account screenshots, and broader market context.
- A direct route to ask about FREE VIP channel access without relying on anonymous claims.
This article is educational market commentary, not financial advice. Trading involves risk, capital can be lost, and past performance does not guarantee future results.