Market Snapshot#
September 1, 2026 was a bearish-pressure session with a surprisingly clear execution story. Gold was pushed lower by a firmer dollar, higher Treasury yields, hawkish rate expectations, and oil-related inflation anxiety. Yet the important historical detail is that this was not a clean, uninterrupted collapse: market commentary kept the 4,400 area and the 100-day average near 4,370 in view as structural support. That combination rewarded selective sell entries and punished late chasing.
If you want the next public update, message @GTMOBest. This recap is historical; the levels below explain what happened on September 1 rather than instructing anyone to enter now.
| Metric | September 1 evidence | Reading note |
|---|---|---|
| XAUUSD latest spot quote | 4,444.80 | Vietnam.vn afternoon quote at 15:00 GMT+7; not a unified session close |
| XAUUSD reported high / low | 4,457.77 / 4,372.44 | Cross-source observations; not a single-source daily range |
| DXY | 99.53 | Investing.com daily table entry for 01/09/2026 |
| US 10Y yield | 4.7710% | Trading Economics benchmark quote shown for the date |
| WTI crude | 87.6455 | Trading Economics current continuous-contract quote, not settlement |
| VIX spot | 15.57 | Cboe spot quote shown as of September 1, not a final close |
| Fed target range | 3.50%–3.75% | Federal Reserve range in force from July 30, 2026 |
The high and low are deliberately labelled as reported observations rather than a definitive XAUUSD range. USA Today recorded 4,372.44 at 08:05 Eastern Time, while Vietnam.vn later showed 4,444.80. Those points describe the day’s changing tape, but they were captured at different times and under different publication conventions. The more useful conclusion is directional: pressure was real, but support was still close enough to make patience part of the trade.
Why The Tone Changed So Fast#
The tone changed because several normally separate pressures pointed in the same direction. The market commentary linked gold’s weakness to renewed hawkishness around the Federal Reserve, with rate-hike expectations reported above 65%. A stronger dollar and a Treasury yield near 4.77% increased the opportunity cost of holding a non-yielding asset. WTI near 87.65 added an inflation-sensitive layer, while geopolitical risk around the Strait of Hormuz kept a competing safe-haven bid in the background.
That tug-of-war explains why a bearish view did not mean selling every candle. The early GTMO analysis described the higher-timeframe picture as bearish, then acknowledged that the lower timeframe still needed to show its hand. The desk waited for specific zones instead of turning a macro thesis into a blind market order. That sequence is more instructive than a simple “gold fell” headline.
The contrast with the August 31 daily gold report is useful. The prior session was built around BUY setups and protection after upside follow-through. September 1 required the opposite directional bias, but the same operating principle: wait for the zone, define the invalidation point, and reduce exposure as the market pays.
Technical Outlook#
The dated technical map placed resistance at 4,456 and 4,475, with support around 4,396–4,400 and then 4,370. The same commentary referenced a 20-day average near 4,430 and a 100-day average near 4,370. In other words, the tape offered room for downside continuation, but it also offered obvious places where a seller could be late or where a bounce could change the character of the move.
The three historical sell zones were all above the lower support area. The first was 4,369.6–4,373, immediately above the 4,370 reference and close to the day’s lower-timeframe decision area. The next two were 4,380.3–4,384 and 4,381.5–4,385, where price was being rejected from a higher intraday shelf. This is why the record is better described as repeated, parameterized reactions than as one oversized trade.
The important limitation is time. These levels belonged to September 1. They are not a current signal, a promise that the same zones will react again, or a substitute for a live risk plan. A historical technical map is valuable because it shows where the desk found asymmetry that day; it does not remove the need to reassess the market today.
The August 27 risk-reset report makes the same point from another angle: a level can work, but the management decision after the first move determines whether the recap teaches anything useful.
Trading Signals#
Signal 1 — SELL from 4,369.6–4,373#
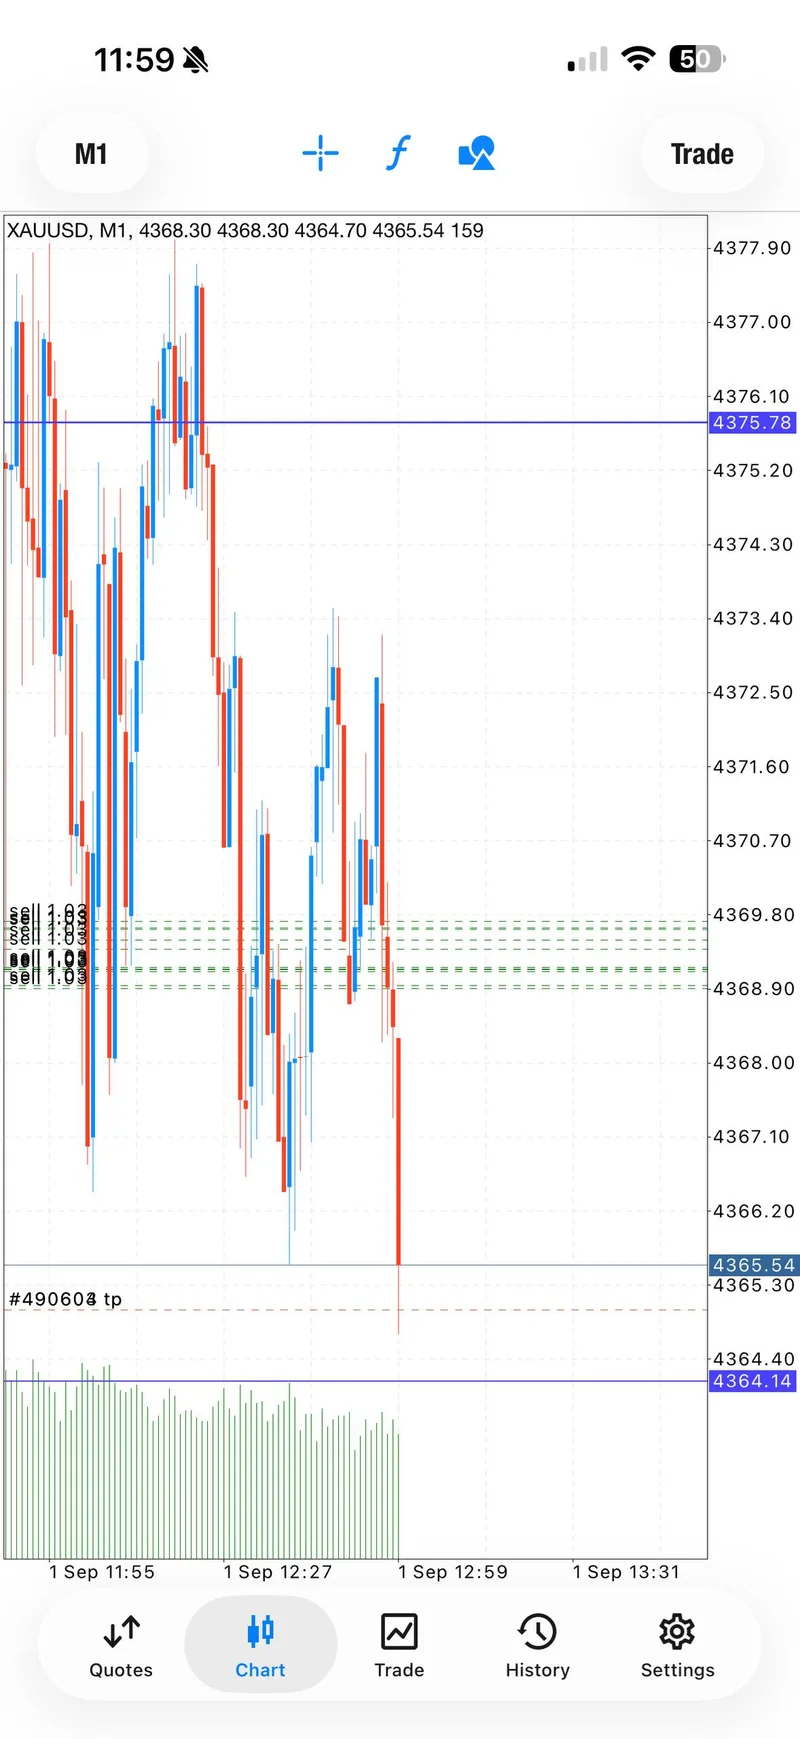
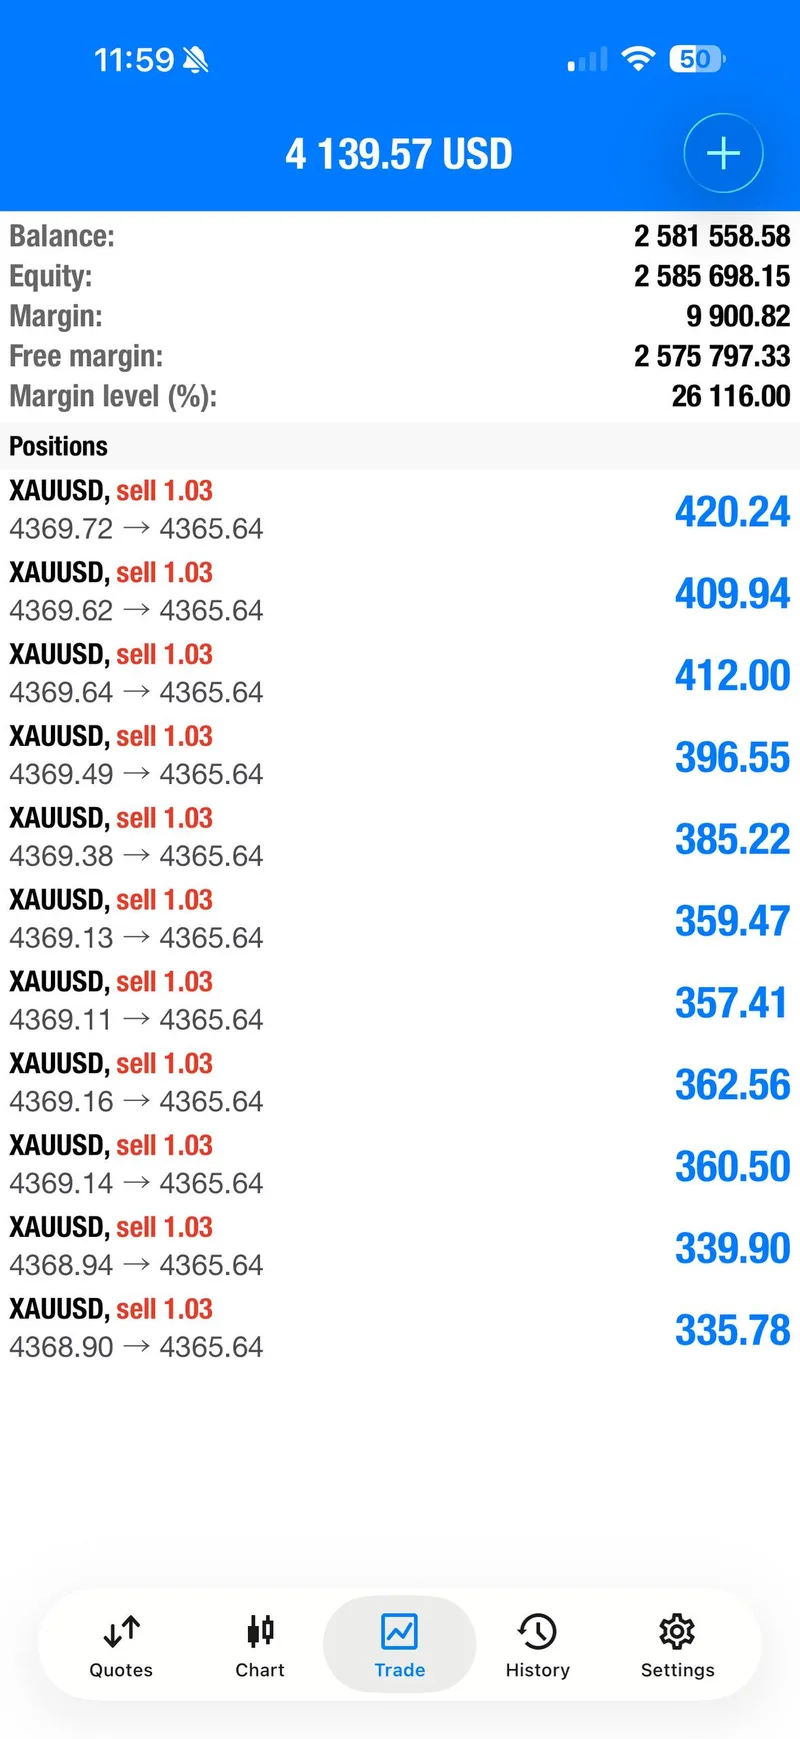
The first canonical SELL call was posted at 4,369.6–4,373 with a 4,377 stop and planned targets at 4,367, 4,365, 4,363, and 4,361, followed by an open runner. The public record then showed target two inbound, a target-two check, and a move to breakeven. A later update reported that breakeven was hit, followed by a compact summary showing targets one and two completed.
The honest result is two documented target milestones followed by risk-reset protection. There is no basis for rewriting this first sequence as a four-target finish. The value of the setup is precisely that the record shows partial follow-through and an explicit decision to remove the original downside exposure after the move had paid.
Signal 2 — SELL from 4,380.3–4,384#
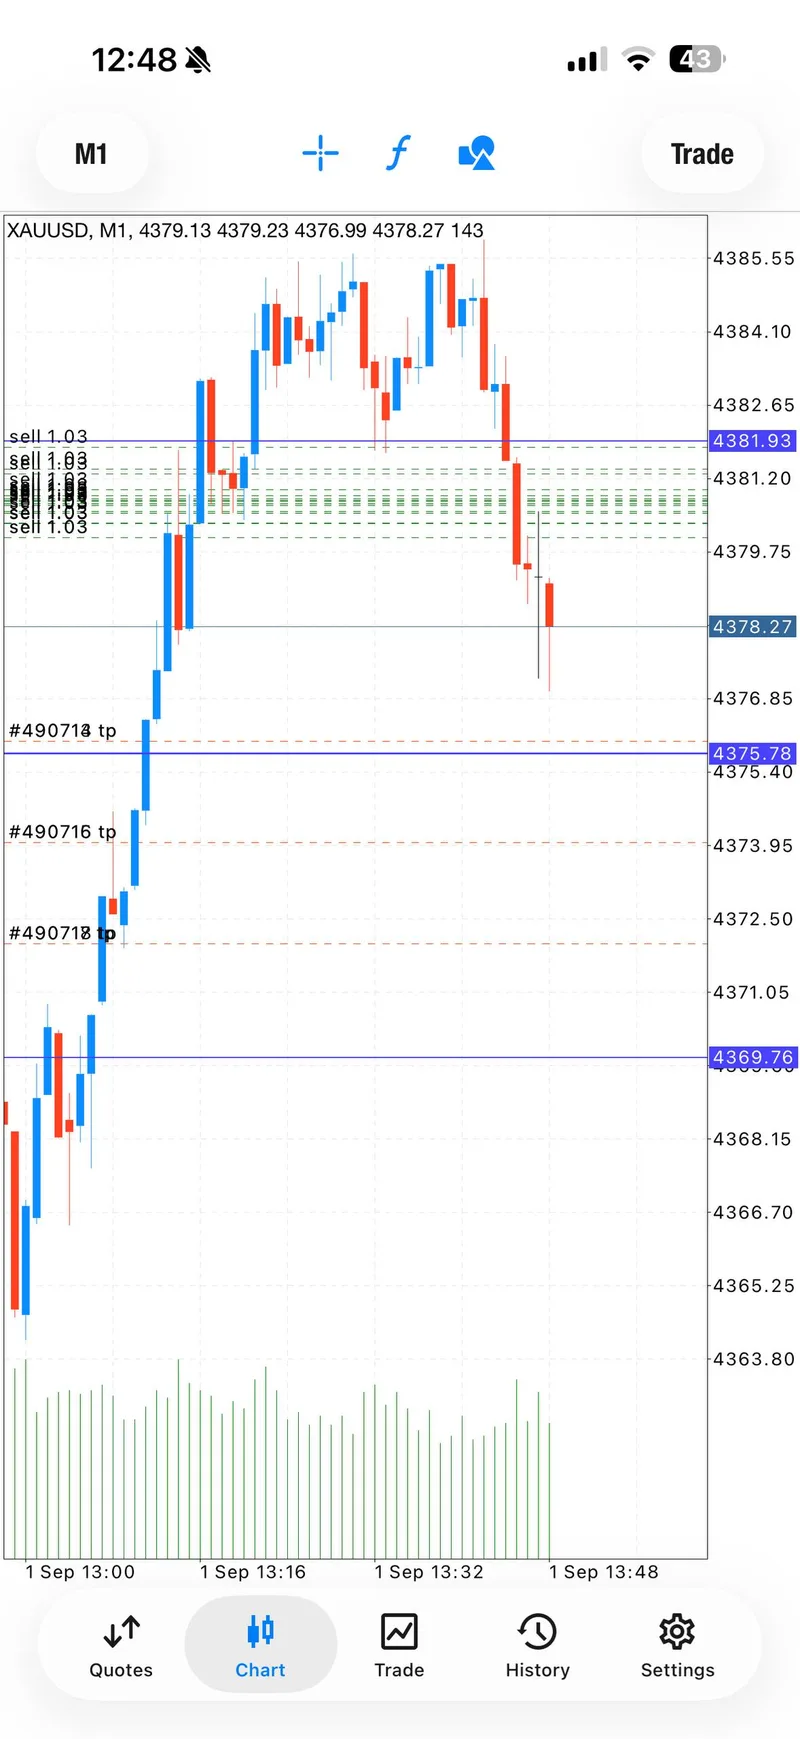
The second SELL call used the 4,380.3–4,384 entry zone, a 4,387 stop, and planned targets at 4,378, 4,376, 4,374, and 4,372, with an open runner. The follow-up sequence recorded a first-target check, a second-target update, and repeated instructions to move protection to breakeven. The later recap again stated that two targets had been reached before breakeven was hit.
This setup is distinct from the first even though both were SELL ideas. The entry zone, stop, target ladder, timestamp, and chart evidence are different. At the same time, the public and VIP lanes mirrored the same call, so those copies are not separate trades for the purpose of this report. Counting the canonical parameters prevents the day from looking larger simply because the same setup appeared in more than one lane.
Signal 3 — SELL from 4,381.5–4,385#
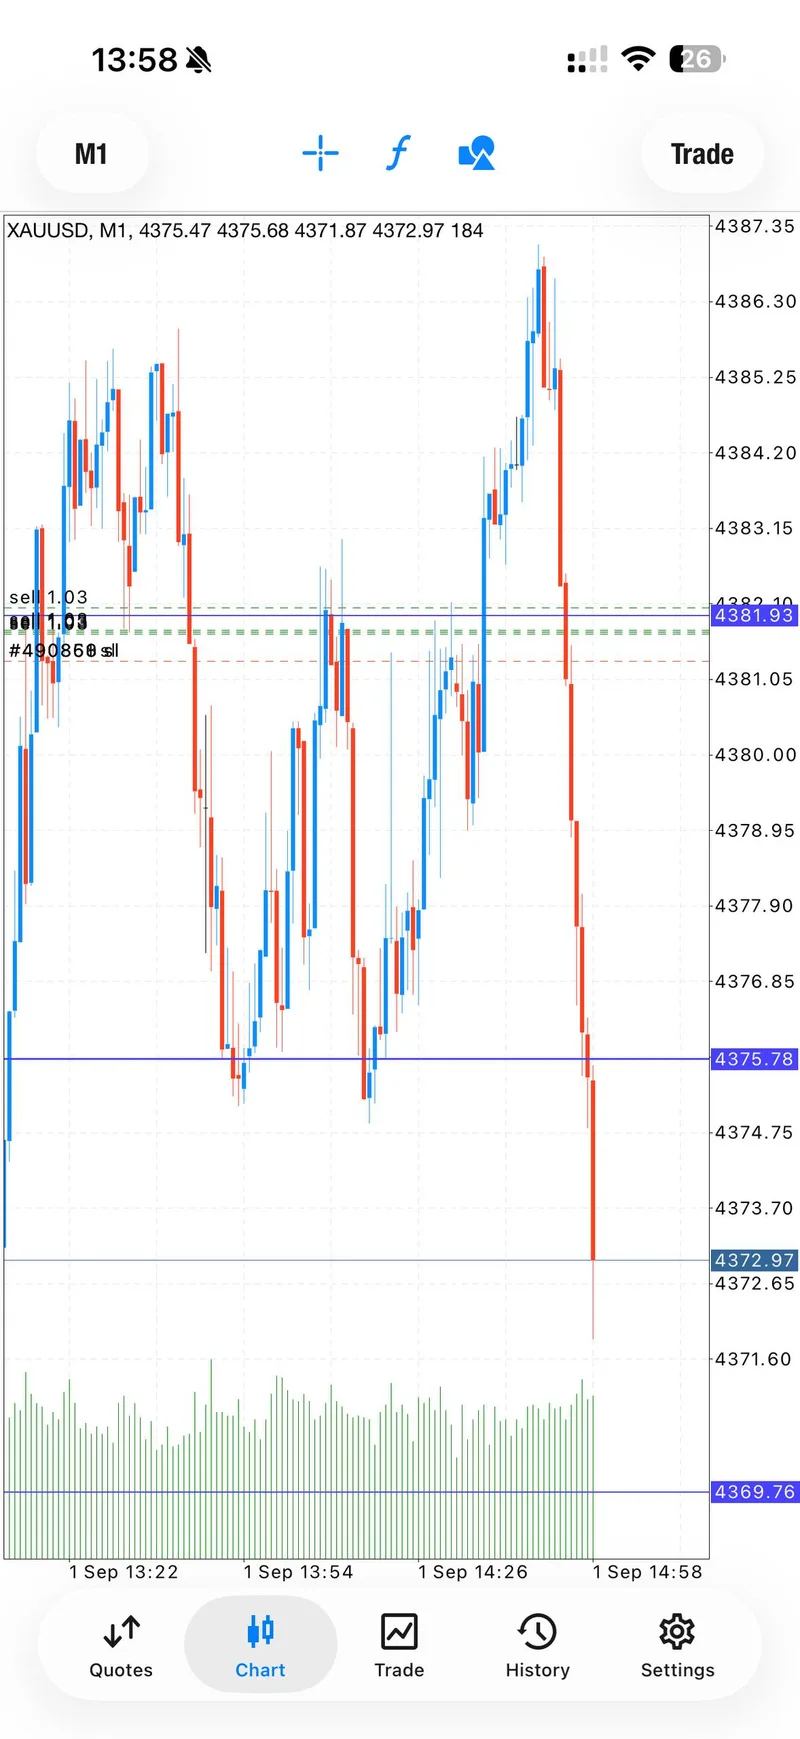
The third SELL call was posted at 4,381.5–4,385 with a 4,388 stop and targets at 4,379, 4,377, 4,375, and 4,373, followed by an open runner. This was the cleanest progression of the session: target two was checked, protection was moved to breakeven, target three was checked, and the record then reported all four planned targets completed.
The next public warning is just as important as the target update. At 12:00 UTC, the public lane stated that the VIP trade had already reached all of its targets and warned readers not to follow late because the opportunity had passed. That turns the final sequence into historical evidence rather than a recycled live instruction. It also shows why “the trade worked” and “it is still actionable” are two entirely different claims.
Signal Performance Breakdown#
The cleanest count for the session is three canonical SELL setups and eight published target milestones: two on the first setup, two on the second, and four on the final setup. The public record also documented repeated breakeven updates, so the management story is not just direction. It is staged exits followed by a reduction in open risk.
The first two setups were mirrored between the public and VIP lanes. The third was posted in the VIP lane and later summarized publicly with a no-chase warning. Treating the mirrors as separate trades would inflate the story, while treating the third as only a generic “sell call” would lose the strongest proof. The three-setup count keeps both sides visible.
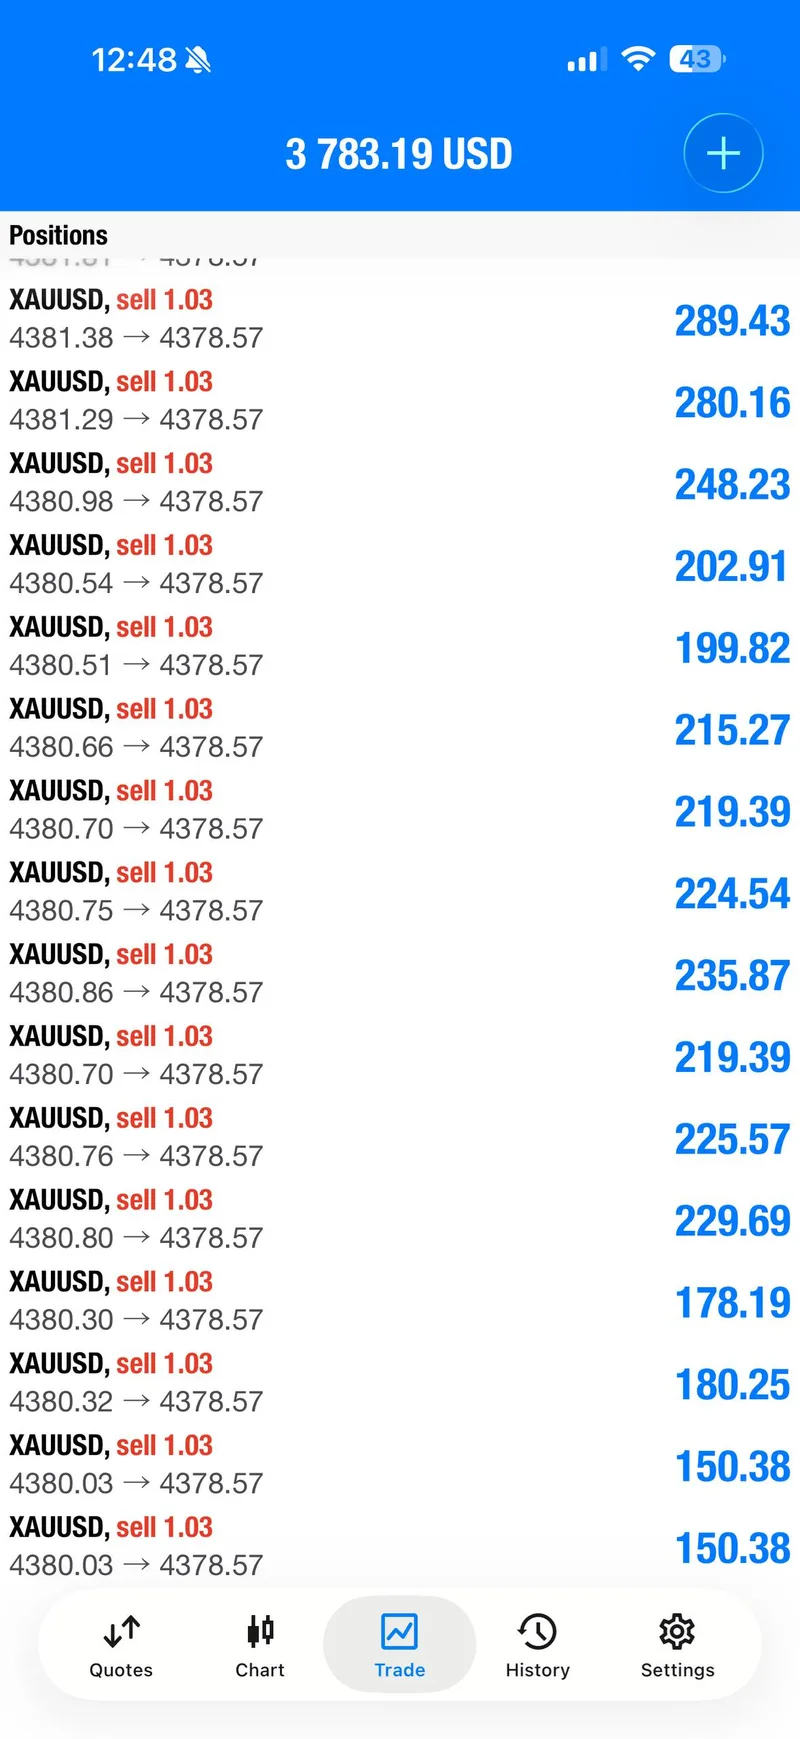
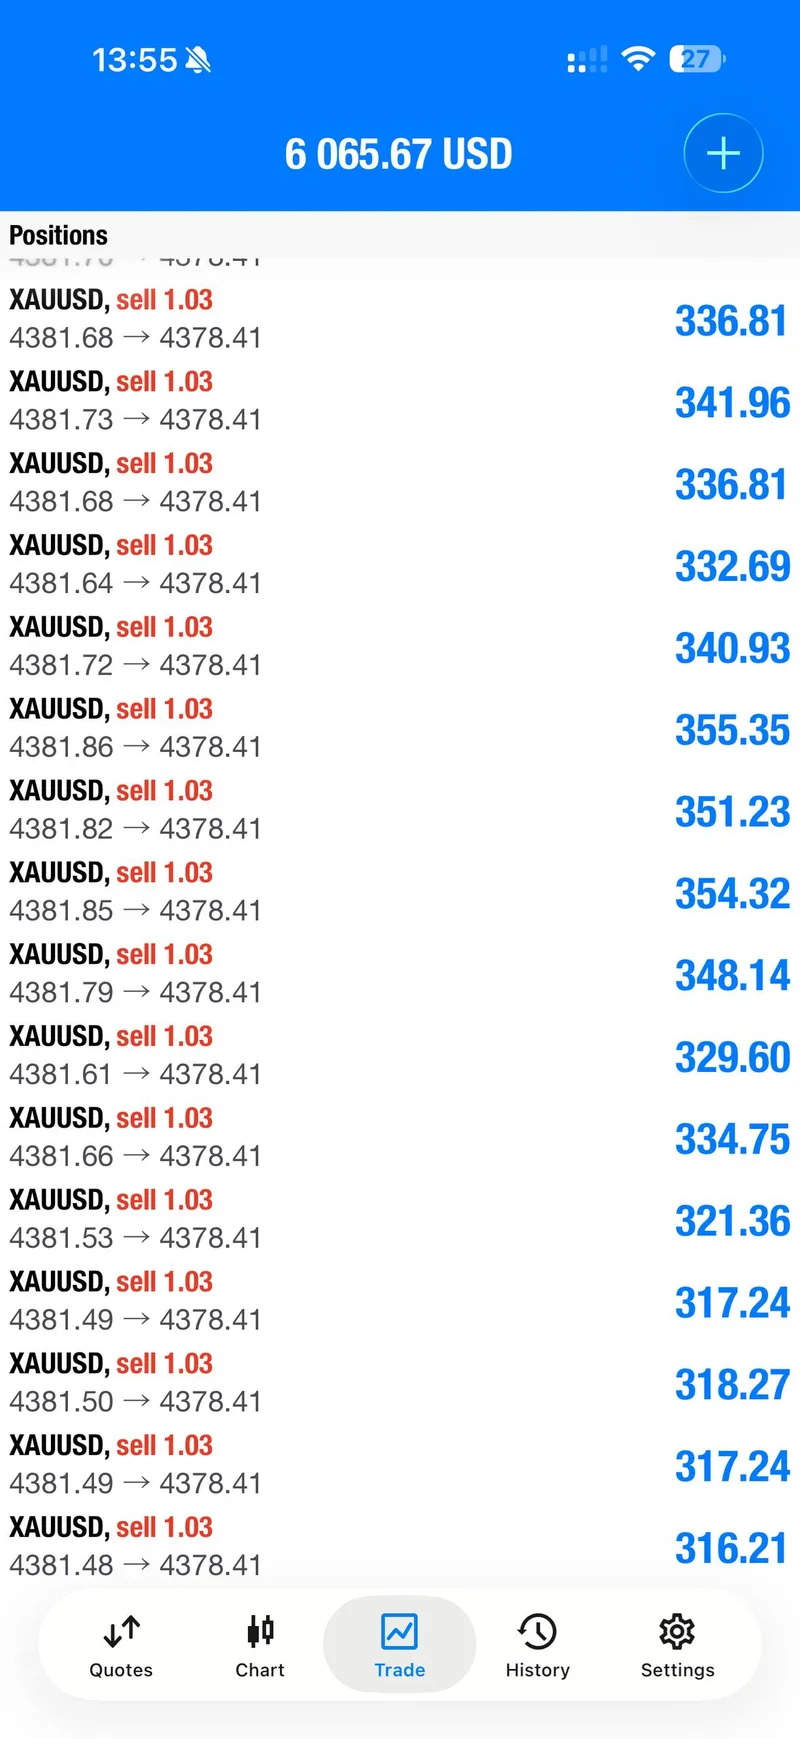
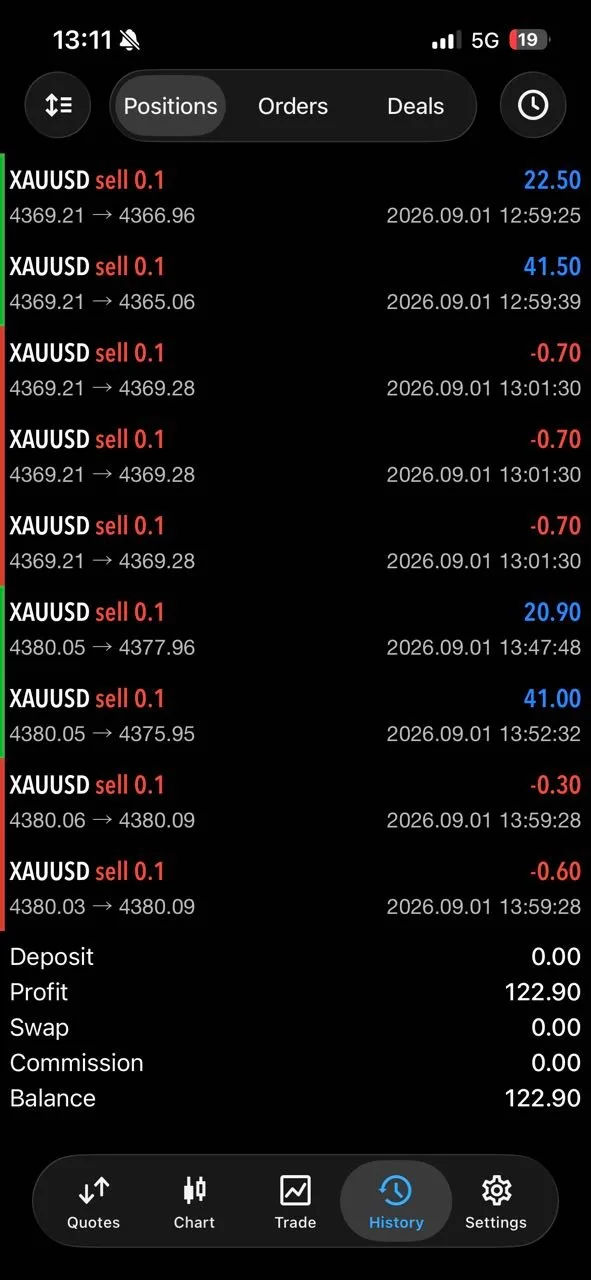
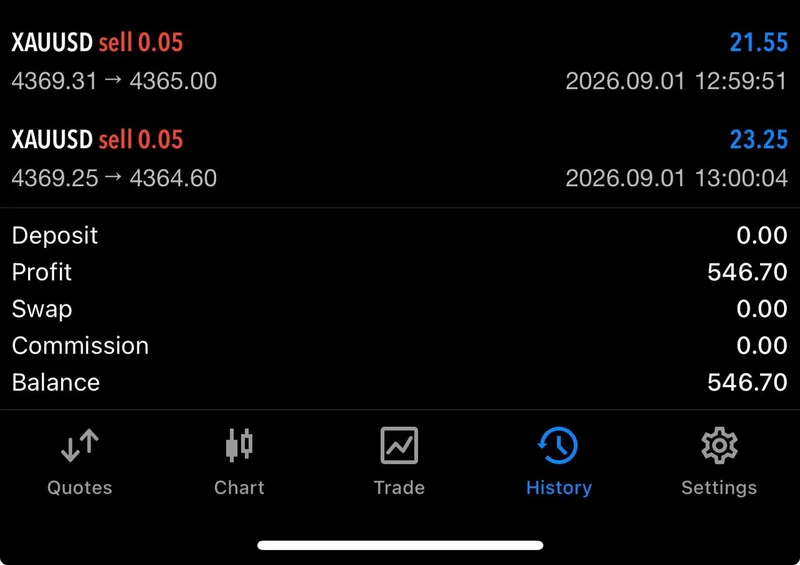
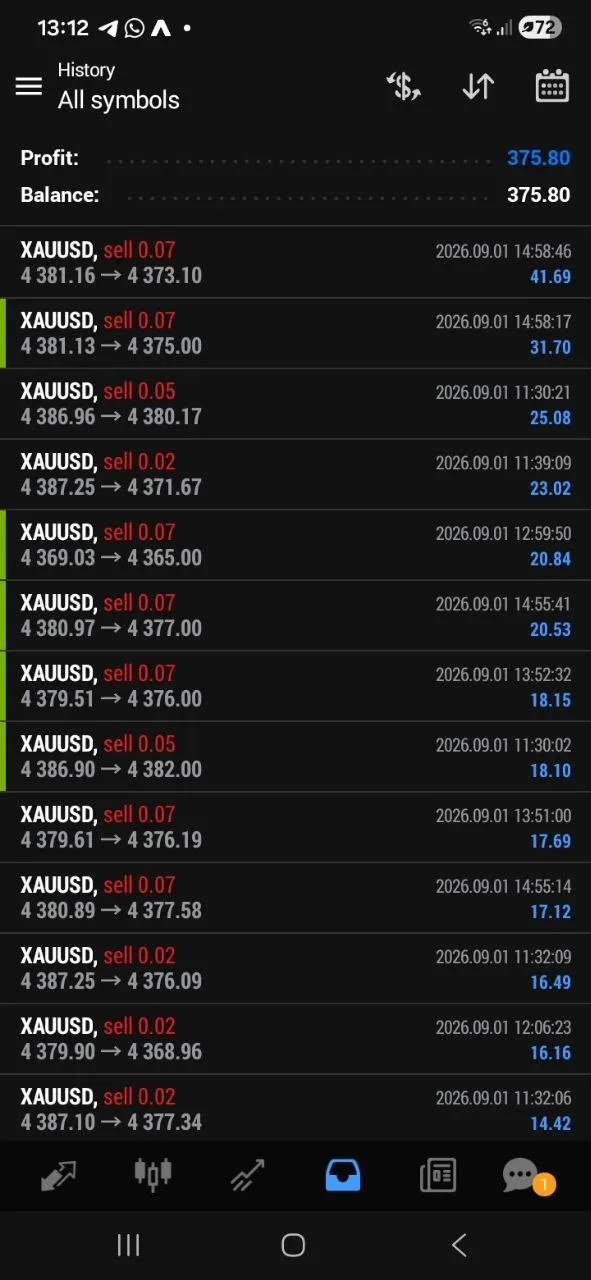
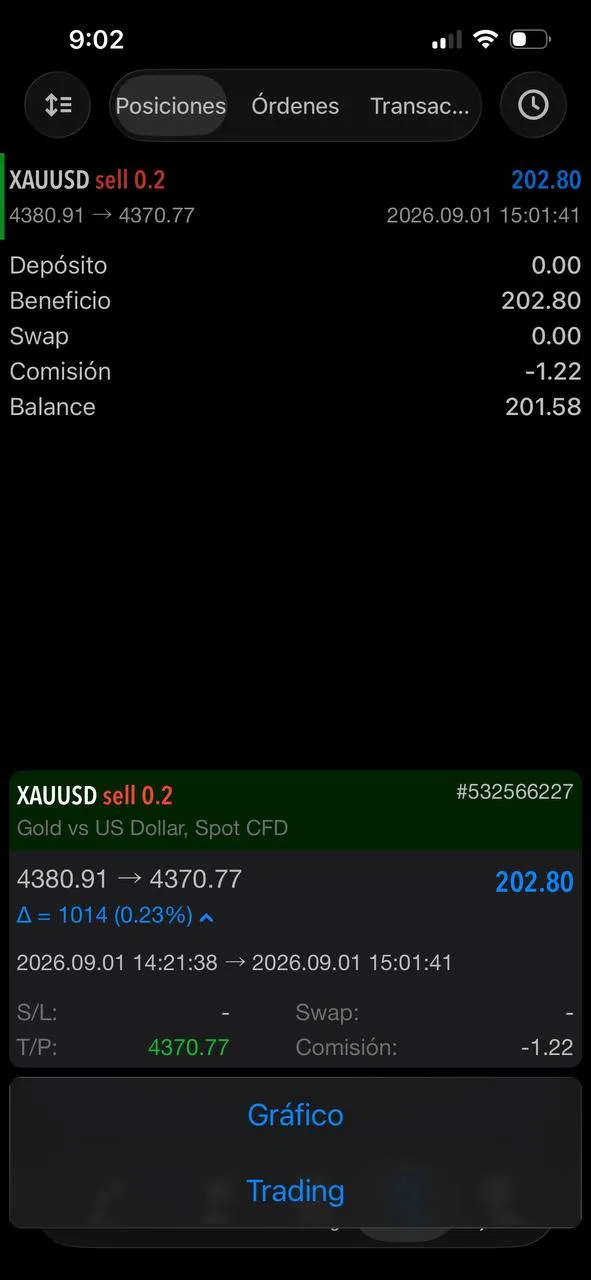
The day contains exactly 41 member feedback messages in the same-day response record. This article selects four individual account screenshots for the community gallery, alongside six trade-evidence screenshots. The 10 selected proof images are the clearest visual moments, not a claim that every message or account had the same outcome.
The member images show different account displays, including visible individual profits such as 122.90, 546.70, 375.80, and 202.80 in their respective account views. They should be read as personal snapshots attached to the day’s conversation, not as audited aggregate PnL, a typical return, or a guarantee for another account. That boundary makes the gallery more credible, not less persuasive.
The August 26 recovery report provides a useful comparison: a day can contain a successful recovery without every entry behaving identically. September 1 tells a cleaner continuation story, but it still depends on sequence-level evidence rather than one celebratory screenshot.
Execution Lessons#
The first lesson is patience before precision. The morning analysis had a bearish higher-timeframe read, but it did not pretend that every lower-timeframe candle was an entry. The eventual calls were attached to defined zones, stops, and target ladders. That makes the historical record legible: readers can see what was anticipated, what was invalidated, and how the position was managed after price moved.
The second lesson is that layered exits change the decision pressure. On the first two setups, the record shows two targets followed by breakeven protection. That is a different outcome from holding the full position and hoping for the final target. On the third setup, all four planned targets were reported, but protection was still moved before the last milestones were announced. The process did not depend on guessing the exact low.
The third lesson is knowing when not to participate. The 12:00 UTC public warning said the final setup had already completed its target sequence and was too late to follow. That warning protects the reader from a common retrospective mistake: seeing a winning chart after the move and assuming the same entry is still available. A good recap preserves the cutoff as carefully as it preserves the win.
Finally, account screenshots need context. A displayed profit belongs to the account, size, timing, spread, and execution that produced it. The gallery is useful because it adds real-world texture to the signal sequence, but it cannot turn four personal snapshots into a universal performance claim. Traders should size risk for their own account and accept that past results do not predict the next session.
What The Day Means Going Forward#
September 1 belongs in the “bearish pressure with structured reactions” category. Gold moved through a difficult macro backdrop, but the actionable historical edge came from selling defined rejection zones, taking profits in stages, and resetting risk before the move became someone else’s screenshot. The day was not won by a single dramatic forecast; it was documented through a chain of small decisions.
The next market question, in historical terms, was whether price could stay below the 4,400–4,430 decision area and continue toward the 4,370 support reference, or reclaim the 4,456–4,475 resistance band. Those are observations from the September 1 map, not a new signal. Any future session needs a fresh read because the dollar, yields, oil, volatility, and central-bank expectations can all change.
For readers comparing daily reports, this is the pattern worth following: the direction can change from one day to the next, but good reporting keeps the same standards. Define the setup, show the management, separate mirrored posts from distinct trades, and say when the opportunity is over. That is how a daily gold trading report becomes a practical record instead of a highlight reel.
FAQ#
Why does this daily gold report focus so heavily on trade management?#
Because September 1 produced clear evidence of staged targets and breakeven protection. The first two SELL sequences reached two published target milestones before risk was reset, while the final sequence reached all four planned targets after protection had already been moved. The management decisions explain how the day was handled without implying that every account entered or exited identically.
What made the September 1, 2026 session stand out?#
Three distinct SELL zones were documented, eight target milestones were reported, and the final public update explicitly warned readers not to chase after the targets were complete. The macro backdrop was bearish, but support remained nearby, so the record combines direction, timing, and restraint rather than presenting a one-way market fantasy.
Where can readers follow the next GTMO update?#
Message @GTMOBest for the next public gold update and information about the free Telegram lane. Read each new session on its own terms, use a risk plan that fits your account, and do not treat a historical recap as a live entry instruction.
Connect with Gold Trader Mo#
You can follow Gold Trader Mo for the broader trading education archive and message @GTMOBest for the free Telegram lane. The public channel is the right place to ask about current updates, free signals, and access options without assuming that a past screenshot is a promise about the next trade.
This report is for education and market commentary only. Trading involves risk, capital can be lost, account results vary, and past performance never guarantees future results. The levels and outcomes in this article describe September 1, 2026 and are not current trading instructions.