
Market Snapshot#
August 27 became a notably clean XAUUSD story in the public @GTMO record: two parameterized SELL calls, a reported 150+ pip waterfall, staged target updates, and risk reduced as the move developed. A later public recap reported $20,000+ secured. That number is presented here as a reported channel claim, not audited aggregate PnL and not a promise that every account achieved the same result.
Readers who want free signals and FREE VIP channel access can message @GTMOBest. The details below are a historical session recap, not a live trading instruction.
The market context was still made up of asynchronous snapshots rather than one final synchronized close:
| Metric | Same-day snapshot |
|---|---|
| XAUUSD area | $4,584.96 spot snapshot at 9:00 AM ET / 8:00 PM GMT+7; official daily close unavailable at capture |
| DXY | 99.13 delayed snapshot, 10:06 AM EDT |
| US 10Y yield | 4.669% same-day fixed-income snapshot |
| WTI | $82.47 delayed October 2026 quote; prior settlement $82.23 |
| VIX | 14.72 Cboe snapshot as of 2:15 PM ET; prior close 15.21 |
| Fed target range | 3.50%-3.75%, the latest visible FOMC target range; current-day status not independently confirmed |
The spot-gold snapshot comes from CNBC Select. The dollar and oil figures are timestamped delayed quotes from MarketWatch DXY and MarketWatch WTI. The yield backdrop is discussed in Morningstar's same-day fixed-income report, while the VIX snapshot is from Cboe. These figures support the story; they do not turn an intraday snapshot into an official close.
Why The Tone Changed So Fast#
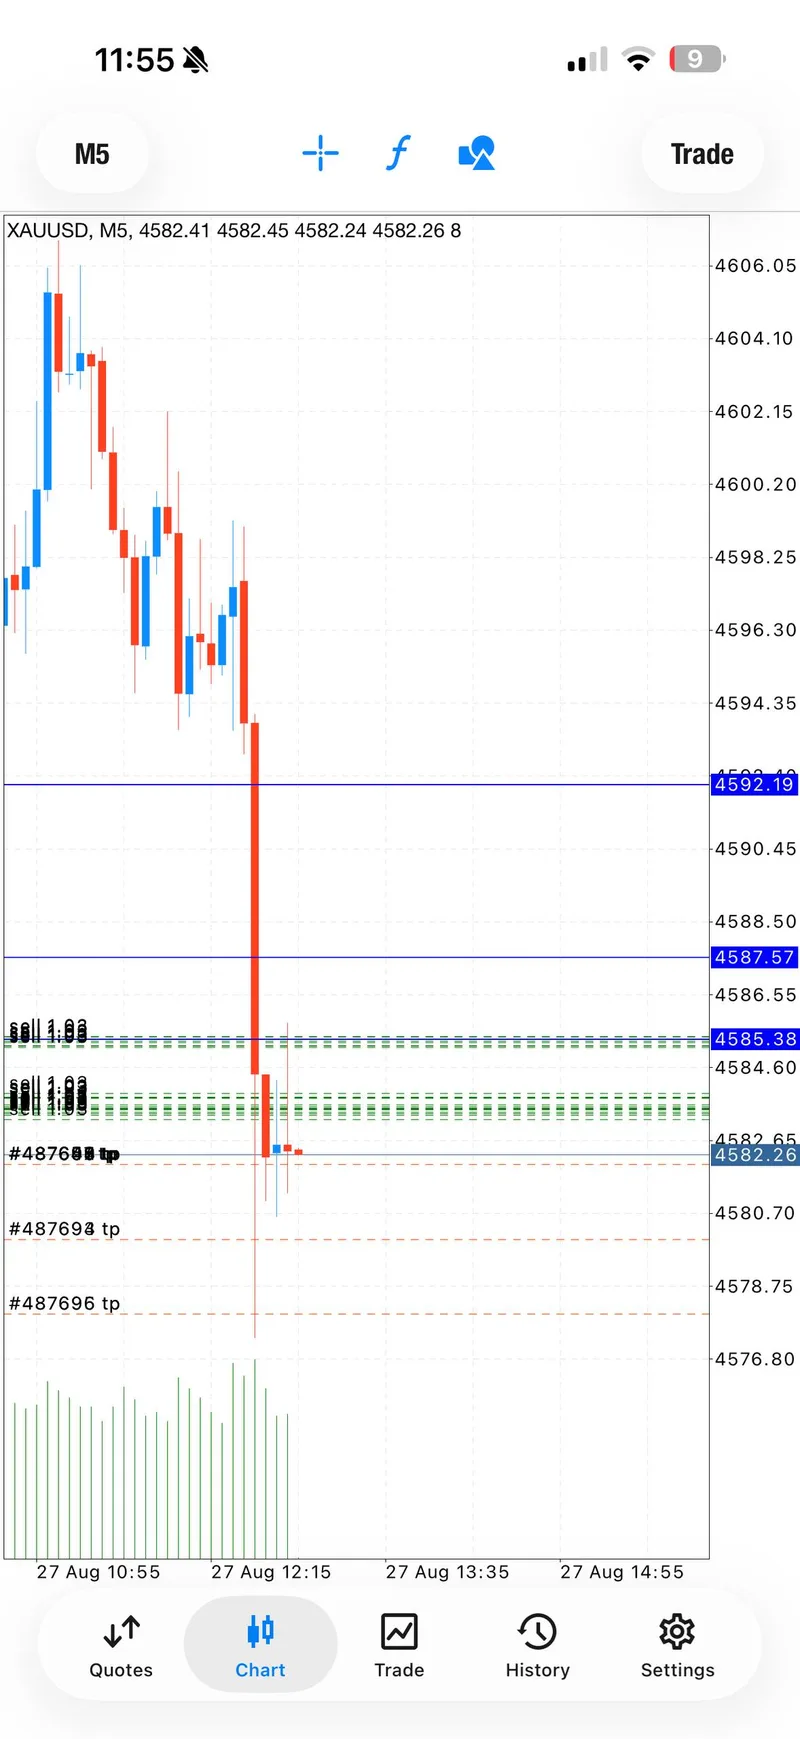
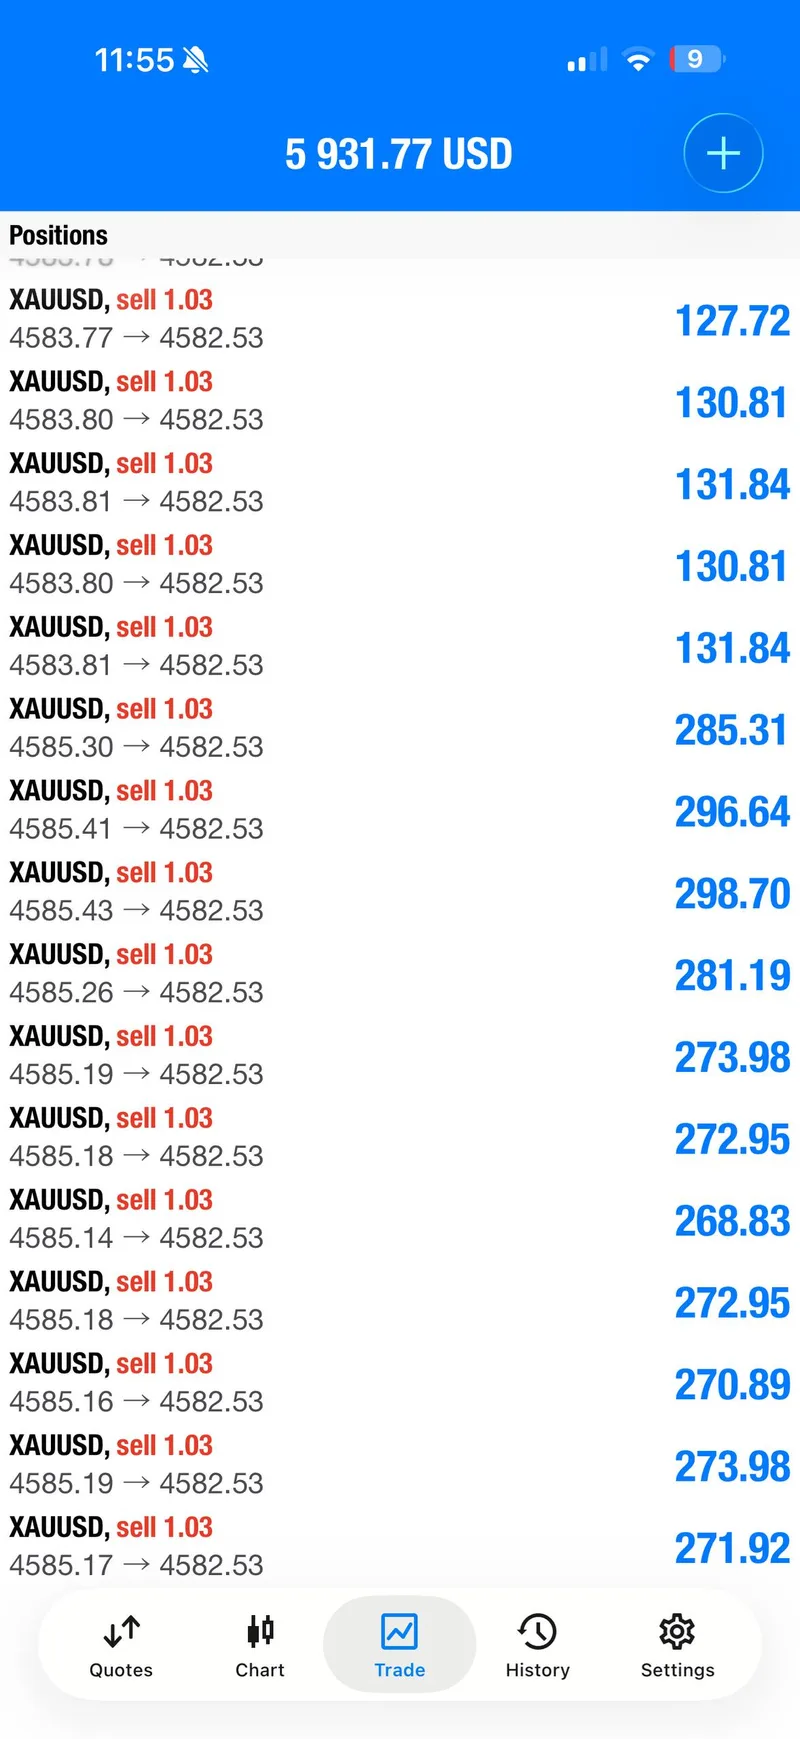
The tone changed because the day offered a complete management sequence rather than a single celebratory screenshot. At 16:53 GMT+7, the public record carried the first SELL zone at 4584.2-4588 with a stated stop at 4591 and four fixed target levels plus an open leg. Within minutes, the record described entries in profit, then a move into reduced risk.
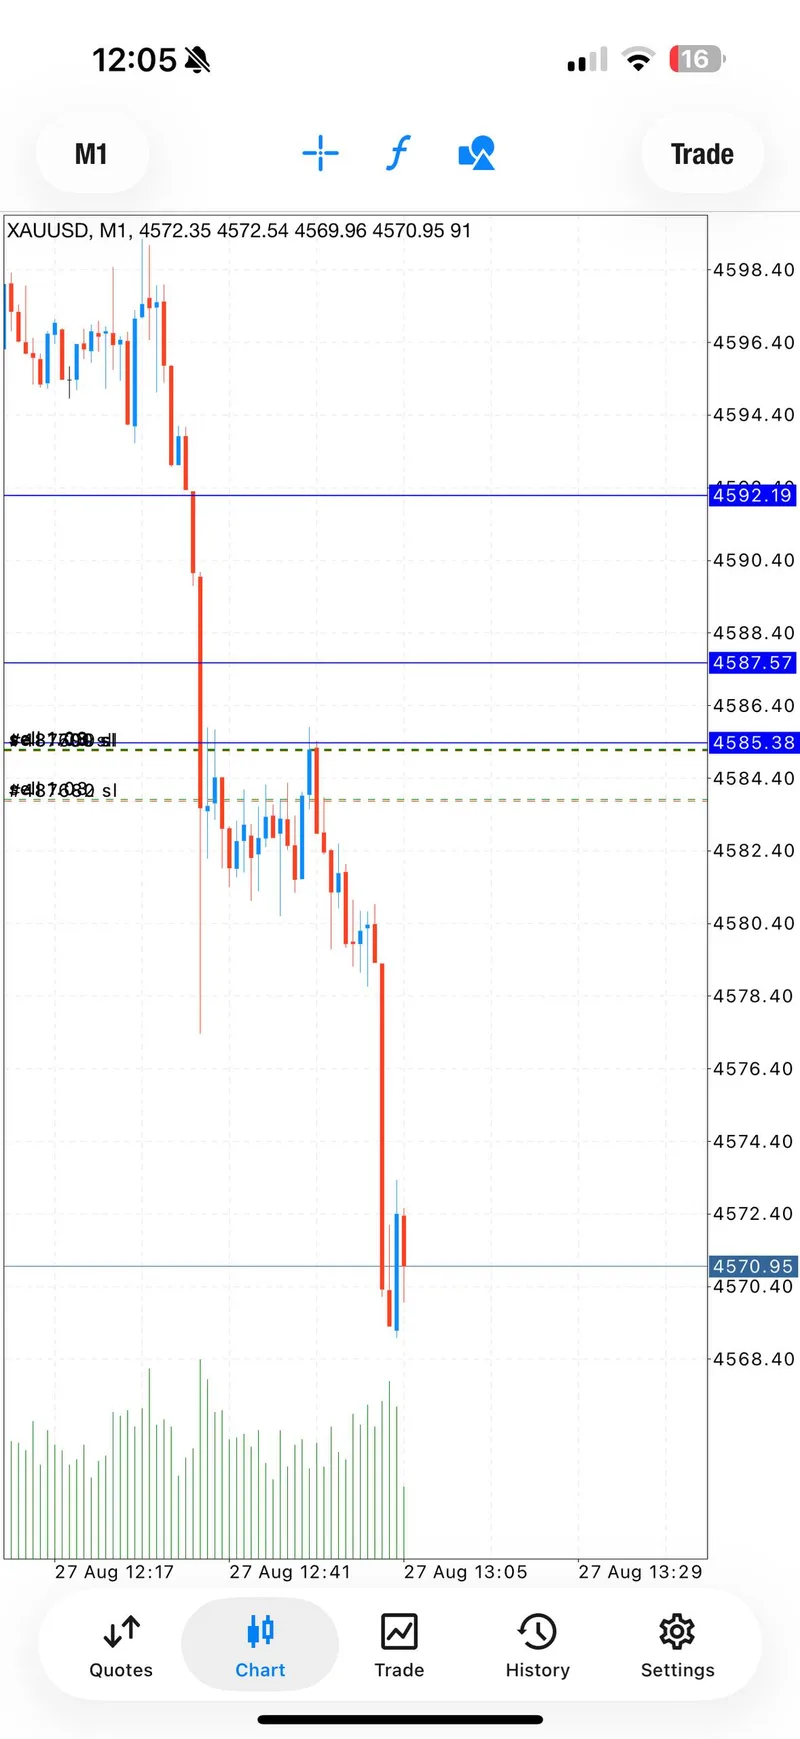
By 17:05 GMT+7, the public update described a 150+ pips waterfall with all listed take-profit levels completed. At 17:33 GMT+7, a further 4574 target was displayed with five target checkpoints. The final protection note for that sequence arrived at 17:48 GMT+7, when the last entries were described as having reached a risk reset.
The second setup gave the day its second act. A new SELL zone appeared at 18:30 GMT+7, the protective level was moved higher at 18:33, and later updates moved from all entries in profit to taking partial profit and holding only top entries behind protection. That progression explains why the recap reads as a process story: direction mattered, but the visible changes in exposure mattered just as much.
Technical Outlook#
The useful technical information here is historical and specific. The first public SELL setup used the 4584.2-4588 zone, a 4591 stop, and fixed targets at 4582, 4580, 4578 and 4576, with an open final leg. The later 4574 target was displayed separately in the public progress record.
The second setup used 4594-4598, a 4601 stop and targets at 4592, 4590, 4588 and 4586, again with an open leg. The stop was later moved to 4604 as the tape tested the top of the zone. Those levels explain the public sequence; they should not be read as current entry instructions after the session.
Broader same-day context described gold as range-bound after a strong multi-month advance, with yields watched ahead of Jackson Hole and stronger inflation data keeping rate expectations relevant. Because no final synchronized spot-gold close was available at capture, the responsible technical conclusion is limited: the public trade record shows that these two zones produced the documented move, while a future session would need fresh confirmation rather than copied levels.
For comparison, the previous report, August 26's Recovery and Repricing recap, shows a different kind of session: a failed first BUY followed by recovery management. That contrast is useful because it keeps August 27 in its own evidence lane.
Trading Signals#
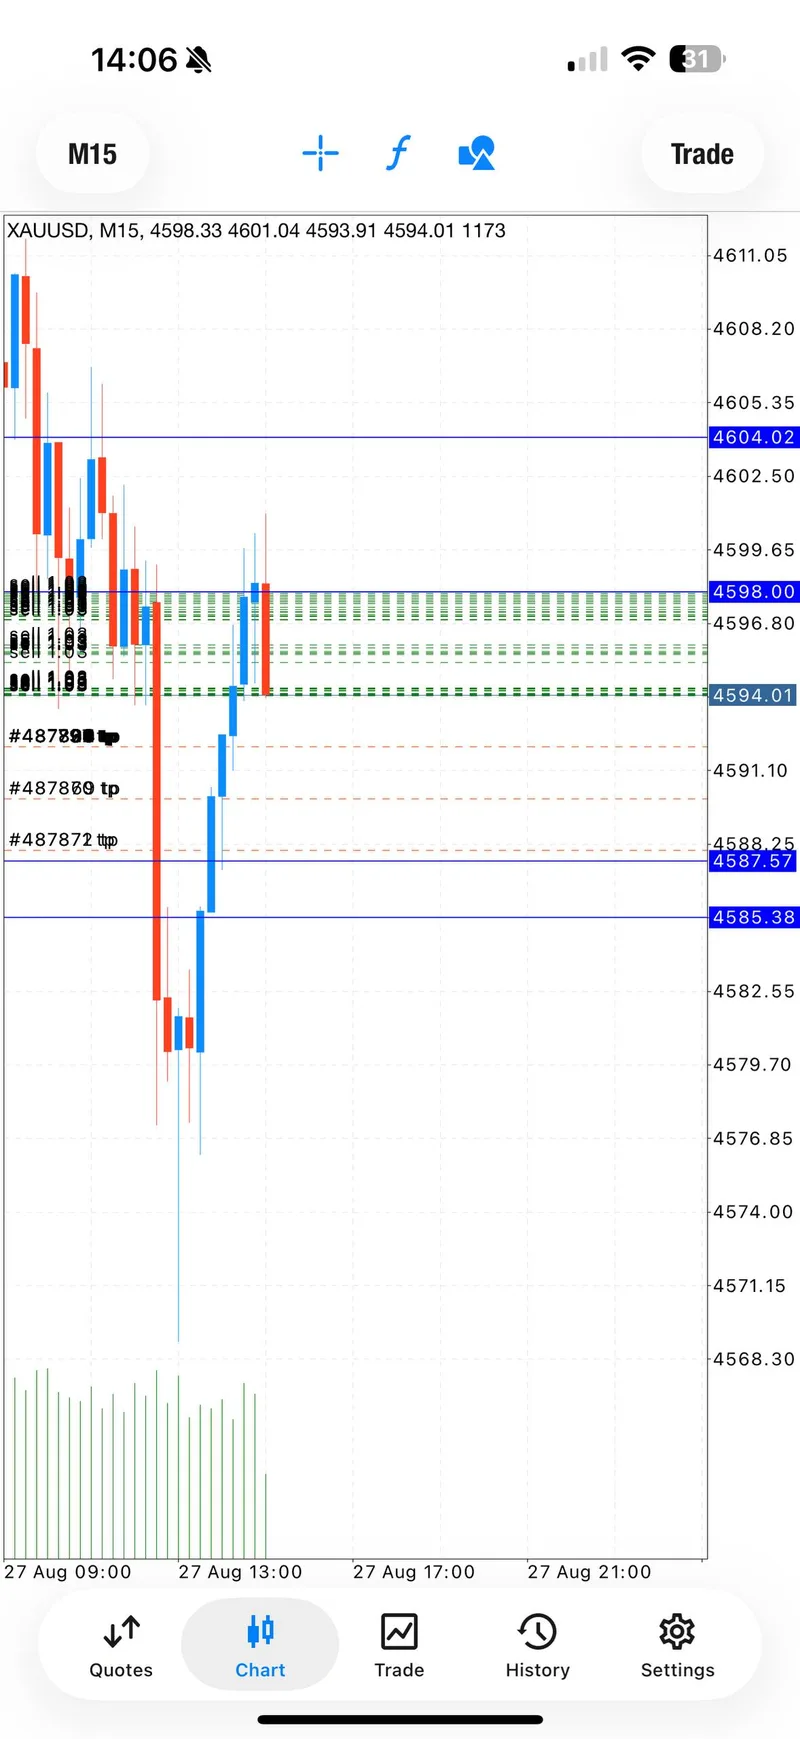
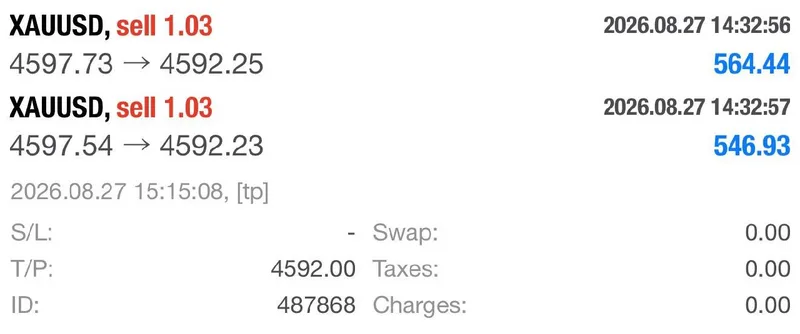
Every level in this section belongs to the August 27 historical record. It is included to explain what was communicated and what happened afterward, not to instruct a reader to enter now.
SELL setup 1 — 4584.2-4588#
The first setup was posted at 16:53 GMT+7 with a stop at 4591. The listed targets were 4582, 4580, 4578 and 4576, followed by an open leg. The public record then moved through a fast sequence: entries in profit, reduced risk, a reported 150+ pips waterfall, and all listed target levels completed.
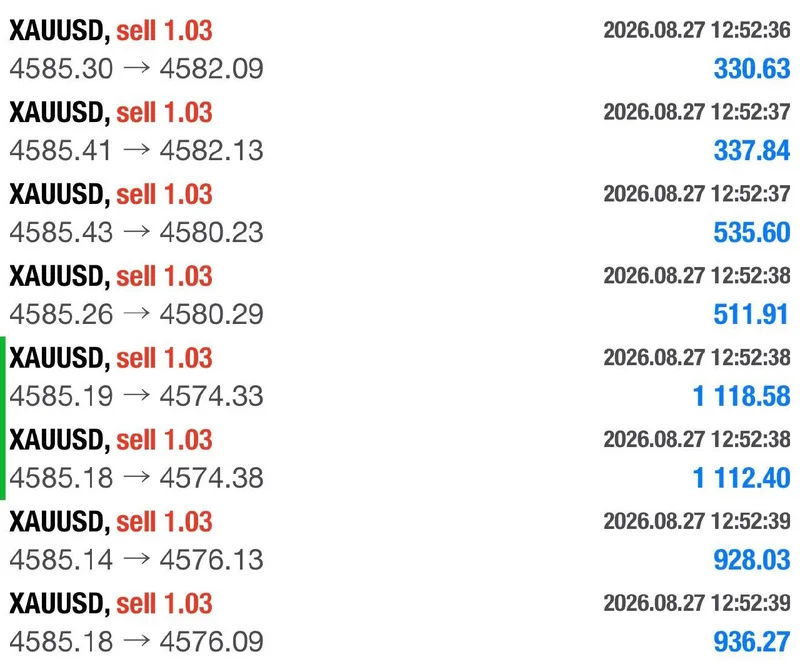
The 17:33 update added a 4574 target and displayed five target checkpoints. That is stronger evidence than simply calling the day a winner because it shows progression across the move. The later 17:48 note said the last entries had reached a risk reset, closing the loop on exposure rather than leaving the result as an unqualified headline.
SELL setup 2 — 4594-4598#
The second setup was posted at 18:30 GMT+7 with a stop at 4601 and targets at 4592, 4590, 4588 and 4586, plus an open leg. At 18:33, the protective level was moved to 4604 while volume was described as increasing.
The record later reported all entries in profit at 19:06. At 19:16, the first target was checked and a risk-reset instruction was issued. Most entries were then closed, with only top entries held behind protection. At 19:20, the public record said the risk reset had been reached across the trades; at 19:30, it carried a low-risk target update. The important point is the sequence of reducing exposure as the move paid, not a claim that every individual account had an identical outcome.
Signal Performance Breakdown#
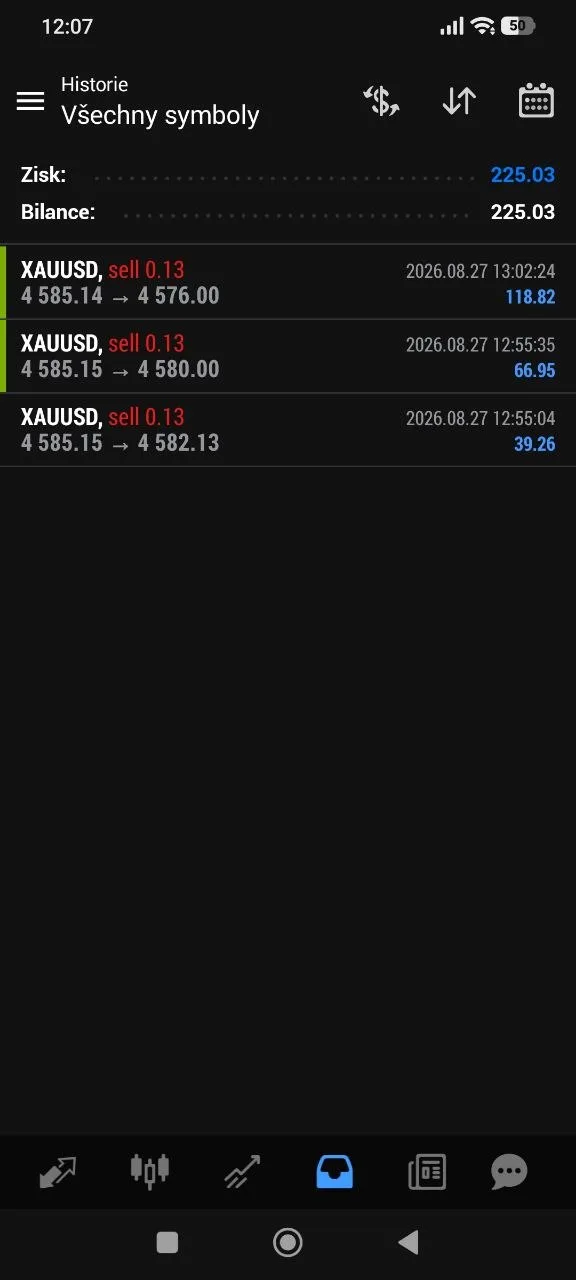
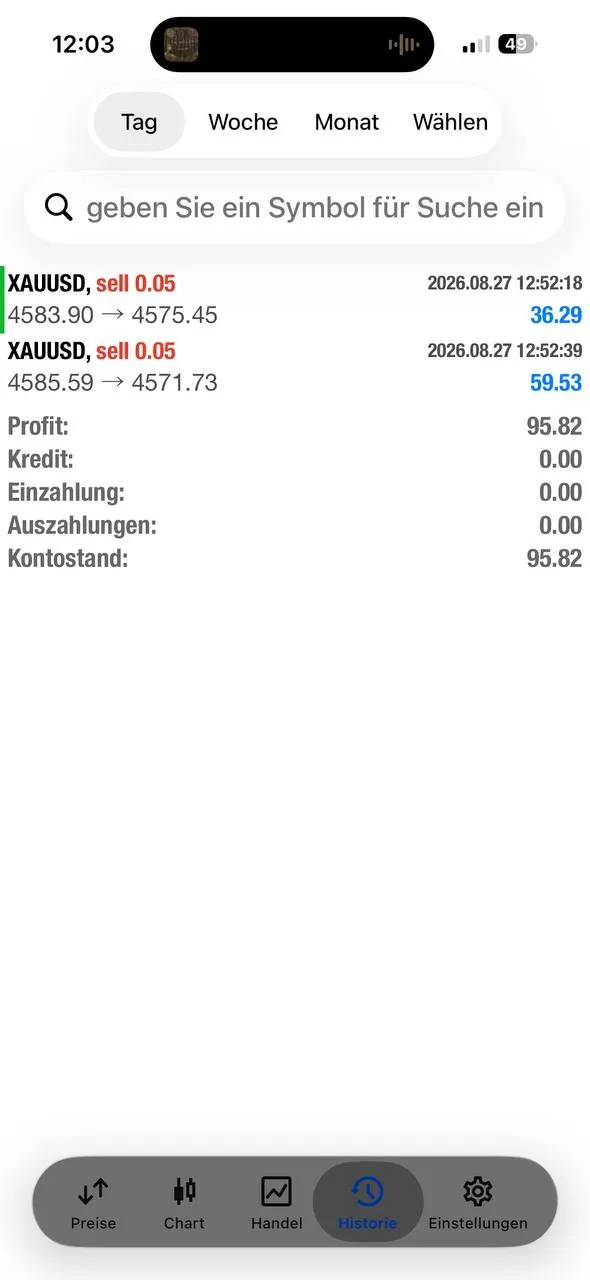
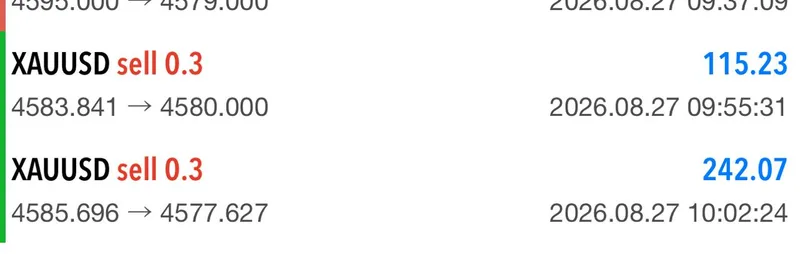
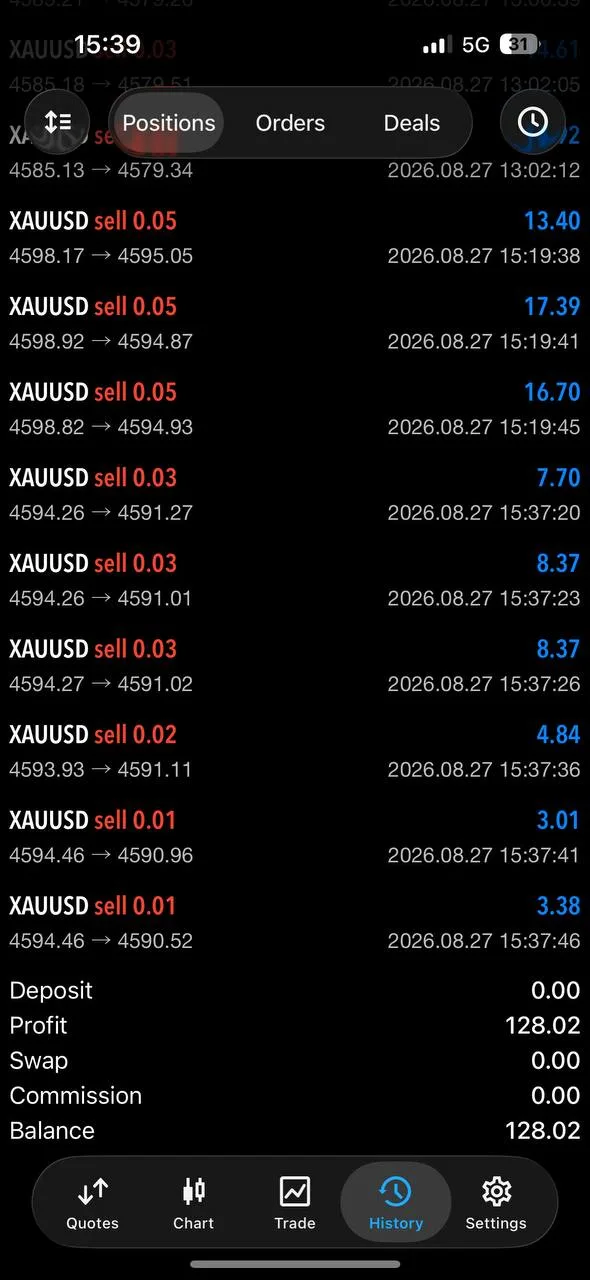
The clearest end-of-day claim in the public record was $20,000+ secured, posted at about 20:03 GMT+7. It is kept in that bounded form because a channel recap is not an audit of every account. The directly traceable proof is the two-call sequence, the first call's reported 150+ pips, the target progression through 4574, and the protection updates attached to both setups.
The public record contained exactly 32 member feedback messages for the day. This report shows 4 selected member proof screenshots, while the complete gallery contains 10 screenshots: 6 trade-evidence images and 4 member-feedback images. Those counts are deliberately different. The 32 figure is the full message total; the 4 figure is the selected feedback subset; the 10 figure is the total visual gallery. Individual account displays are not added into one result.
Member messages included individual reports such as $261 today, £240, €250, £1,212, $240, $120 and £400. They are presented as individual messages, not as a combined performance number. A week-to-date figure was left out of the same-day claim, and a message whose attached screenshot showed a different visible total was also left out of quantified proof. That restraint makes the selected visuals more useful: they show dated account screens and positive XAUUSD closes without pretending to verify a universal outcome.
For another comparison point, August 25's 100+ Pip Risk Reset report also separates a strong public move from account-specific evidence. The recurring lesson is that trade management and proof accounting belong beside the headline, not after it.
Execution Lessons#
First, a defined zone and stop give a historical call structure, but the useful result came from what happened after price moved. The first setup was not reduced to one final screenshot: the record showed early profit, staged targets, a further 4574 checkpoint, and a later risk reset.
Second, staged targets reduce the pressure to guess one perfect exit. The second setup illustrates the same idea from a different angle: a new SELL zone, a protection adjustment, partial profit-taking, and a close sequence that kept risk under discussion.
Third, public proof needs scope. A reported $20,000+ result, a member's displayed account total, and a 150+ pips channel update are different evidence types. They can sit in the same recap only when each is labelled for what it actually proves.
Finally, historical levels are not a shortcut to the next trade. The next decision belongs to a new session, new price action, and new risk boundary. This report is for education and commentary, not a recommendation.
What The Day Means Going Forward#
August 27 stands out because the public record connected direction, target progression, and risk reset across two separate SELL sequences. The first move supplied the strongest result beat; the second showed that the desk continued to manage exposure after the initial waterfall rather than treating the first win as the whole story.
The broader market backdrop remains a caveat. Gold was still represented by intraday snapshots when this recap was prepared, so readers should not confuse the $4,584.96 spot reference with an official daily close. The same caution applies to the DXY, yield, oil and volatility figures: they were timestamped context points, not one synchronized settlement table.
A later reader can use the report to ask better questions: did the market respect the same decision areas, did protection arrive before emotion took over, and were individual claims kept separate from public channel reporting? Those are useful review questions. They are not instructions to copy an old setup.
For a longer sequence of daily context, August 24's Four Targets After Risk Reset report provides another example of why staged outcomes and protection notes belong in the same historical record.
FAQ#
Was the $20,000+ result an audited total for every member?#
No. The public record reported $20,000+ secured, but this recap treats it as a bounded channel claim. Member messages and account screenshots are individual evidence and are not combined into one audited total.
What were the two historical XAUUSD setups?#
The first SELL zone was 4584.2-4588 with a 4591 stop and targets at 4582, 4580, 4578 and 4576. The second was 4594-4598 with a 4601 stop, later moved to 4604, and targets at 4592, 4590, 4588 and 4586. These are historical levels from August 27, not live instructions.
How many member screenshots are shown?#
The full same-day record contained 32 member feedback messages. Four member screenshots were selected, and the complete gallery contains 10 screenshots in total: six trade-evidence images and four member-feedback images.
Connect with Gold Trader Mo#
For free signals and FREE VIP channel access, message @GTMOBest. The free lane is the place to follow daily gold updates, see how historical calls are explained, and ask about the available VIP channel without confusing a public result claim with a guarantee.
What readers can expect from the public lane:
- Free daily gold-signal updates with clear historical context.
- Recaps that show entry zones, target progression and risk-reset notes when the public record supports them.
- A direct route to follow Gold Trader Mo and message @GTMOBest about free signals and FREE VIP channel access.
This daily report is for education and commentary only. Trading involves risk, capital can be lost, and past performance never guarantees the next session will look the same.