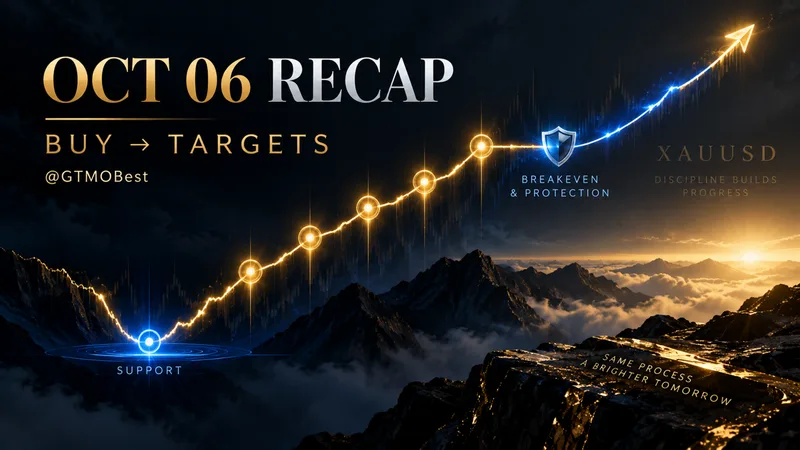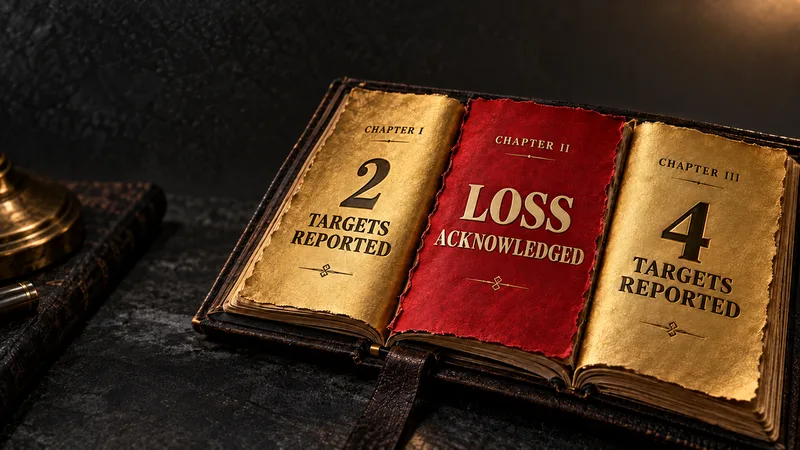
Gold did not give MO a clean, one-way session on October 7, 2026. The public record showed three buy sequences: an early move with two reported targets, a second attempt that ended in an acknowledged loss, and a later buy with four reported targets before the remaining positions reached breakeven. The rebound was visible. A positive net result for the entire day was not established.
For readers deciding whether to follow Gold Trader Mo, the useful evidence is the sequence, including the uncomfortable middle—not a promise that every difficult trade eventually wins. Read the updates on the public @GTMO channel, or message @GTMOBest for free signal-channel access. These are past-session examples, not instructions to enter a trade now.
This is GoldTraderMO.Net’s own editorial recap of MO’s public updates, not an independent review or audit of trading results. The featured artwork uses symbolic book chapters to illustrate the sequence; it is not a photograph of trading records.
Market Snapshot#
Gold was quoted at $4,088 per ounce at 9:00 a.m. Eastern Time on October 7, 2026, according to Fortune's dated gold-price report. That observation was at 13:00 UTC, or 20:00 in Vietnam. It is an intraday snapshot, not a session close or a live quote at the moment you read this article.
| Market measure | October 7 observation |
|---|---|
| Gold spot snapshot | $4,088 per ounce at 13:00 UTC |
| Final gold close | Not yet available; session still open |
| Verified full-session high and low | Not available in this recap |
| Dollar index, Treasury yield, oil and volatility snapshots | Not included without a matching dated observation |
| Federal Reserve policy-rate snapshot | Not included in this recap |
The later market snapshot should not be confused with the earlier prices in MO's public trade updates. A buy zone is the area where a past setup was proposed; it is not the market's daily closing price. Likewise, reaching a target during an earlier rebound does not establish that gold stayed above that level through the US session.
The distinction matters for anyone reading after the move: this report documents what had happened by the afternoon evidence cutoff, while the global trading session remained open.
Why The Tone Changed So Fast#
The clearest change in tone came from the public trade sequence itself. At first, MO reported quick progress on a buy. Later, another buy struggled near a support area, the planned loss limit was widened, and MO ultimately said he had cut the loss. A renewed attempt then produced a rebound and a succession of target updates.
That is a more useful account than calling the entire day an effortless recovery. Support can fail, a pattern can take longer than expected, and conviction can increase risk if a trader keeps moving the point at which an idea should be abandoned. MO's messages preserved those decisions instead of presenting only the successful screenshots.
Gold's wider backdrop also requires care. Changes in the dollar and bond yields can alter the appeal of an asset that pays no interest, but a general relationship is not proof of the cause of a particular day's move. This recap does not assign the decline to a specific Federal Reserve event or assert a same-day yield number without dated support.
For comparison, the October 6 gold report provides the preceding session's record. Compare the documented decisions, not just each day's headline.
Technical Outlook#
MO's published prices are useful here as historical reference points, not fresh support or resistance recommendations. The first buy was described at $4,132–$4,128. The second was proposed at $4,125.50–$4,122. The later buy used $4,116–$4,112, with reported targets extending to $4,124.
During the difficult second attempt, MO described a falling-wedge pattern and a support area. That was his interpretation at the time. It did not guarantee a reversal: he subsequently acknowledged a loss before trying another buy. The later rebound illustrates why a pattern and the risk attached to a particular attempt must be evaluated separately.
A useful next-session lesson is therefore procedural rather than predictive: decide what invalidates an idea before committing money, and do not assume a past zone remains reliable. A move back through a historical level is not automatically a new signal. This report supplies no current entry recommendation.
The October 5 daily report offers another recent comparison for readers learning to distinguish target progress from an overall account outcome.
Trading Signals#
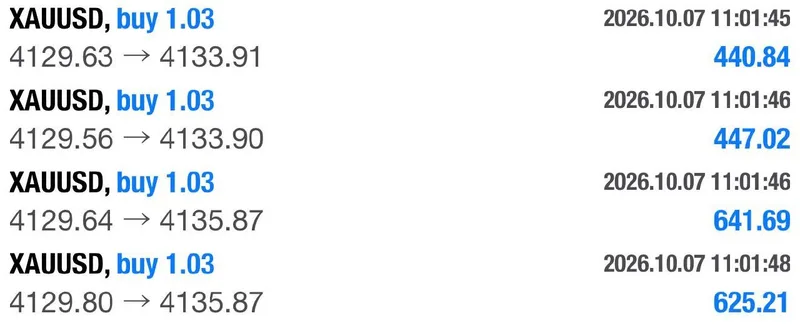
All times in the following sequence are UTC. Prices and updates are historical information from October 7, not live trading instructions.
First buy: two reported targets, then breakeven#
At 08:02, MO published a buy zone of $4,132–$4,128. The first target update at 08:04 was followed by a second target and protection update at 08:05. At 08:16, he reported that the remaining positions had reached breakeven; at 08:17, he summarized two targets and profits taken.
The selected trading-record screenshot shows buy records dated October 7 with two higher right-hand price clusters. Read together with the updates, it supports the described progression. It does not prove that every follower received identical fills, traded the same size, or earned the same amount.
Second buy: the loss remained part of the record#
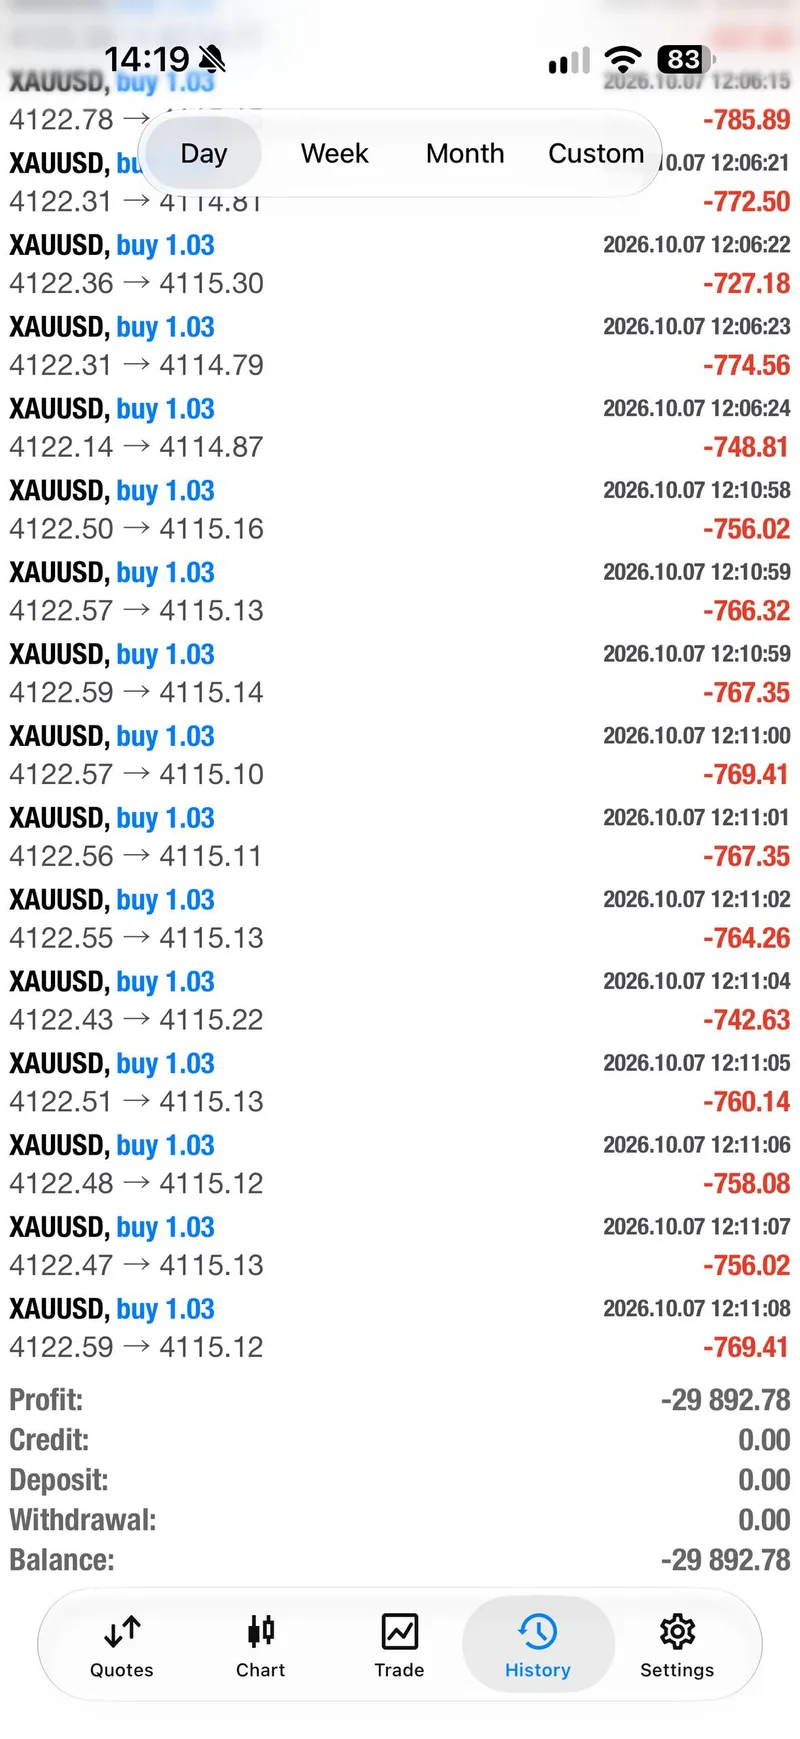
At 08:54, MO posted the $4,125.50–$4,122 buy zone with an initial loss limit at $4,118. He later moved that limit to $4,116 and then $4,114.50. Those changes allowed more adverse price movement; they should not be described simply as risk reduction.
At 10:18, he wrote that he had cut the loss. At 10:22, he explicitly said the loss had to be accepted. The accompanying history image contains negative results. Keeping that image beside the later rebound is essential: readers should see the setback rather than infer that three buy sequences meant three wins.
Third buy: four reported targets before the remaining positions stopped at breakeven#
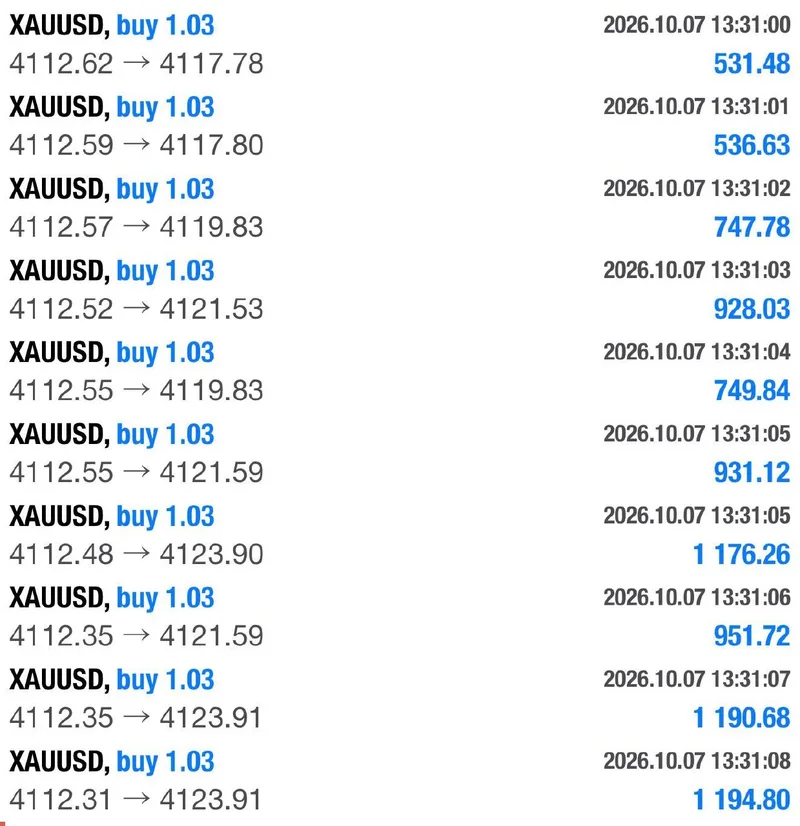
At 10:30, the renewed buy was published at $4,116–$4,112. MO reported the first target at 10:55, the second at 11:10, the third at 12:00 and the fourth at 12:04. At 12:27, he reported breakeven on the remaining positions. The 12:28 summary listed four targets.
The selected trade-record images illustrate that rebound. They do not provide a complete reconciled account statement for the day. In particular, a profitable later sequence is not enough to establish that all earlier losses were recovered.
Signal Performance Breakdown#
The defensible scorecard is three published buy sequences, one acknowledged losing attempt, and target progress reported on the first and third attempts. It is not a verified daily profit total, win-rate promise, or result shared by every member.
What members said after the first sequence#
Four member-feedback messages appeared in the day's public channel record. The two selected screenshots below show actual public posts; they are not generated testimonials.
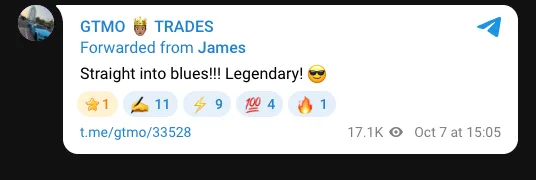
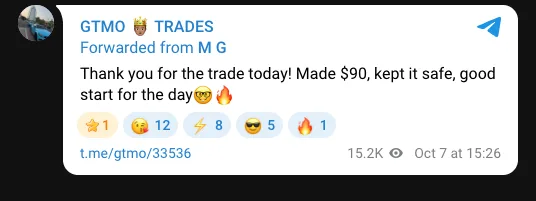
James wrote, “Straight into blues!!! Legendary!” after the first sequence's target updates. Another member, shown publicly as M G, wrote, “Thank you for the trade today! Made $90, kept it safe, good start for the day”.
The $90 figure is that member's self-report about the earlier trade. It is not independently verified, not a claim about all members, and not evidence of the member's final daily result. The two other feedback messages are part of the total response, but are not reproduced as additional screenshots here.
For a longer perspective on difficult sessions, see the October 2 report on transparent recovery. Each recap should stand on its own dated evidence.
Execution Lessons#
Taking some profit and protecting what remains are separate decisions. The first and third sequences both included target updates followed by breakeven messages. A stop at entry can reduce exposure on the remaining positions, but fees, spreads and slippage can still affect an actual result. “Breakeven” should not be interpreted as a universal zero-risk guarantee.
Moving a loss limit farther away increases the loss that may be tolerated. The second sequence makes this concrete. A trader needs a maximum acceptable loss before entering, not only confidence in the chart pattern. Following a public update does not remove the responsibility to assess one's own account and exposure.
A rebound does not erase the earlier loss. MO's willingness to acknowledge the difficult attempt gives readers something real to assess. The strongest trust signal is openness about what happened, not an unsupported assertion that the entire day ended green.
What The Day Means Going Forward#
October 7 is worth studying because the public record includes progress, pressure, a loss and a later rebound. MO kept communicating through the difficult middle. Readers can evaluate that transparency while also recognizing the risk involved in widening a loss limit and trying another trade.
The afternoon spot snapshot at $4,088 reinforces another caution: an earlier profitable move can reverse later. Do not treat an old target screenshot as a fresh reason to buy. Use dated recaps to learn how a sequence unfolded, and obtain any current update through the actual channel rather than extrapolating from this article.
FAQ#
Did MO finish October 7 with a verified net profit?#
This recap does not establish that. It documents two sequences with reported target progress and a separate acknowledged loss. The selected images are not a complete, reconciled daily account statement.
Was $4,088 the closing price of gold?#
No. It was the quoted spot observation at 9:00 a.m. Eastern Time on October 7, 2026. The session was still open when this report was prepared, so the closing-price field remains unavailable.
Does a breakeven update mean a trade is risk-free?#
No. It describes a protection update or reported exit around an entry price. Actual execution can differ because of spread, fees, slippage and timing, and it does not reverse a loss on another trade.
How can I follow the public record and ask about free access?#
Follow @GTMO for the public updates and message @GTMOBest for free signal-channel access and support. Past results are not a reason to assume the next signal will perform the same way.
Connect with Gold Trader Mo#
Explore Gold Trader Mo for dated reports that put public updates, risk decisions and selected evidence in one place. If you want to follow the channel rather than rely on isolated screenshots, message @GTMOBest for free signal-channel access.
Risk disclaimer: This article is educational commentary, not financial advice or a live trade recommendation. Trading involves risk; capital can be lost. Public screenshots and member feedback are not independently audited account results. Past performance does not guarantee future outcomes.