
October 5 was not a quiet gold session. The public @GTMO record opened with a BUY from the 4158.5-4154 zone, moved through five target stages, reset risk after target 3, and later reported a 100+ pips extension. The day then produced a second layer of evidence as members posted their own results. Readers who want free signals and FREE VIP channel access can message @GTMOBest while this recap keeps the session historical and verifiable.
The strongest point is the sequence, not a single loud screenshot. A target was reported, protection was updated, more profit was taken, and the public record stayed visible while the move developed. That gives October 5 a clearer editorial story than a generic claim that gold simply went up.
Market Snapshot#
Gold closed at 4,141.19 after trading between 4,125.22 and 4,170.27. That wide range matters because the trade record was built inside a fast, two-way market rather than an easy straight line. The dollar index closed at 102.3244, the US 10-year yield at 5.30%, VIX at 15.92, and the dated crude reference at 89.45. The Federal Reserve target range remained 3.75-4.00%. The crude number is an OTC/CFD reference shown for context, not an official NYMEX settlement.
| Metric | October 5, 2026 record |
|---|---|
| XAUUSD close | 4,141.19 |
| XAUUSD range | 4,125.22 to 4,170.27 |
| Dollar Index | 102.3244 |
| US 10-year yield | 5.30% |
| Crude reference | 89.45, OTC/CFD context |
| VIX | 15.92 |
| Fed target range | 3.75-4.00% |
Those numbers describe the backdrop, but they do not explain why this report is worth reading. The useful detail is what happened after the calls appeared: the public record documented target progression and risk reduction, while members posted feedback that can be checked separately from the signal sequence.
Why The Tone Changed So Fast#
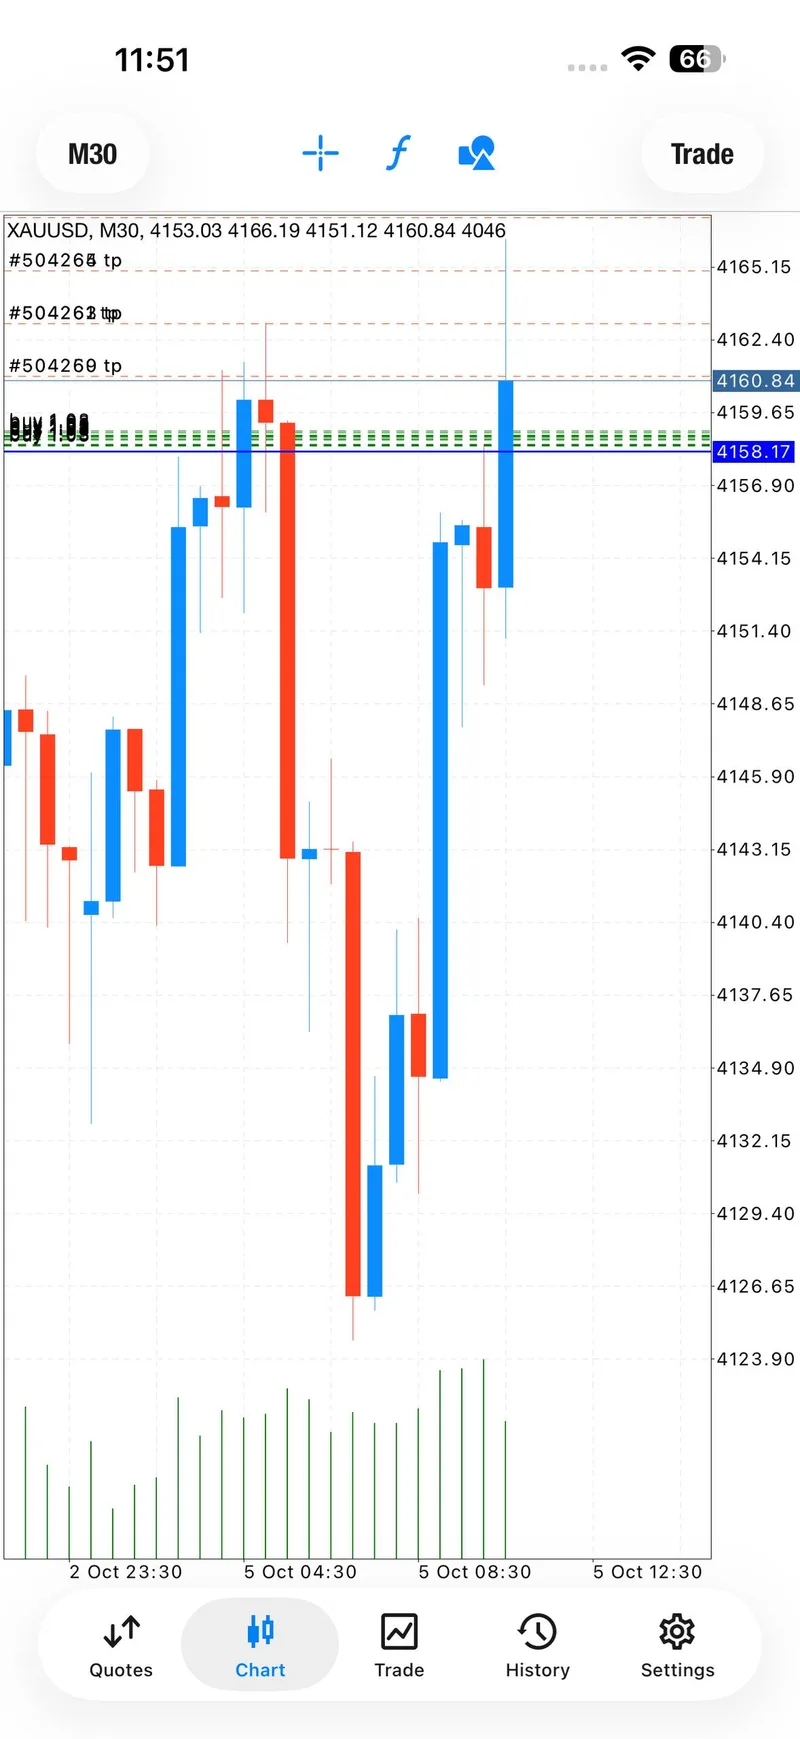
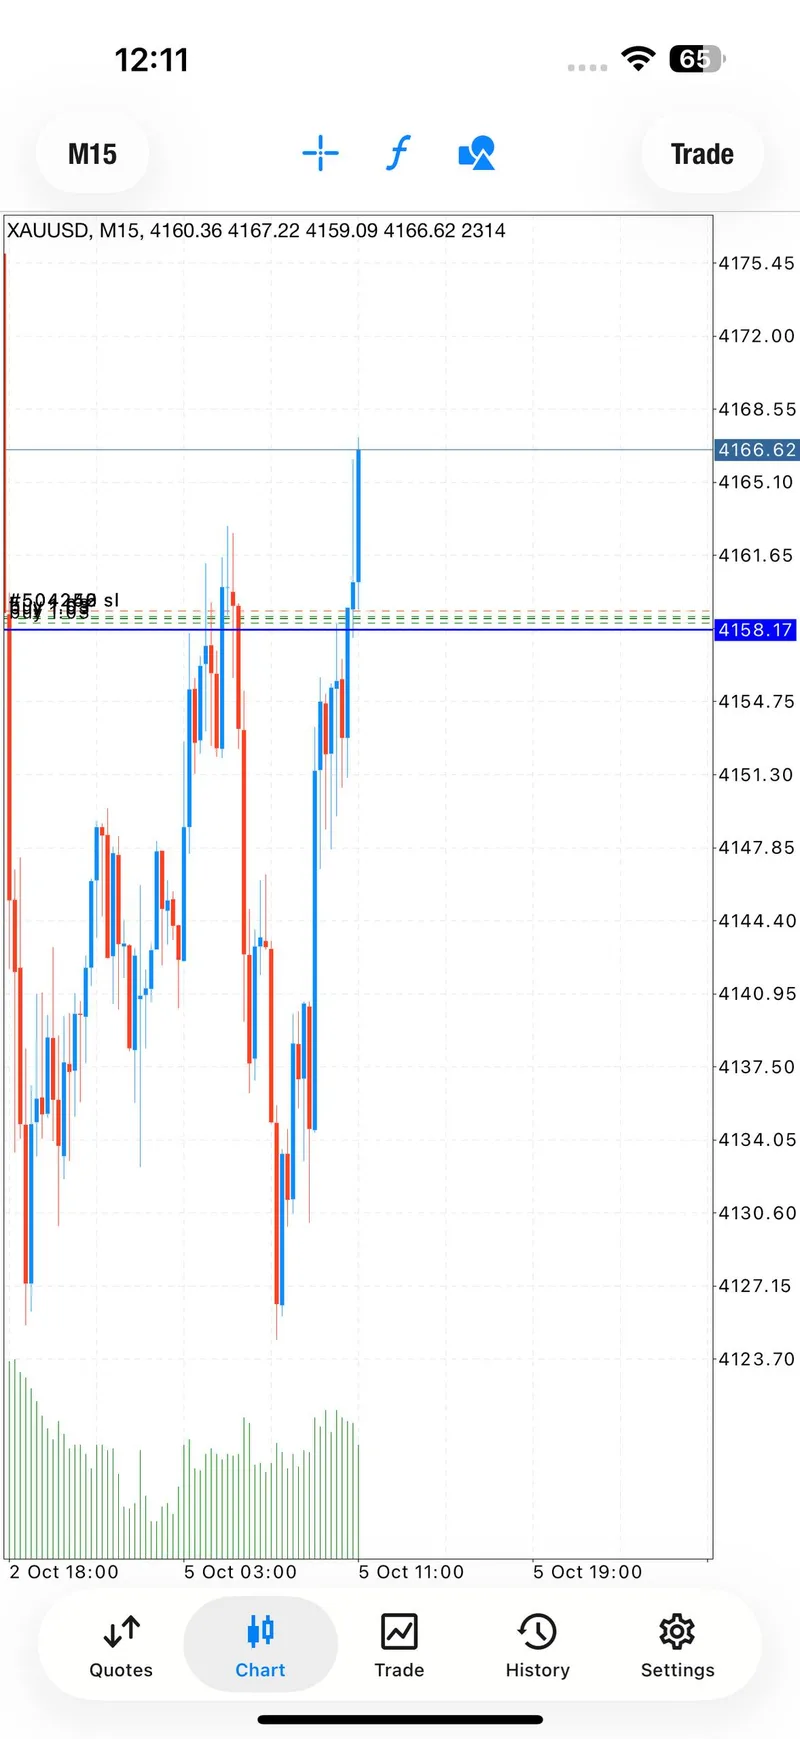
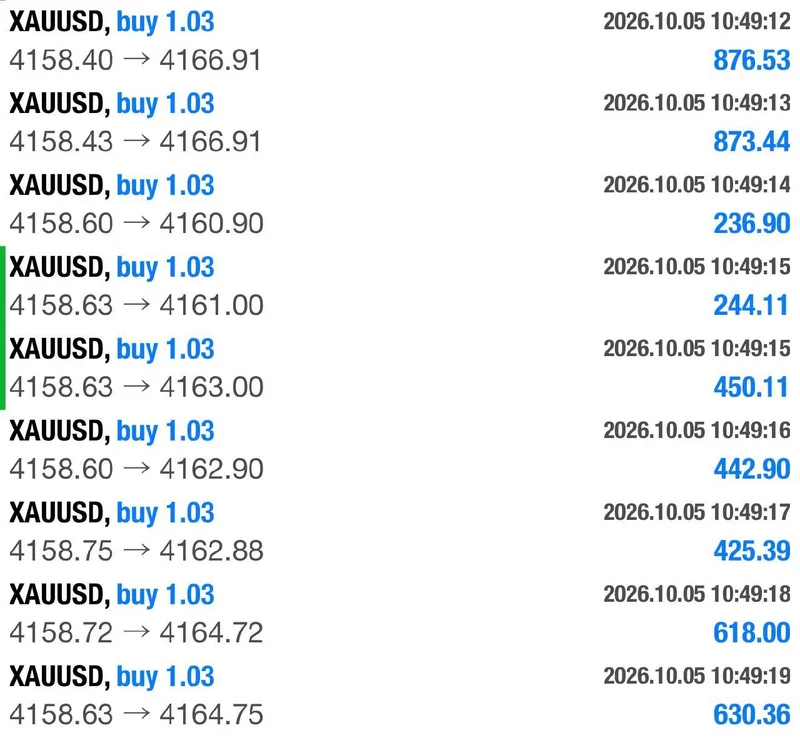
The tone changed because the first BUY was not treated as one all-or-nothing decision. The public call placed the entry zone at 4158.5-4154 with a 4150 stop and targets at 4161, 4163, 4165, 4167, then open. Within minutes, the record showed target 1 and target 2, followed by target 3 and a message to move risk to breakeven. Target 4 followed, and the next update described target 5 as open with 100+ pips completed. Two more entries were closed while two runners remained.
That progression changes the emotional tone of a volatile session. The first part of a move can be about proving direction. The later part is about not giving back everything just because the chart still has room. October 5 showed both decisions in public. It is also why the report leads with the execution record instead of opening with a long macro paragraph.
The day also included a period where a later BUY was still floating. The public updates discussed the bottom of the zone, adjusted the stop from 4153 to 4151, and waited for the structure to turn in favor of the trade. That is a less polished moment than a final winning screenshot, but it is important evidence of how risk was handled while the result was not yet certain.
Technical Outlook#
The historical range from 4,125.22 to 4,170.27 gives the session a simple map. The low shows where the day found pressure and the high shows where buyers met a stronger test. The 4,141.19 close finished much nearer the lower half of that range than the public BUY entries around 4,154 to 4,161, which is a reminder that a signal result and a market close are different facts.
The dollar and yield readings add context without pretending to be a complete causal explanation. A 102.3244 Dollar Index close and a 5.30% 10-year yield describe a firmer-rate backdrop, while VIX at 15.92 shows that the broader volatility gauge was not in panic territory. The trading record still needed its own risk decisions. Readers should treat these levels as a past-session map, not as a live instruction to enter a trade now.
For a useful comparison, the October 2 transparent recovery recap shows a session where recovery management was the main story. October 5 was different: continuation and staged protection were more important than repairing a failed first idea. That contrast helps readers understand why the same trading process can produce different daily narratives.
Trading Signals#
Signal 1: the five-stage BUY#
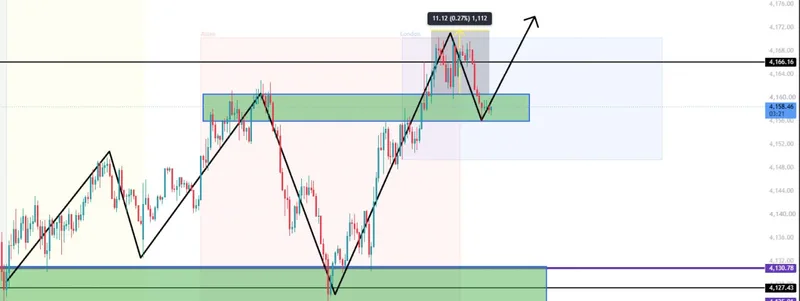
The first detailed BUY was shared on the FREE record and mirrored in the VIP record. The stated zone was 4158.5-4154, the stop was 4150, and the planned levels were 4161, 4163, 4165, 4167 and open. The public follow-up then recorded target 1, target 2, target 3, a breakeven reset, target 4 and the 100+ pips extension. The note that two entries were closed while two runners remained makes the exit process more specific than a simple win label.
Signal 2: a short-form BUY call#
A second BUY call appeared later in the VIP record without a full set of public parameters in the short-form post. It is included so the recap does not hide a same-day call, but it is not used as the headline claim. The honest reading is that this call supports the active-session context while the stronger five-stage evidence belongs to the first sequence.
Signal 3: the protected structure test#
The third BUY was shared from 4161.2-4157 with a 4153 stop and targets at 4164, 4166, 4168, 4170 and open. The risk note then moved the stop to 4151 because the zone was wider at its lower edge. Updates described a bullish breakout, entries near the bottom of the zone and a turn back into profit before the public take-profit message. The sequence is useful because the trade did not begin with a perfect result. It began with a structure test and a stated risk adjustment.
Signal 4: the repeat protected BUY#
The fourth BUY was recorded at 4160-4156 with a 4152 stop and targets at 4162, 4164, 4166, 4168 and open. The public record moved from immediate profit to target 1, then to a zero-risk and breakeven update, target 3, and an all-positions-out note. Later, the first BUY was described as having completed all five targets and 100+ pips, while another BUY was described as having one target and breakeven. The two notes should remain separate; neither requires the reader to pretend every position had the same exit.
Signal Performance Breakdown#
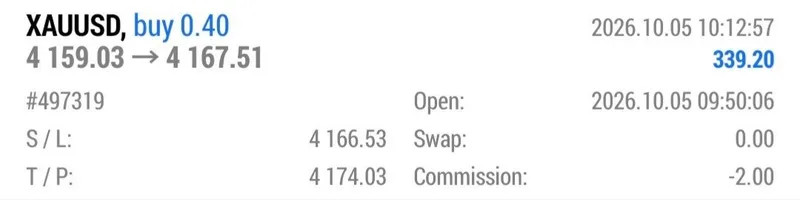
The session produced four documented BUY call records, but the strongest proof is concentrated in the first and fourth sequences. The first sequence has the clearest target-by-target progression. The fourth repeats the protection pattern and adds a later five-target completion note. The third sequence contributes a more realistic floating-risk moment and a visible stop adjustment. The second call remains supporting context because its public detail is thinner.
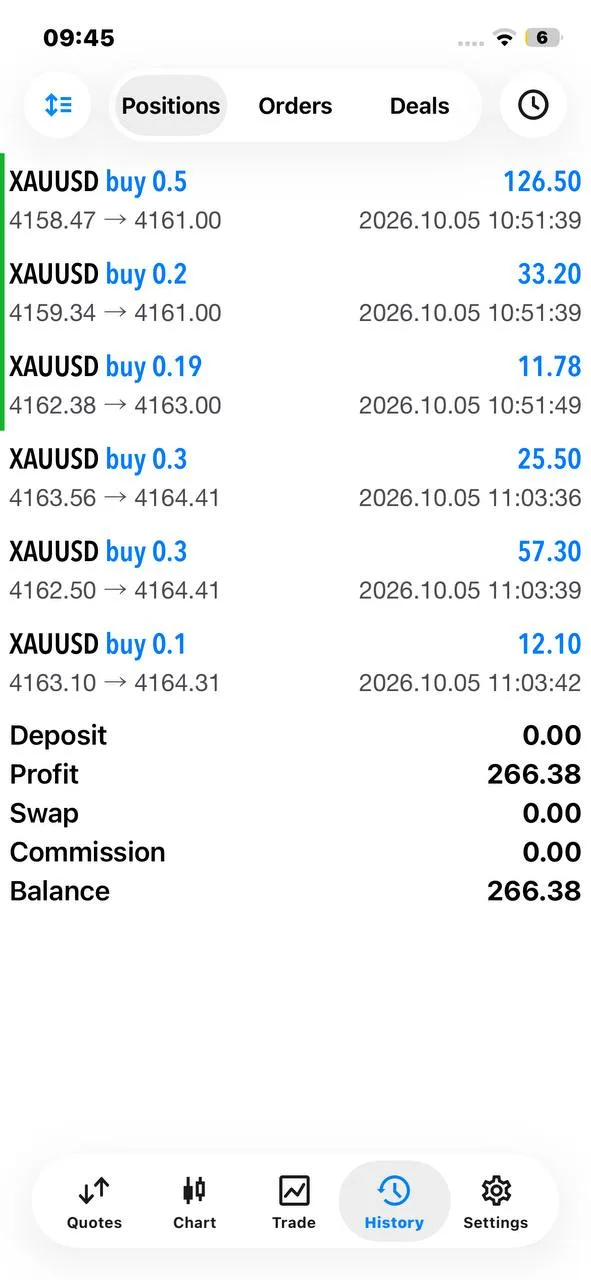
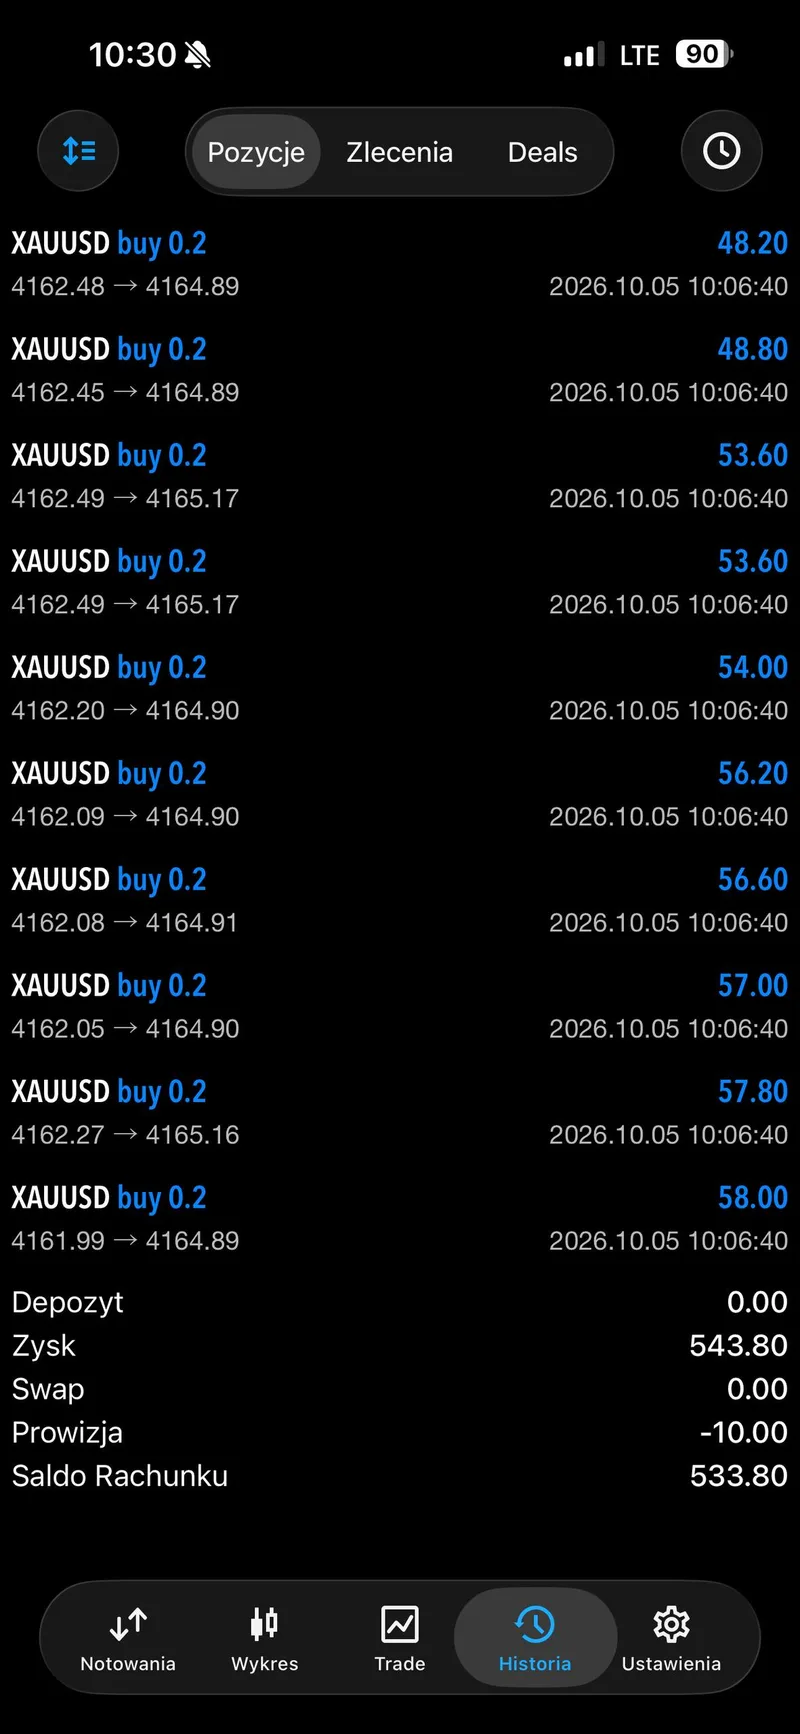
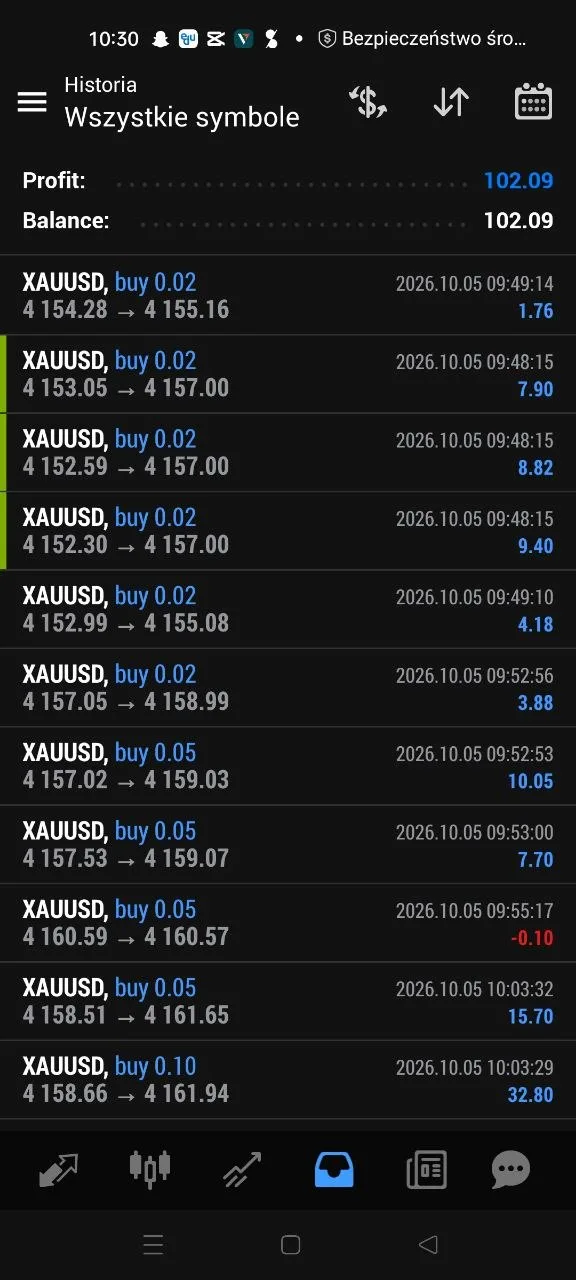
The public record contained 21 member feedback messages. This recap shows 4 selected public proof screenshots, so the total response count is not being confused with the number of images in the gallery. The distinction matters because the messages include different outcomes and exit choices rather than one centrally produced result.
What members actually reported#
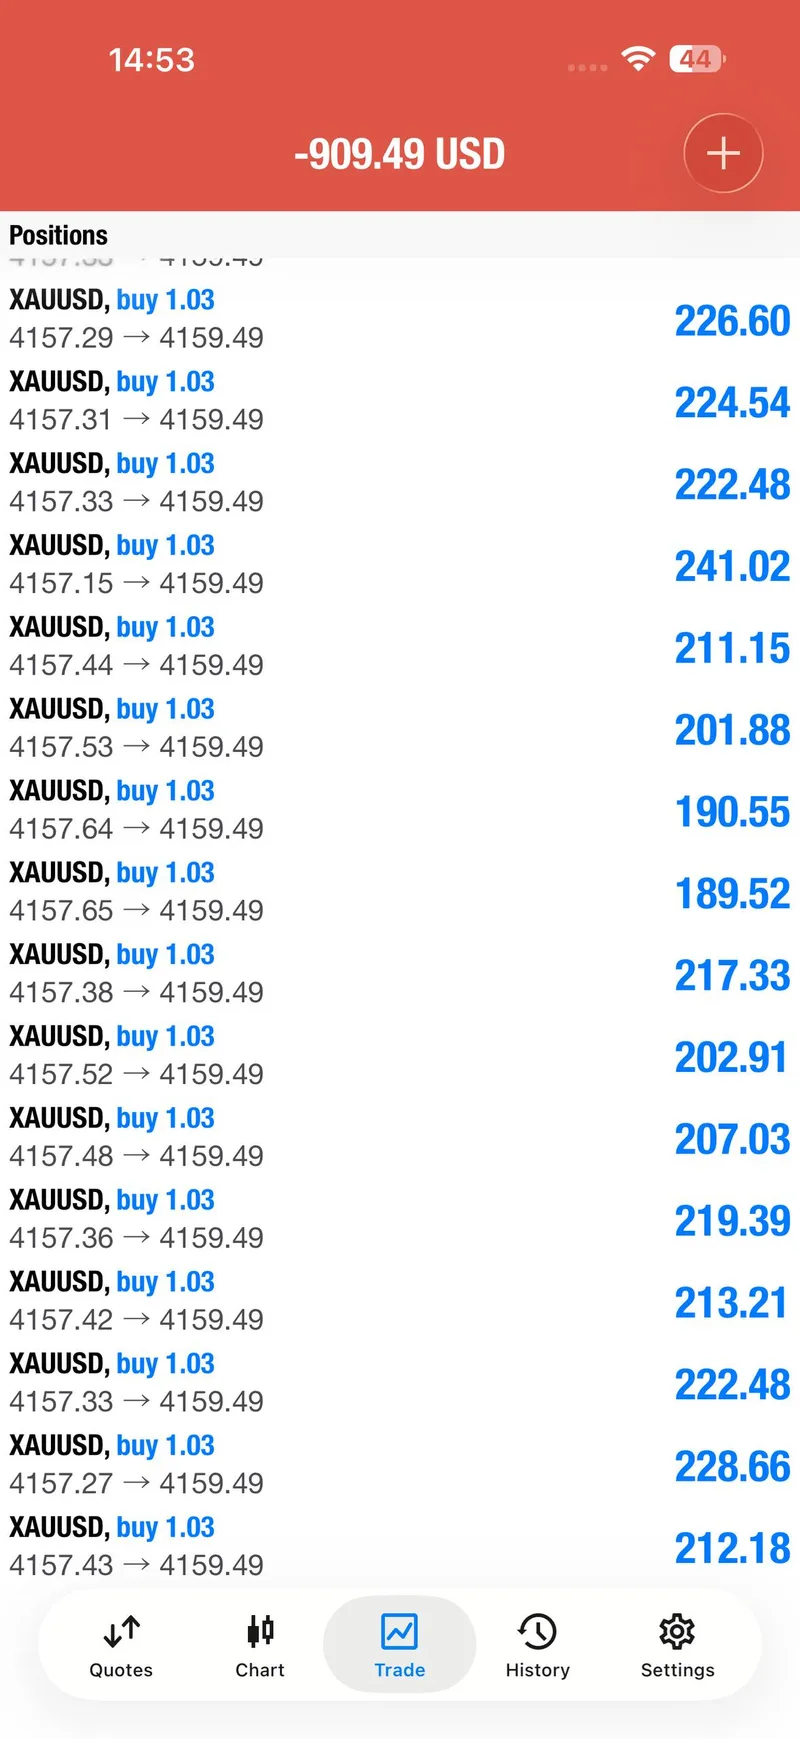
M G wrote that they made $150 that day. Taher H said that a $100 result could have been $200 without an early close. Marc posted a 100 euro result and said one trade was still open. Nils said they closed at target 3 and reported 8% profit. Przemek posted $540, while Mihaela posted $256, Niraz posted $339, and Rdubs posted £151. Annie TAT -CAFE posted that she made 260$ and closed at target 3, with a matching public screenshot.
These are member messages, not a promise about what every reader will earn. They are useful because they show the range of real-time reactions around the same public sequence. Some members closed earlier, some left a runner, and some shared a dollar result without giving a full account history. The selected screenshots keep the visual proof readable while the full 21-message count stays explicit.
The September 30 risk-reset report offers another example of why protection deserves its own section. It shows how a past report can discuss a risk reset without turning that historical discussion into a live call.
Execution Lessons#
The first lesson is to separate direction from trade management. A BUY can be directionally correct and still need a stop adjustment, a partial close or an early exit. October 5 documented all three ideas. That is more useful than claiming that a single entry predicted the entire daily close.
The second lesson is that staged exits change the decision burden. Once target 1 and target 2 were recorded, the next question was no longer whether the original idea had any merit. It was whether the remaining exposure could be managed without turning a winning sequence into an emotional chase. The breakeven note after target 3 showed the risk-reset logic in plain language.
The third lesson is transparency when a later setup is still floating. The third BUY did not skip the uncomfortable update. It described where entries were being placed, how the stop changed, and when the chart turned back toward profit. That kind of sequence lets a reader evaluate process rather than only seeing the final green screenshot.
The September 29 discipline-first recap is a helpful counterpoint because it shows the value of stopping when the tape no longer supports the idea. A credible daily record must be able to hold both kinds of session: continuation days like October 5 and defensive days where forcing another trade would be the mistake.
What The Day Means Going Forward#
October 5 matters because it combines a clean headline story with enough nuance to resist hindsight. The headline is a five-stage BUY that reached 100+ pips in the public record. The nuance is that not every call had the same evidence, not every member exited the same way, and the XAUUSD close finished below the signal zones later in the session.
For readers, the useful habit is to ask three questions after any daily recap: what was visible before the move, where was risk reduced, and which result claims can be tied to a dated public update? Those questions are more durable than copying an old entry zone into a new session.
The next report should be judged on the same basis. A stronger dollar, a high-yield backdrop or a wide gold range can change the environment, but a trustworthy signal service still has to show its call, its protection decisions and its follow-through. That is the standard this recap sets for the next public @GTMO update.
FAQ#
Was October 5 a live signal or a historical recap?#
This page is a historical recap of the October 5 public record. The BUY zones, stops and target stages are included to explain what was shared that day. They are not current instructions to enter XAUUSD.
How many member responses were counted?#
The same-day public record contained 21 member feedback messages. Four selected public proof screenshots are shown in the gallery. The total message count and the curated image count are intentionally kept separate.
Did every member report the same result?#
No. The messages included $150, $540, 260$, 339$, £151, a 100 euro result and an 8% profit note, among other responses. Different position sizes, exit timing and account conditions mean those reports should not be treated as a universal outcome.
Where can I follow the next public update?#
Readers can follow the free public updates and message @GTMOBest to ask about free signals and FREE VIP channel access.
Connect with Gold Trader Mo#
Follow Gold Trader Mo for the growing daily archive, including transparent recovery notes, staged target recaps and risk-reset explanations. The free public lane gives readers a way to see the record before deciding whether to ask about wider access.
For free signals and FREE VIP channel access, message @GTMOBest. The call to action is deliberately simple: read the public record, ask questions, and keep the historical context attached to every result.
This report is for education and commentary only, not financial advice. Trading involves risk, capital can be lost, results may vary, and past performance does not guarantee future results.