
Market Snapshot#
September 29 was a session to document honestly, not polish into a victory story. At 21:10 GMT+7 the New York session was still active, so this report uses an open-intraday snapshot and does not pretend that a final close was available. The current XAUUSD feeds ranged from 4,155.50 to 4,166.52 USD/oz, with a best-supported intraday high near 4,167.49 and a low range near 4,110.55–4,113.94. Feed disagreement remained material: Kitco and RoboForex were lower, while the Trading Economics CFD composite was higher.
That uncertainty is part of the evidence boundary. DXY was observed around 101.35, US10Y around 5.21–5.23%, WTI around 91.58–92.58, and VIX around 15.67. The Fed target range was 3.75–4.00%. Higher yields and higher-for-longer expectations kept a lid on non-yielding gold, while partial cooling in the US-Iran and oil headlines helped the late rebound. PCE and NFP remained future risk events, not explanations to backfill into a trade that had already happened.
If you want free signals and FREE channel access, message @GTMOBest. This article is a historical XAUUSD recap of the public @GTMO record, not a live instruction.
Why The Tone Changed So Fast#
The tone changed because the first sell sequence did not receive the clean continuation that the chart setup expected. The public record moved from a sell call, to risk adjustments, to a failed setup, and then to an attempt to find a better recovery structure. That sequence is more useful than a single screenshot because it shows how the decision changed as the market invalidated the idea.
The macro backdrop amplified that shift. A firm dollar and elevated Treasury yield made downside pressure plausible, but the feed conflict and the rebound into resistance meant that a directional view could not be treated as certainty. The session therefore became a test of whether the desk would acknowledge a broken setup quickly enough to avoid compounding it.
For continuity, compare this report with the September 28 daily recap, where the public story was a cleaner sell progression. The contrast matters: a historical report should show when the same market can reward continuation on one day and punish overconfidence on the next.
Technical Outlook#
The open-intraday technical map kept 4,180.40 as the nearby resistance reference, with 4,110 and then 4,050 as support references. Those levels are context, not promises. Because the session had not closed, the report does not convert them into a next-trade plan.
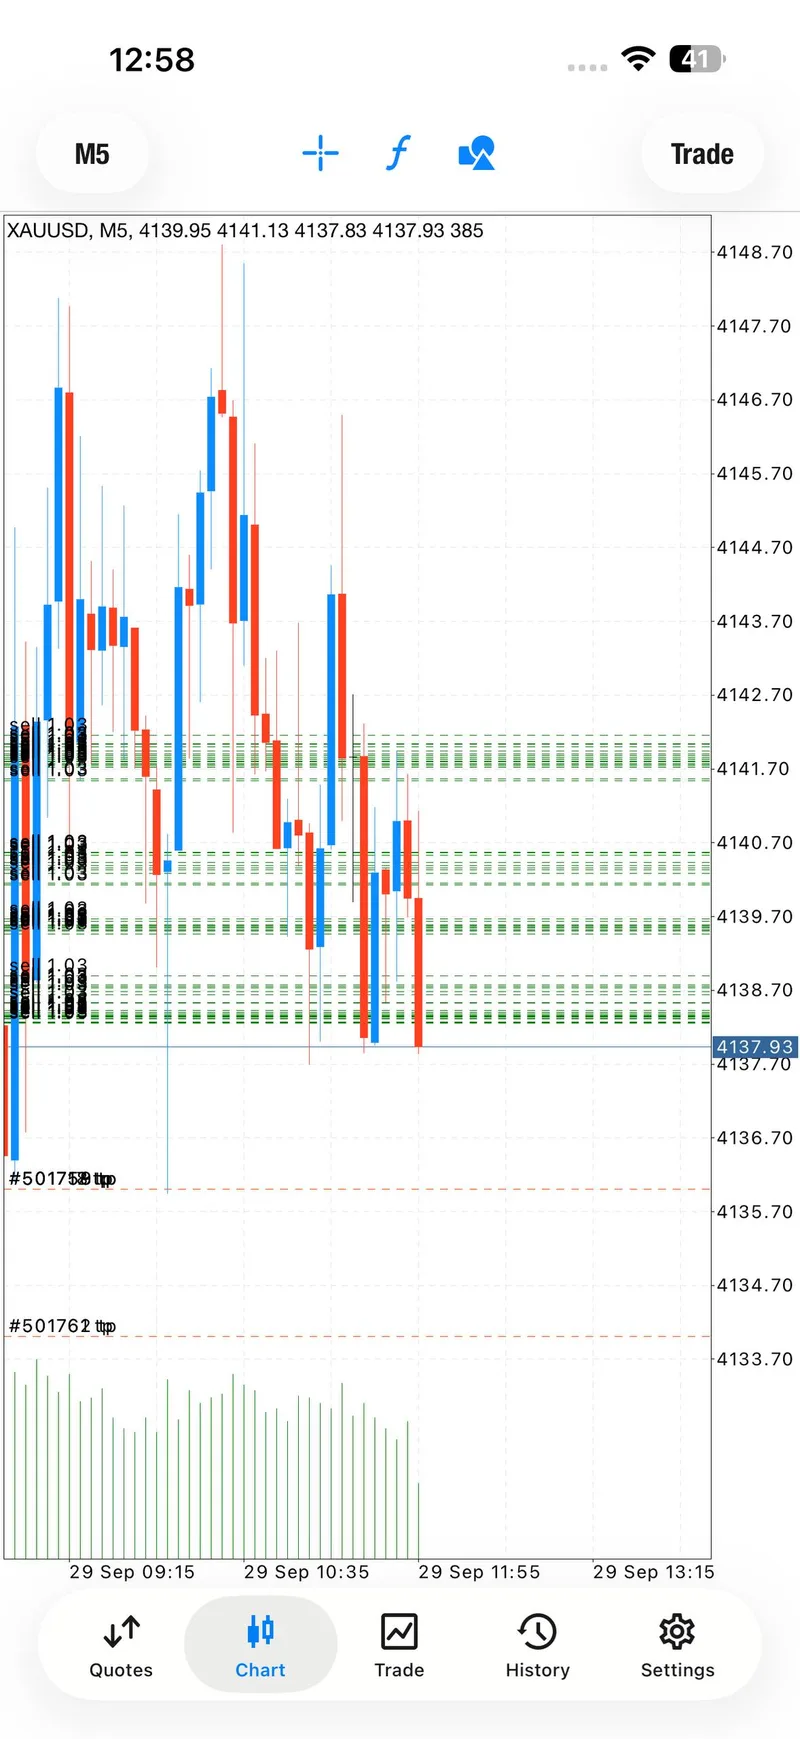
The public chart screenshots show why the first setup looked attractive and why it later became fragile. A double-top area formed near resistance, but the retracement was stronger than the initial continuation. The second attempt was framed around that structure, yet the market still did not deliver a day that could be called a win. The correct editorial conclusion is that the map helped define risk, not that it guaranteed the outcome.
That distinction is also visible in the September 25 daily report and the September 21–25 weekly summary. Those archive pieces provide context without changing what September 29 actually proved.
Trading Signals#
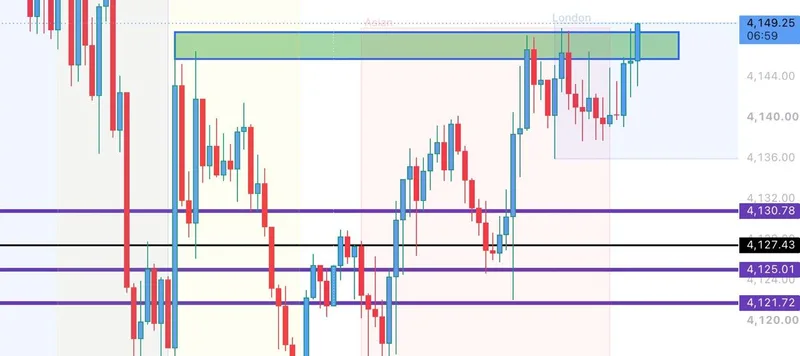
The first public SELL sequence#
The first dated sequence was a SELL in the 4138.6–4142 zone. The original public plan named 4147 as the protective level and listed a descending target ladder from 4136 through 4128, with an open extension. That is historical evidence of what was written, not a recommendation to reuse those numbers.
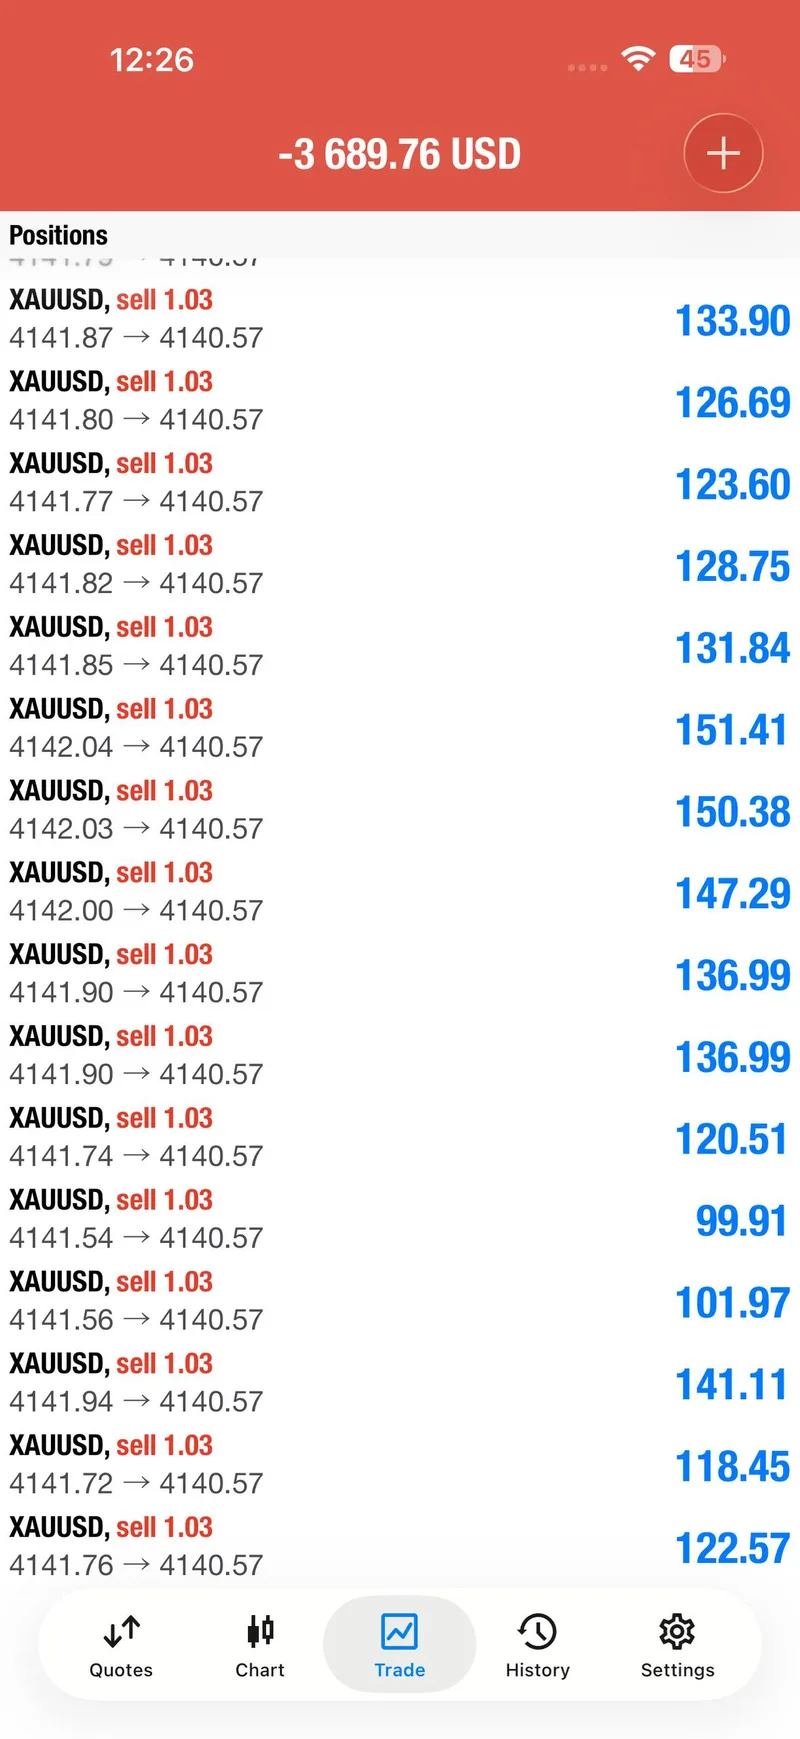
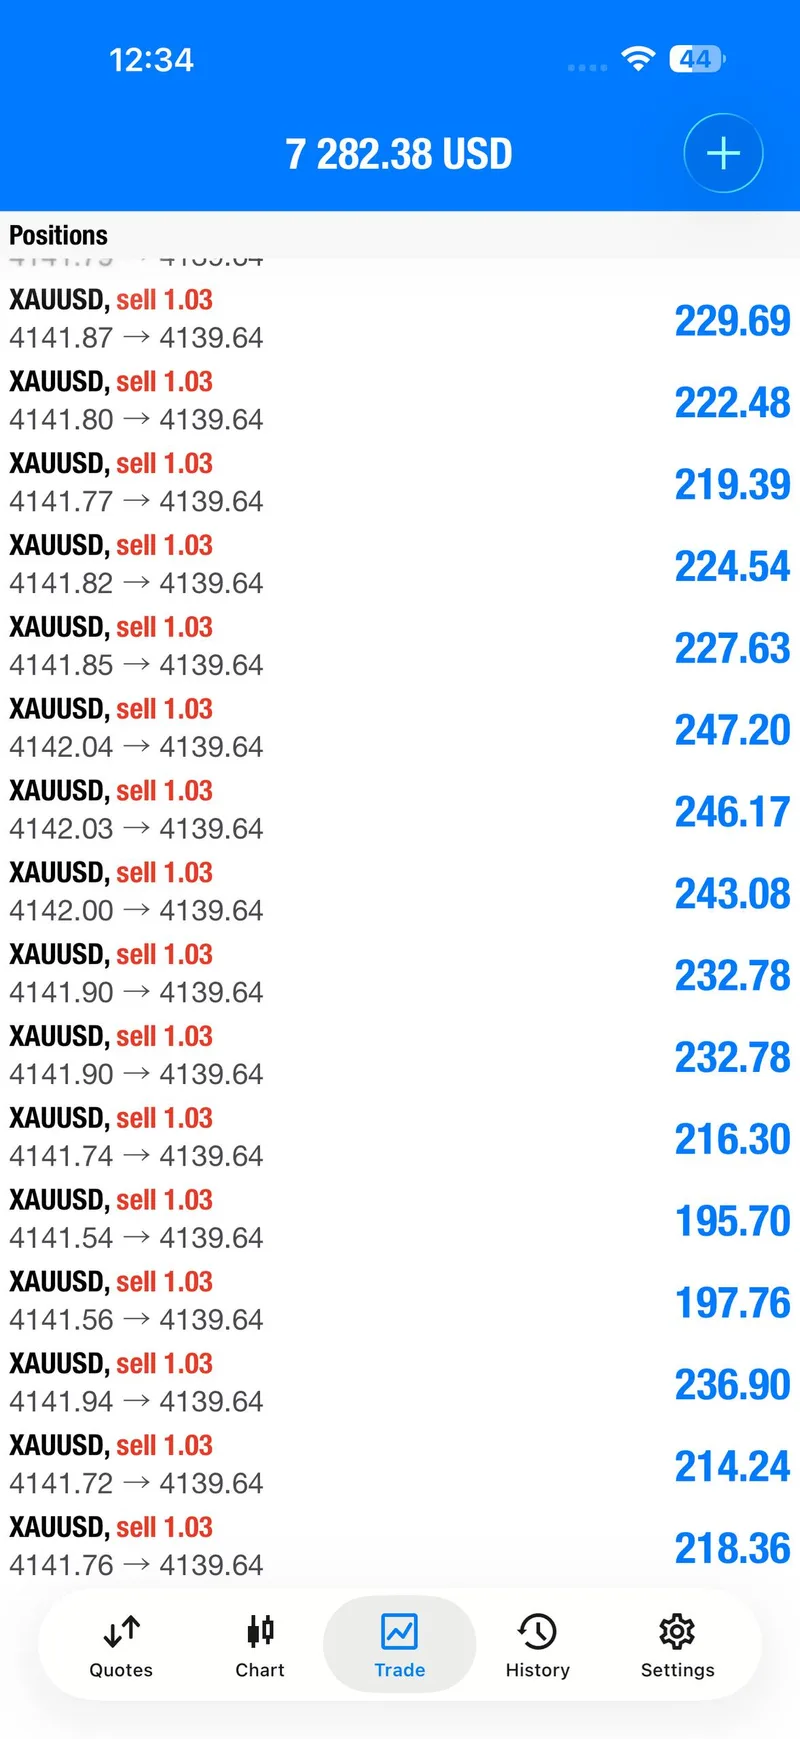
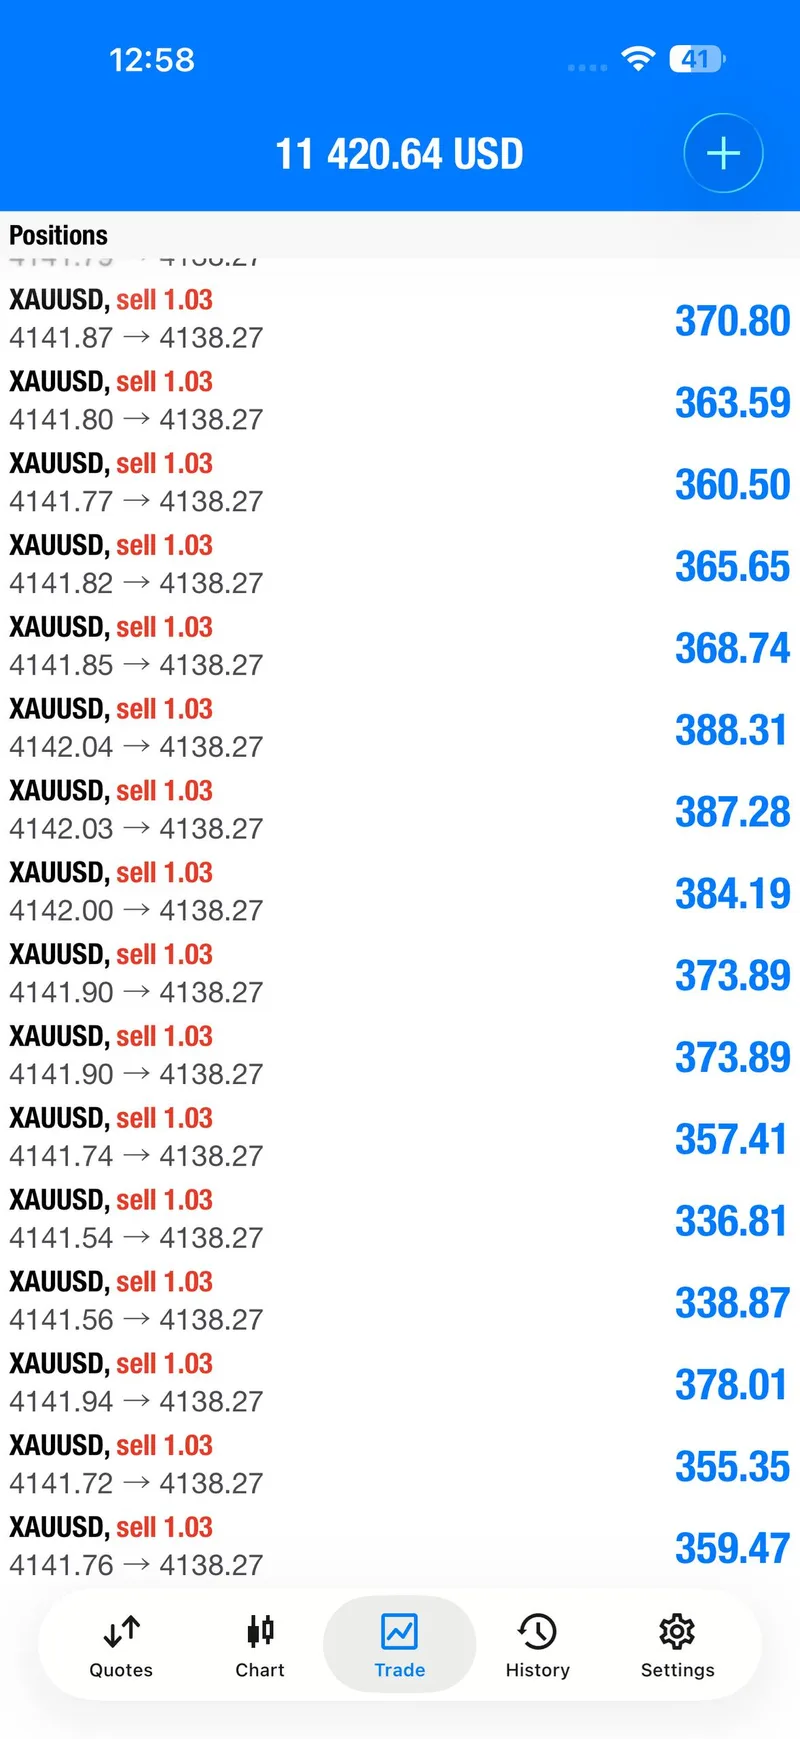
As price moved sideways and retested the zone, the public record showed a protective adjustment to 4149.4. The account screenshots captured brief moments where individual XAUUSD positions displayed positive blue figures, but they did not prove a completed profitable day. They are useful as time-stamped trade-state evidence, not as a substitute for the later outcome statement.
The setup failed and the record said so#
The turning point came when the public channel stated that the trade setup had failed and that holding longer was not worth the risk. The same update described a double top at resistance and a search for a recovery setup. This is the strongest same-day claim: the loss was acknowledged in public language rather than hidden behind an attractive chart crop.
The second public SELL sequence#
The second dated sequence was a SELL in the 4148.4–4152.4 zone, with 4157 named as the initial protective level and a ladder from 4146 through 4138. The last public adjustment moved that risk reference to 4159.3. The presence of a second attempt does not turn the day into a recovery win. It shows that a new structure was tested after the first idea failed, then measured against the same discipline standard.
The public record eventually said, in plain terms, that this was a losing day and that the trade had been cut rather than forced. That sentence is more important than any isolated account number in the screenshots. It closes the loop between signal, invalidation, and decision.
Signal Performance Breakdown#
This was a LOSS_DAY, not a hidden win. There were two fully parameterized SELL sequences in the public record, plus the earlier and later status messages that explain how each idea was managed. The first sequence was stopped after the retracement invalidated the thesis. The second sequence also failed to produce a defensible positive day, and the desk stopped instead of adding a third forced attempt.
The evidence counts need to stay precise. One member feedback message was present in the same-day record, and the clearest member response was a short public encouragement: “Here we go!!!!!!!” No member screenshot was selected for the article. Five signal screenshots were selected instead: three account-state moments and two chart views. The account images show positions and momentary displayed figures; they do not establish a net session result. The chart images show the sell structure and resistance context; they do not establish execution quality on their own.
That separation prevents a common reporting error: treating a selected screenshot count as the total amount of feedback, or treating a momentary blue number as the final ledger. The day’s strongest proof is the combination of visible setup details, public risk changes, and the final admission that the session closed as a loss.
Execution Lessons#
The first lesson is that a planned zone and target ladder do not remove the need to exit when the structure breaks. The public adjustment to 4149.4 documented an attempt to give the trade room, but the later cut-loss message showed where the thesis ended. A disciplined loss is not the same thing as a failed process.
The second lesson is that recovery must have a boundary. The second SELL around 4148.4–4152.4 was a fresh setup with its own risk reference, not permission to chase the first loss. When that attempt also failed, the decision to accept the day protected the next session from emotional overtrading.
The third lesson is evidence hygiene. A screenshot can show a moment; it cannot speak for the whole day. A target label can show intention; it cannot prove that every target filled. A member comment can show engagement; it cannot be inflated into a crowd consensus. Good historical reporting keeps those claims separate.
What The Day Means Going Forward#
The value of September 29 is its transparency. It shows a public trading desk moving from confidence, to adjustment, to recognition that the setup was wrong, and finally to a decision not to force a recovery. That is a more durable lesson than a headline built around the largest blue number in a mobile screenshot.
For readers, the useful question is not whether the next session will copy these levels. It is whether the next recap will still state the invalidation clearly when the market disagrees. The open-intraday market packet also reinforces that point: unresolved feed differences mean that a current snapshot must not be presented as a settled close.
The archive gives readers a way to compare outcomes across conditions. Read the September 28 report for a cleaner progression, then return to this loss-day recap to see why the same discipline standard matters when the result is uncomfortable.
FAQ#
Was September 29 a profitable day?#
No. The strongest same-day public outcome statement classified it as a losing day and said the trade was cut rather than forced. The screenshots show intermediate trade states, not a verified net profit.
How many member feedback messages were counted?#
One member feedback message was present in the day’s public record. No member screenshot was selected, so the five gallery items are signal and chart evidence rather than a claim that five members responded.
Why does the market table avoid a final close?#
The observation was made while the New York session was still active, and Google AI Mode surfaced conflicting live feeds. The report therefore labels current values as an open-intraday snapshot and leaves the final close unresolved.
Connect with Gold Trader Mo#
For the next historical recap and free signal updates, follow Gold Trader Mo and message @GTMOBest. The free channel is the place to ask for context and FREE channel access without turning a past-session report into a live call.
The day’s core message is simple: manage the idea, admit when it fails, and stop before a loss becomes a pattern. If you want free signals and FREE channel access, message @GTMOBest.
This is a historical recap for education and commentary only, not financial advice. XAUUSD is volatile, capital can be lost, and past performance does not guarantee future results.