
Weekly Market Overview#
Gold did not offer a comfortable one-way week from September 21 to 25. It moved from a fast sell on Monday, into a yield-sensitive Tuesday, through a sharp midweek reversal, another clean sell on Thursday, and finally a pressured buy recovery on Friday. The useful story is not that every call was easy. It is that MO kept changing the decision when the market changed, cut exposure when the tape became uncomfortable, and preserved enough clarity to finish the week with the strongest public session label on Friday.
That is what experienced trading looks like under pressure: protect first, adapt second, and only press when the market earns it. If you want to follow the free lane and ask about free VIP access, message @GTMOBest. The archive below shows the process before the invitation: defined zones, visible protection decisions, recovery sequences, and proof that remains attached to the session where it appeared.
The Week in One View#
| Weekly record | What the evidence supports |
|---|---|
| Active execution days | Four published execution recaps, plus one market-context day |
| Documented trade plans | Five: one Monday sell, two Wednesday plans, one Thursday sell, one Friday buy |
| Strongest public session label | $23,000+ on Friday, kept separate from the $23,561.25 account-history screenshot |
| Selected weekly proof | Four trade images and two community images |
| Market reference | $4,369.98 spot reference on Tuesday to $4,286.20 on Friday, an approximate $83.78 decline; feeds differed |
| Desk lesson | Protection made the reversals survivable and the recoveries usable |
The market comparison needs context. Monday and Wednesday did not have comparable final-close fields in the research snapshots, so this recap does not invent a Monday-to-Friday percentage. The available spot references moved from about $4,369.98 on Tuesday to about $4,286.20 on Friday. Both records note feed differences, which makes the direction useful but the last decimal less important than the week’s repeated pressure-and-recovery structure.
What Changed Underneath Gold#
The macro pressure was consistent even when the intraday direction was not. Early in the week, gold was caught between a firm dollar, Treasury yields near 5%, softer oil, and persistent geopolitical support. By Tuesday, the spot reference was near $4,369.98 while the dollar index was around 100.60 and the 10-year yield near 4.96%. The market could still hold above the 4,300 area, but the cost of carrying a non-yielding asset remained visible.
The balance weakened later in the week. Wednesday’s New York snapshot placed gold near 4,313 while the dollar and yields stayed firm. On Thursday, the dollar moved above 101 and the 10-year yield rose toward 5.11%, helping drive a sharp move lower. Friday’s spot reference recovered to about $4,286.20 after trading in an approximate $4,255.00-$4,315.73 range, but the 10-year yield was still near 5.17%. In plain language: gold could rebound, yet every rebound still had to fight expensive money and a strong dollar.
That environment punished fixed opinions. A trader who decided on Monday that the whole week must stay bearish would have struggled with Wednesday’s buy phase and Friday’s recovery. A trader who treated Friday’s rebound as proof that pressure had vanished would have ignored the same yield backdrop that created the week’s instability. MO’s edge was not pretending to know one direction for five days. It was keeping each plan local to the tape in front of the desk.
Where MO’s Experience Showed#
Monday: define the sell, then remove the danger#
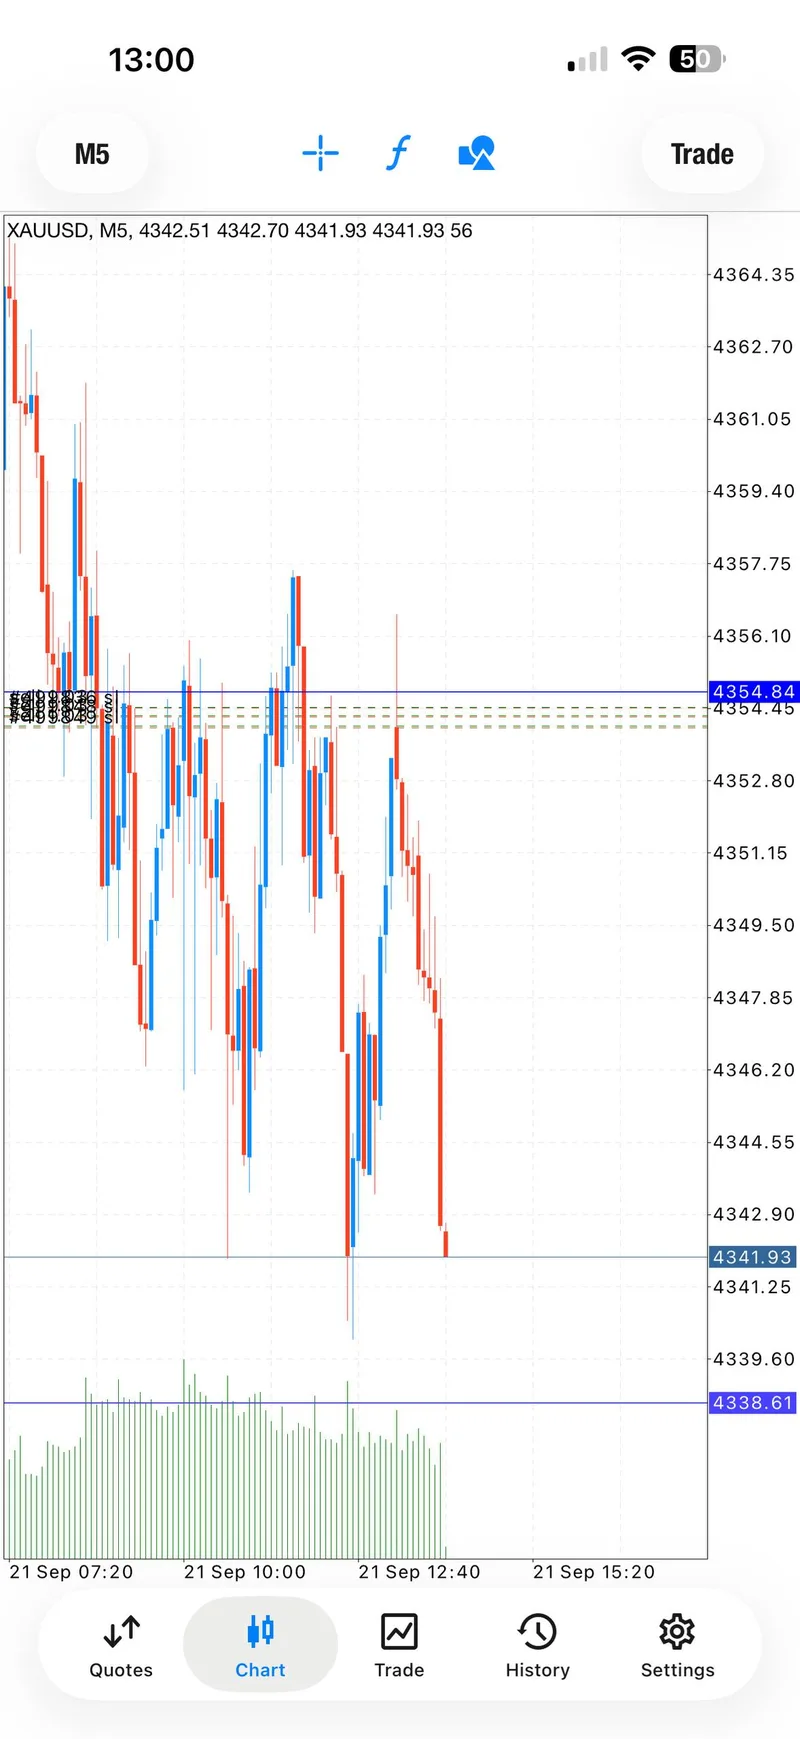
Monday’s $10K protected recap began with one parameterized sell plan around 4354.4-4358, a visible invalidation at 4362, and five planned checkpoints below. The key professional decision came after price moved: profits were taken and the remaining exposure was moved to a protected state. The public channel later reported $10,000 closed safe and five completed target milestones.
The amount is a bounded same-day channel claim, not a promise. What matters for the weekly lesson is the order: plan, progress, protection, then close. MO did not wait for the final target before reducing risk. That decision mattered because the rest of the week became far less forgiving.
Tuesday: market context, not a manufactured victory#
Tuesday had a complete market packet but no published daily execution article and no usable trade-gallery proof. This recap therefore treats September 22 as a market-context day, not as two extra public wins. Gold held above 4,300 while a firmer dollar and higher yields limited the upside. Leaving the day out of the performance count is part of the proof standard: an active calendar date is not automatically a documented trading result.
Wednesday: accept the cut, rebuild the plan#
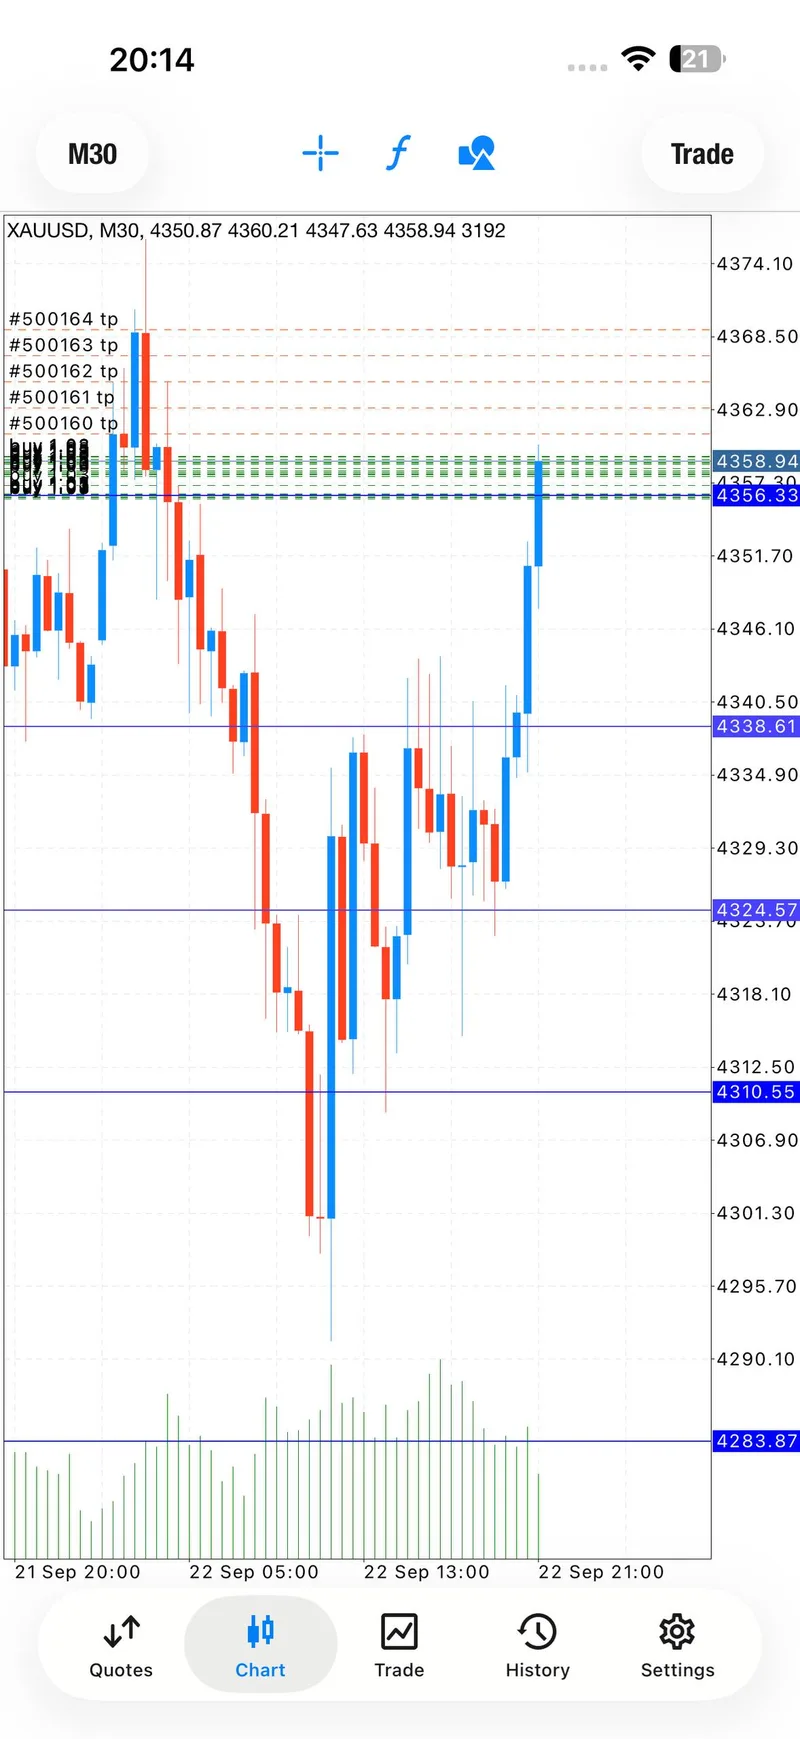
Wednesday’s Flight-Mode Recovery is the clearest example of adaptation. The published recap documents a buy plan and a later sell/re-entry plan. The first idea did not become a clean uninterrupted victory; the record includes a transparent cut-loss before the desk rebuilt around the new direction. Later, the public channel reported $15,000 closed, with one account-history image attached to that session.
That is a more valuable story than hiding the difficult middle. The week could only recover because the desk allowed the original idea to stop owning the next decision. MO protected the account, re-read the tape, and moved from being right about a direction to being responsible for the risk.
Thursday: one sell, five checkpoints#
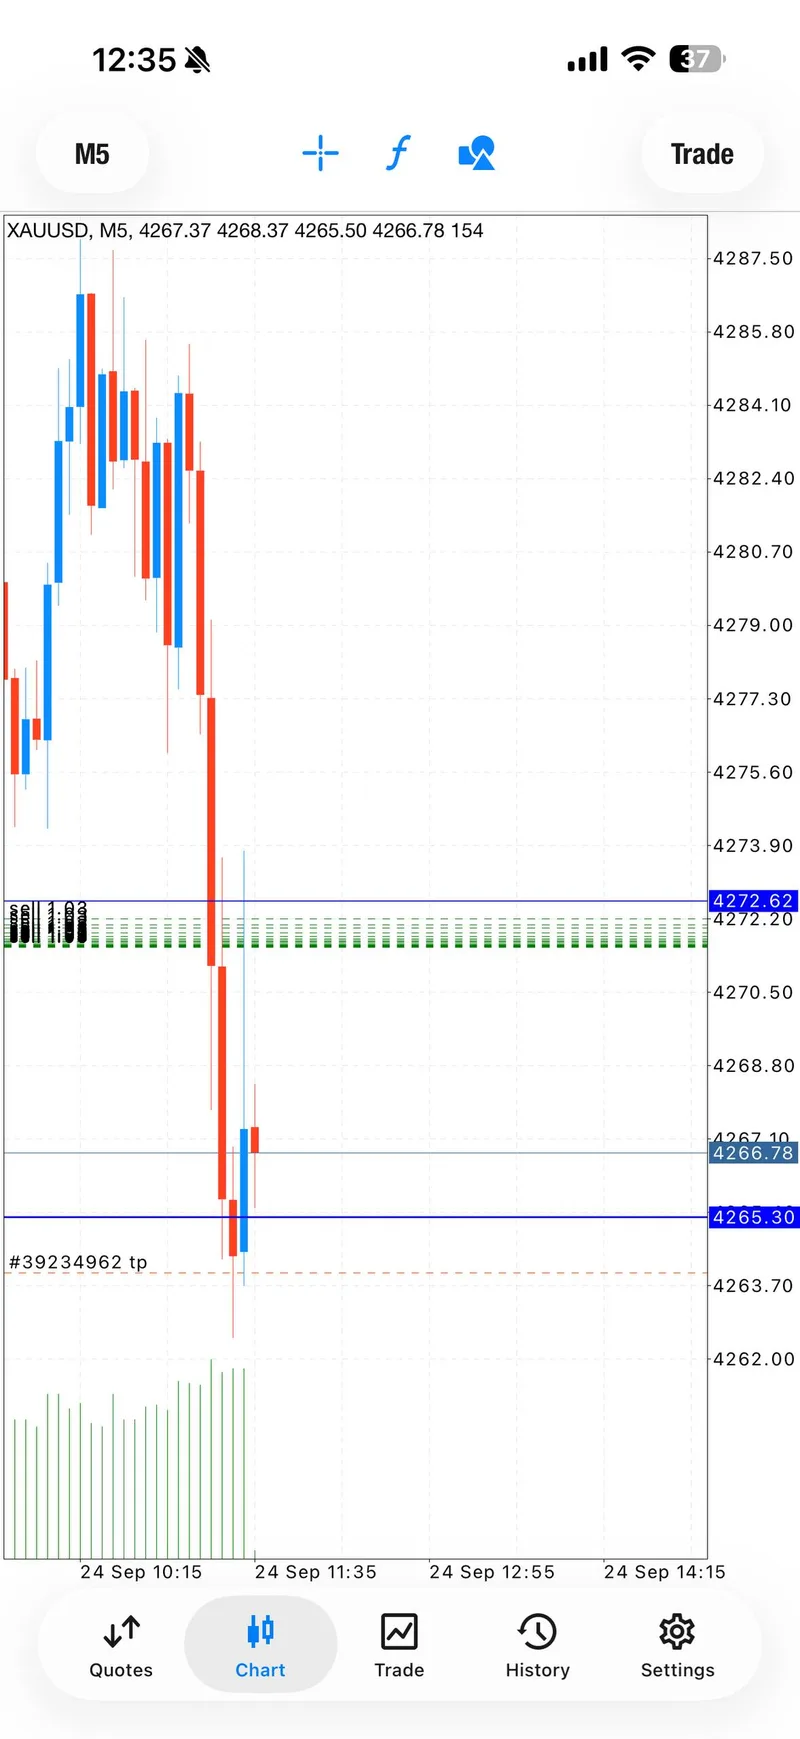
Thursday’s one-sell recap returned to a simpler structure. One public sell plan moved through five checkpoints as dollar and yield pressure weighed on gold. The published record kept the trade progression separate from the final almost-$20,000 close message and from the $15,370.69 account-history view shown for the displayed day range.
This distinction matters. Strong numbers attract attention, but clean attribution earns trust. The chart evidence shows the move; the channel statement records what was said; the account-history image remains an individual record. None of those should be blended into a larger weekly total.
Friday: pressure first, recovery second#
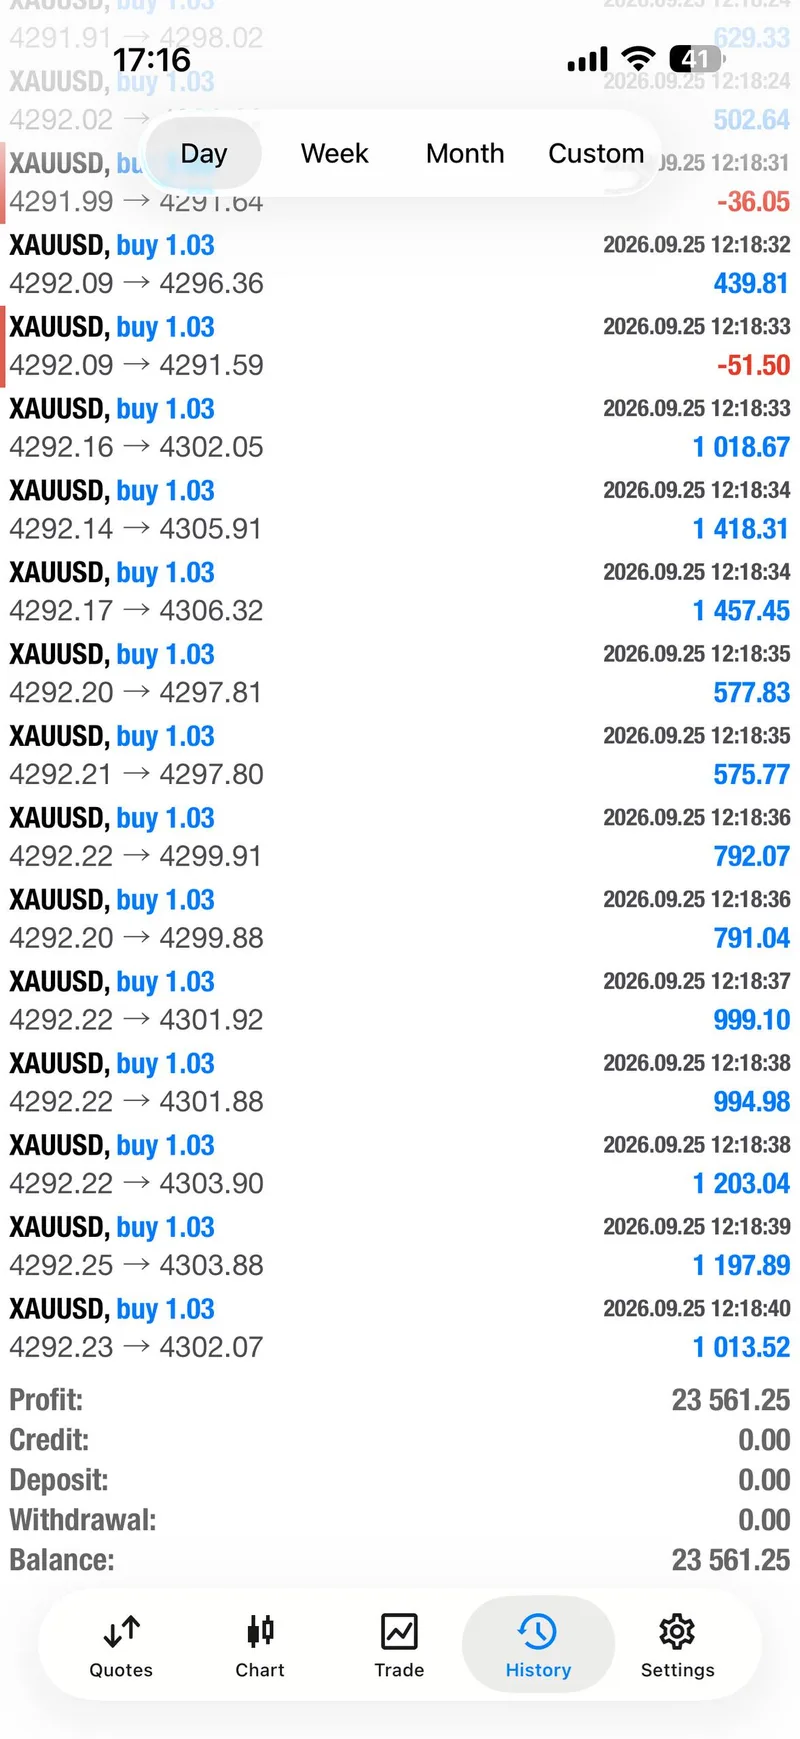
Friday’s recovery report documents one parameterized buy plan around 4295.4-4292. The sequence moved into profit, came back under pressure, and required active reductions before the later recovery. The public close message described a $23,000+ day. Separately, a same-day history screenshot shows $23,561.25 profit. This weekly recap keeps those two records separate and identifies $23,000+ only as the largest public single-session label of the week.
Friday is where the week’s lesson becomes most useful. The desk did not treat discomfort as a reason to abandon every good idea, and it did not treat hope as a substitute for protection. Exposure was reduced, the risk state changed, and the remaining plan had room to benefit when price recovered. That is a controlled finish, not a guarantee that the next pressured trade will recover the same way.
What the Proof Actually Shows#
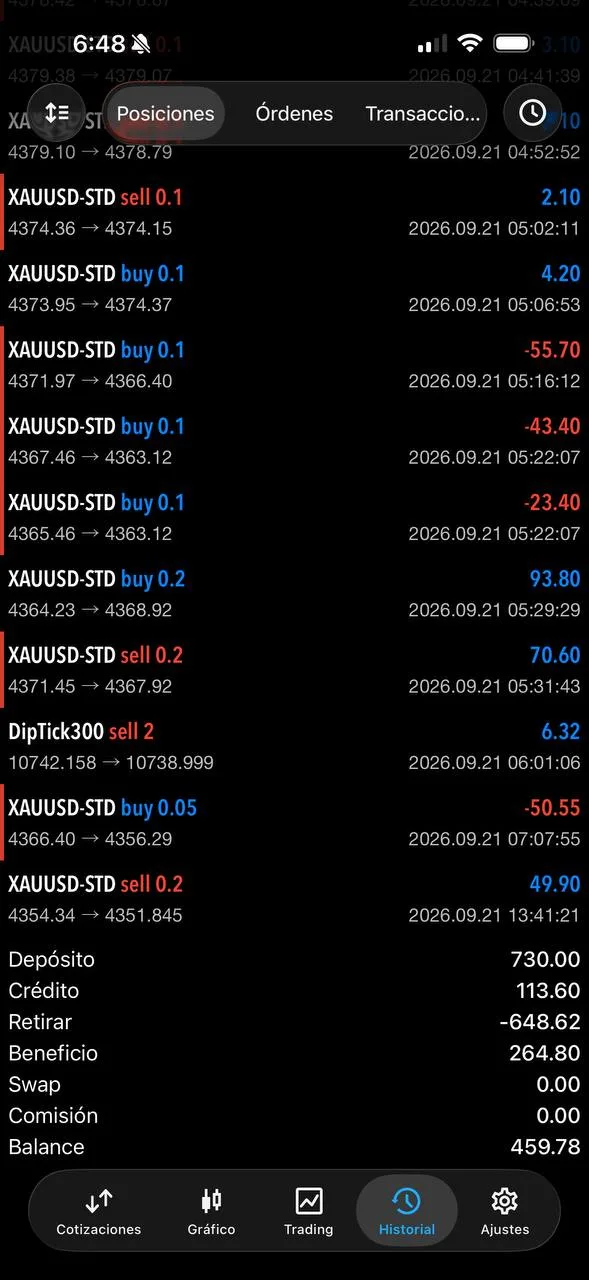
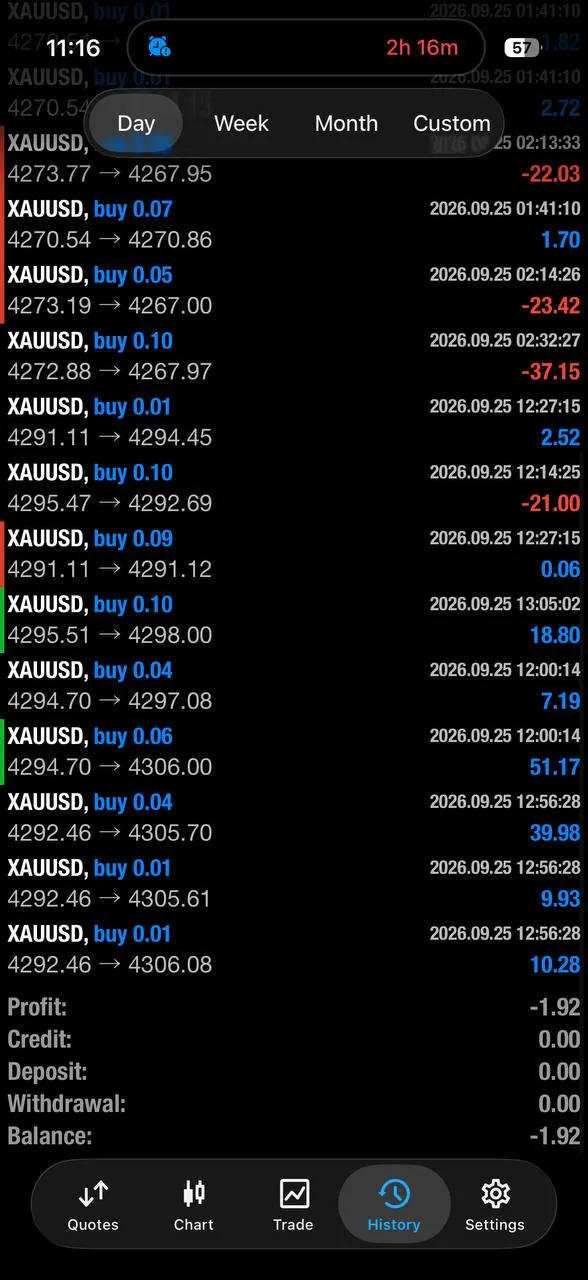
The selected weekly package contains four trade images and two community images. The trade set covers Monday’s downside continuation, Wednesday’s rebound structure, Thursday’s sell follow-through, and Friday’s account-history record. Together they show different market conditions rather than six copies of the same winning screenshot.
The two community images are also intentionally different. Monday’s member screen contains both gains and losses, while Friday’s selected member history likewise shows an uneven path rather than a perfect account. That makes the set more credible, not less. Community screenshots are individual experiences and unaudited records; they cannot establish a typical result. Their role is to show engagement around the public sessions while the article keeps the trading decisions and the limitations visible.
No weekly profit total is claimed. The Monday $10,000, Wednesday $15,000, Thursday almost-$20,000, and Friday $23,000+ labels belong to separate public session records. Adding them together would create a number that the source material does not verify. The better conversion story is the one the evidence can carry: MO stayed active through changing conditions, showed the uncomfortable moments, and repeatedly brought risk back under control.
What Worked, What Failed, and Why#
What worked was early protection. Monday’s risk reset converted a fast sell into a controlled archive. Wednesday’s cut prevented the first plan from dictating the rest of the day. Friday’s reductions gave the recovery time to develop without pretending the pressure had never happened.
What failed was static bias. The week moved from sell strength to a midweek buy, back into a sell, then into a Friday recovery. Any attempt to force one direction across all five calendar days would have ignored the changing dollar-and-yield pressure and the evidence on the chart.
What changed was the desk’s posture. When momentum was clean, MO used staged checkpoints. When the tape became unstable, the priority shifted to reducing exposure. When direction changed, the next plan was rebuilt rather than defended for ego. That combination is why the week reads like professional desk work instead of a highlight reel.
Key Levels and Scenarios for Next Week#
The latest research packet places near-term support around $4,270 and $4,245, with resistance around $4,300 and $4,320. These are planning references, not live trade instructions. For the forward catalyst map and scenario probabilities, pair this recap with the weekly gold forecast for September 28–October 2.
- If gold can hold above $4,270 and reclaim $4,300 with better confirmation, the Friday recovery structure may extend toward $4,320.
- If $4,270 fails quickly, $4,245 becomes the next important defensive reference and the desk should expect more headline-driven whipsaw.
- If yields and the dollar remain elevated, even a clean-looking rebound deserves staged profit-taking and a visible invalidation point.
The lesson from this week is not “always buy the dip” or “always sell the rally.” It is to know what would invalidate the idea, reduce risk when the market pays, and allow new evidence to change the plan.
FAQ#
Did MO make one combined weekly profit amount?#
This recap does not claim one. The dollar labels came from separate daily channel statements or account-history images and remain attached to those sessions.
Why are there five documented plans instead of twelve raw signal-like items?#
Short alerts, parameter updates, and re-entry messages can describe one evolving plan. The weekly count uses the published daily narratives: one Monday sell, two Wednesday plans, one Thursday sell, and one Friday buy. Tuesday remains market context because no daily execution article or usable trade proof was published.
Are the screenshots audited statements?#
No. They are selected public chart, history, and community records. They support the sequence described in the article but are not audited performance statements or guarantees.
How can I follow the next free update?#
Message @GTMOBest for the free signal lane and to ask about free VIP access. You can also browse Gold Trader Mo weekly summaries and the linked daily reports before deciding whether the process fits you.
Connect with Gold Trader Mo#
This week’s value was not a perfect forecast. It was the ability to protect a Monday sell, admit and repair a Wednesday reversal, keep Thursday’s downside plan clean, and manage Friday’s recovery without merging every strong screenshot into one exaggerated claim.
If that proof-first, risk-first approach is what you want to follow, message @GTMOBest for free signals and to ask about free VIP access. Review the public archive, ask questions, and judge the process before judging the headline.
This weekly summary is for education and market commentary only. Trading involves risk, capital can be lost, individual results vary, and past performance does not guarantee future outcomes.