
Market Snapshot#
Friday, September 25 was a recovery session with a difficult middle. Gold did not deliver a clean staircase higher. The public @GTMO record shows a buy sequence around 4,295.4–4,292, a fast move through planned levels, a risk reset, and a close in which members described the session as a strong finish to the week. That sequence is the story. The market backdrop helps explain the pressure, but it does not replace the public record.
If you want the next free gold signal and FREE VIP channel access, message @GTMOBest early so you can see the same kind of structured updates before the next recap is written.
The market figures below are a timestamped intraday snapshot captured at 21:09 GMT+7. They are not a final daily settlement. Google-researched spot and benchmark pages showed gold around $4,302.00, a $4,255.90–$4,316.60 intraday range, DXY at 101.24, and the US 10-year yield at 5.213%. The Federal Reserve target range was 3.75%–4.00%. The public session record and the market snapshot are related evidence, but they are kept separate so a current quote is not presented as a close.
| Metric | September 25 snapshot |
|---|---|
| XAUUSD current spot | $4,302.00 |
| Intraday high / low | $4,316.60 / $4,255.90 |
| DXY snapshot | 101.24 |
| US 10-year yield snapshot | 5.213% |
| Federal Reserve target range | 3.75%–4.00% |
The combination mattered. Gold had room to rebound after testing the mid-$4,250s, but a firm dollar and a yield above 5.2% made it harder for the move to stay effortless. That is why the strongest lesson from this day is not “gold only went up.” It is that a well-documented plan can keep its shape while the tape changes speed.
For continuity, compare this report with September 24's one-sell, five-target recap. The previous session was cleaner; September 25 required more active protection and clearer separation between the signal path and the final result.
Why The Tone Changed So Fast#
The tone changed because the first move created confidence, then volatility challenged that confidence before the recovery became visible. At 09:16 UTC, the public record gave a buy area of 4,295.4–4,292 with a protective level at 4,288 and planned levels at 4,298, 4,300, 4,302, 4,304, 4,306, and open follow-through. In a quiet tape, that may read like a simple continuation. On this day, it became a test of whether the desk would protect progress instead of chasing the next candle.
The next updates explain the change in tone. By 09:23 UTC, the public channel reported that all entries were in profit. At 09:29 UTC, the record moved from celebration to protection: profits were taken near the top and the risk level was adjusted. A short “back in blues” moment followed at 09:32 UTC. That is the uncomfortable middle most promotional recaps omit, and it is precisely why this session is useful to study.
The second half of the sequence restored the constructive tone. The public updates moved through the first planned level, a break-even reset, a second level, and then 100+, 160+, and 200+ pip language as the move extended. Those messages are historical session evidence, not an instruction to copy a price today. The proper reading is that protection was updated while the position had room to work.
That rhythm also makes the September 23 flight-mode recovery report a useful comparison. Different market days can produce similar screenshots, but the decision pressure is not identical. September 25 was about recovering control after the first burst, not about pretending the first burst was the whole trade.
Technical Outlook#
The intraday structure supplied a clear map without pretending to forecast a final close. The first support pocket was $4,255–$4,260, where the session found its lower rebound area. A deeper support zone sat around $4,230–$4,235, with $4,180–$4,210 as the broader downside reference if the rebound failed. On the upside, $4,310–$4,317 was the first decision band, followed by $4,330–$4,350 and then $4,380–$4,400.
At the captured spot of $4,302, gold was sitting just below the first resistance band rather than proving a fresh breakout. The range therefore supports two honest conclusions. First, the rebound was real enough to reward the public sequence. Second, a high intraday print around $4,316.60 did not automatically turn into a confirmed daily close above resistance. Readers should keep those statements separate.
The firm DXY snapshot at 101.24 and the 5.213% 10-year yield are also useful guardrails. They describe a backdrop that can cap enthusiasm even when gold is recovering. A softer dollar or a retreat in yields could give the next leg more room; a renewed push higher in either can turn the same resistance band into a rejection area. This is context for reviewing the past session, not a live trade call.
Trading Signals#
Signal 1 — The public buy sequence#
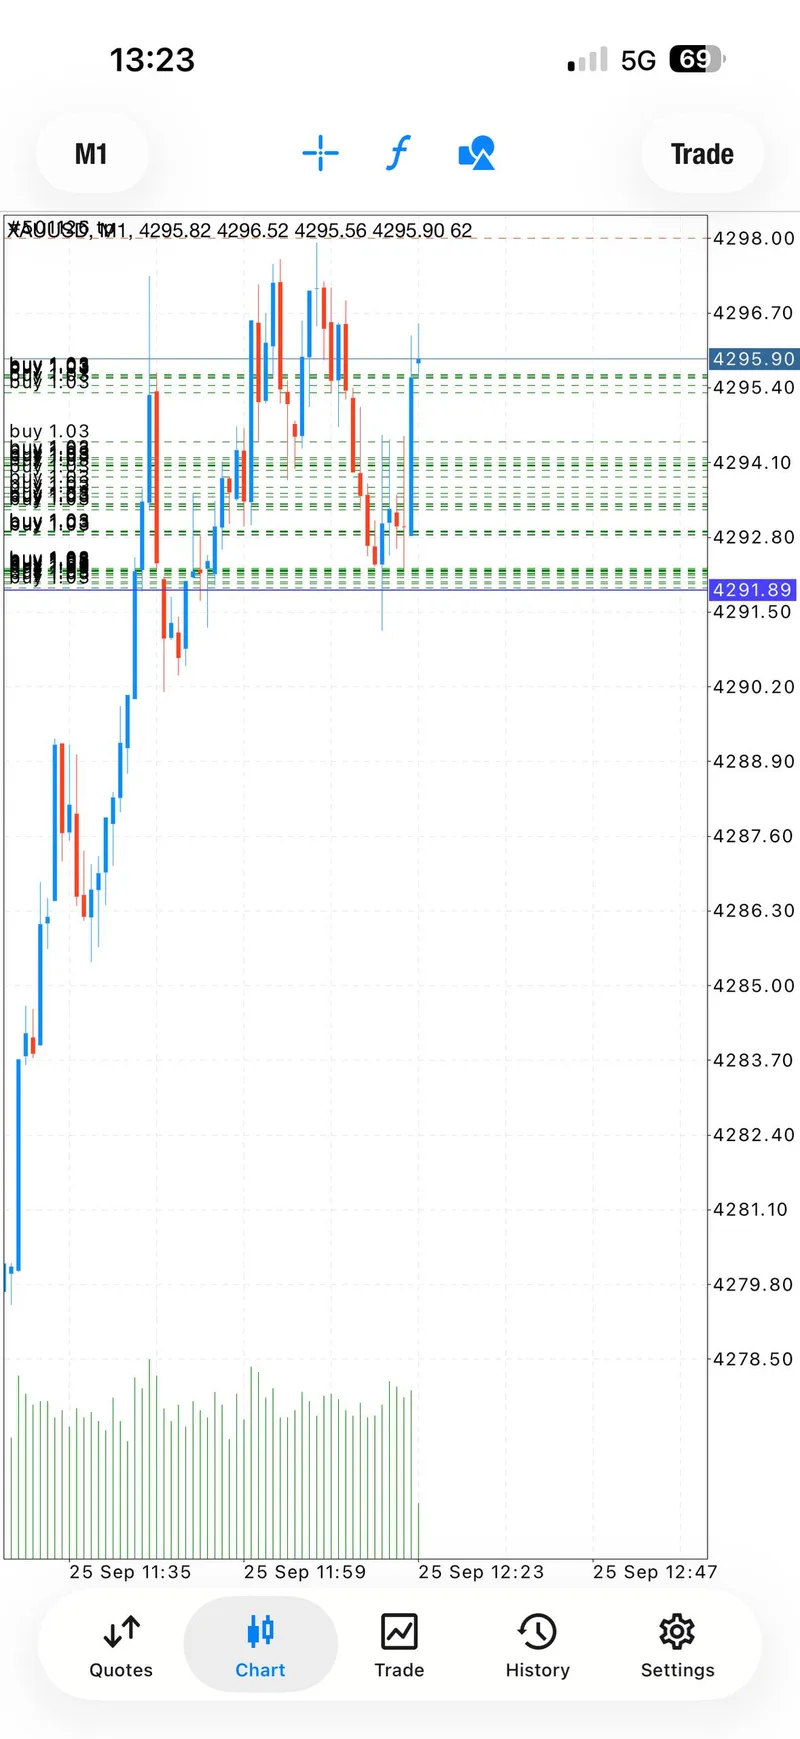
The first public buy update appeared at 09:16 UTC around 4,295.4–4,292, with a protective level at 4,288 and a ladder of planned levels above the market. The value of this update is its specificity. It gives readers an exact historical zone and a sequence to check against the later public record rather than a vague claim that “gold was bullish.”
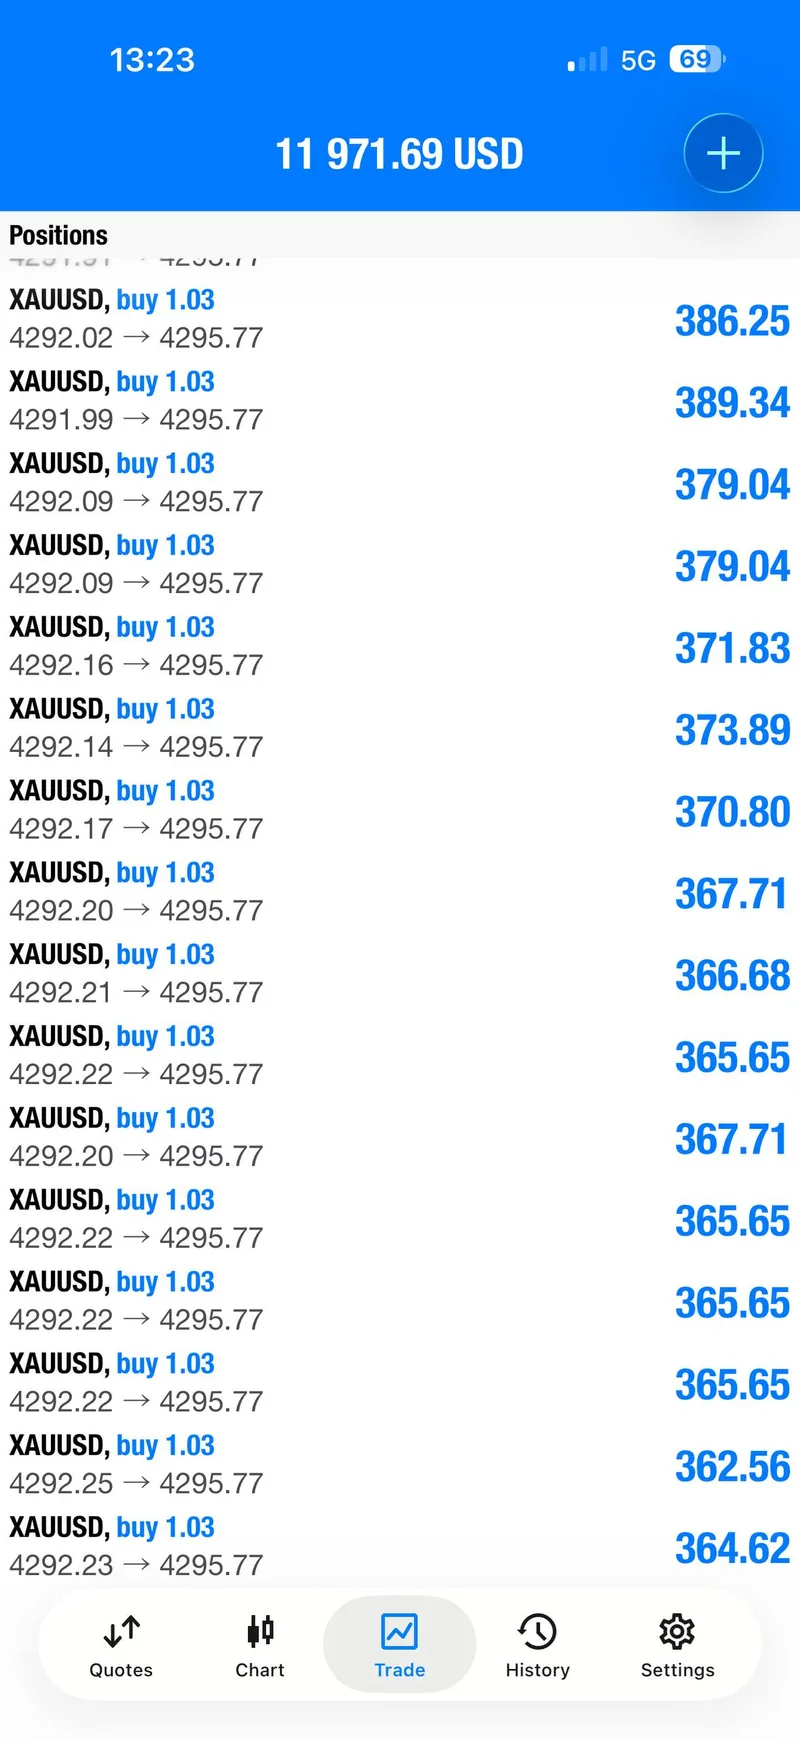
The next messages show why the setup deserves a recovery label. The channel reported that the positions moved into profit, then documented profit-taking and a protection adjustment near the top. A brief return to pressure did not erase the earlier progress; it made the later decision to continue only after risk was reduced more meaningful.
Signal 2 — Protection, progression, and the finish#
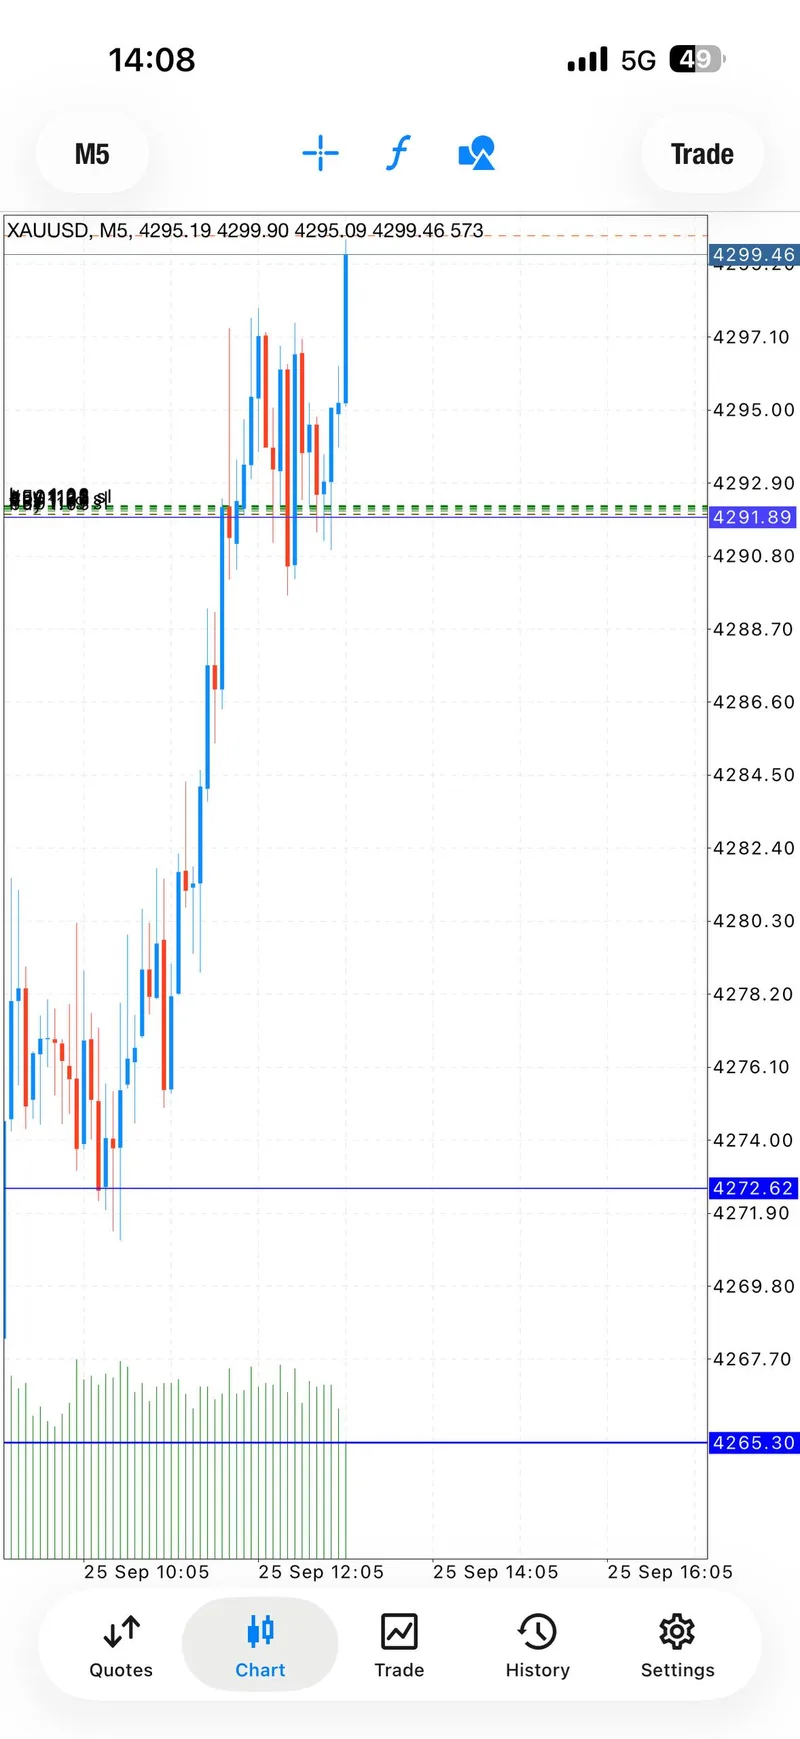
The follow-through was documented in stages. The public record checked the first planned level, described a move toward the next level, and then reported 100+, 160+, and 200+ pips as the session extended. The messages also stated that the risk was moved to break-even for zero risk before the later progress. This is why a staged recap is more credible than a single victory screenshot: the reader can see where the plan changed and why.
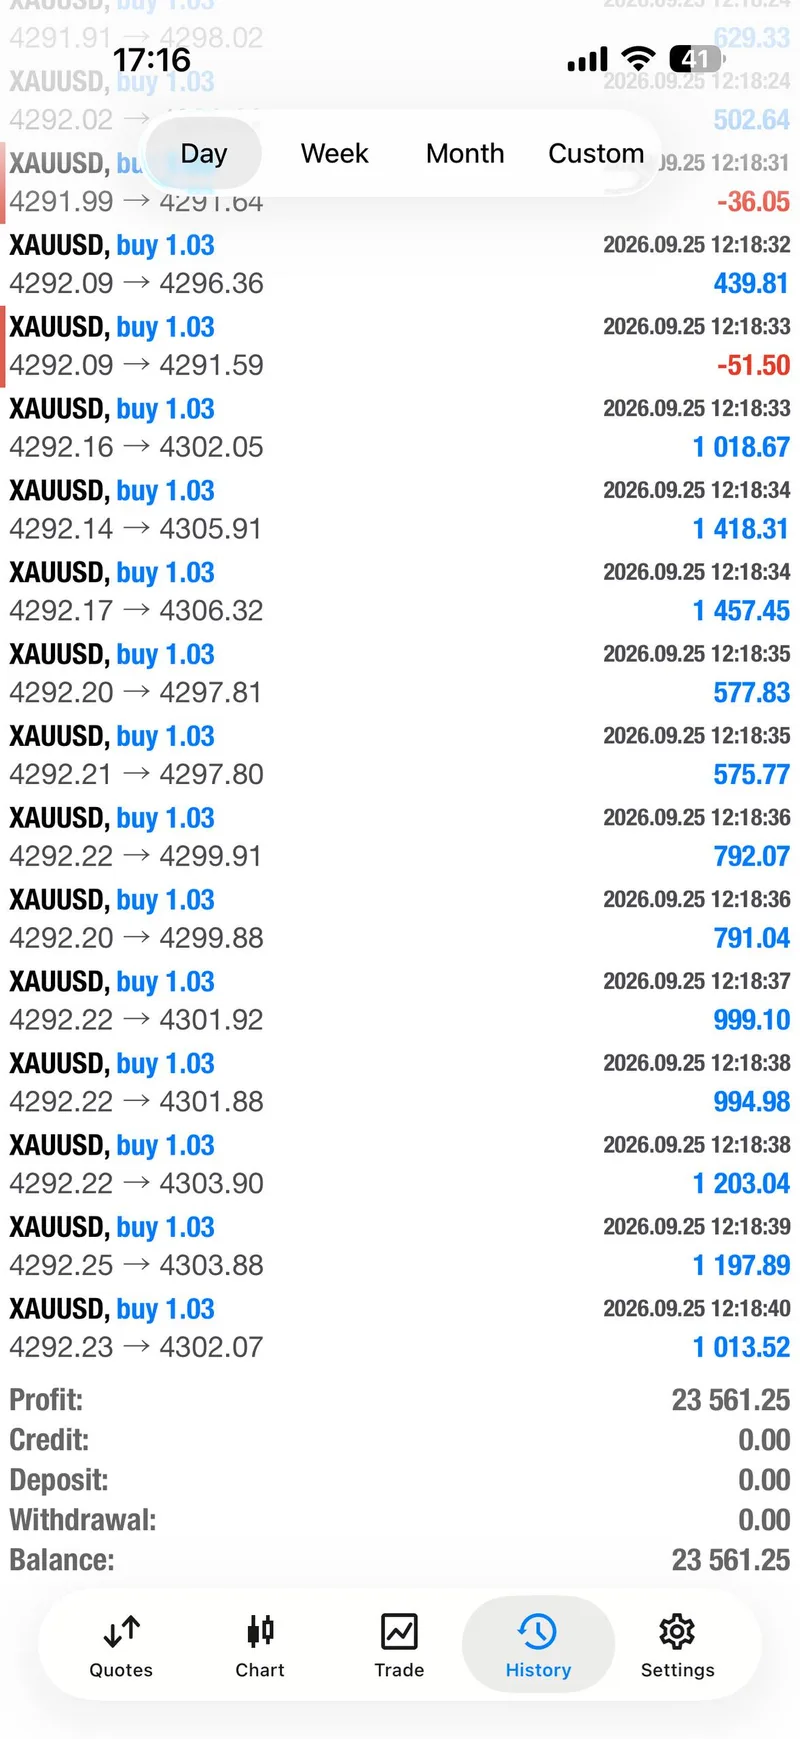
At 13:16 UTC, the public close message said that all trades were closed and profits secured, and described a $23,000+ day to finish the week. Separately, a same-day history screen shows $23,561.25 profit. The article keeps those two claims distinct. One is a public closing statement; the other is a visual account-history result. Combining them into one larger number would overstate the evidence.
The gallery under this section places four selected trading screenshots beside the written sequence. They are not decorative proof. Together they show the history result, the early move into profit, a paired trade-history view, and the chart reaching a planned level.
Signal Performance Breakdown#
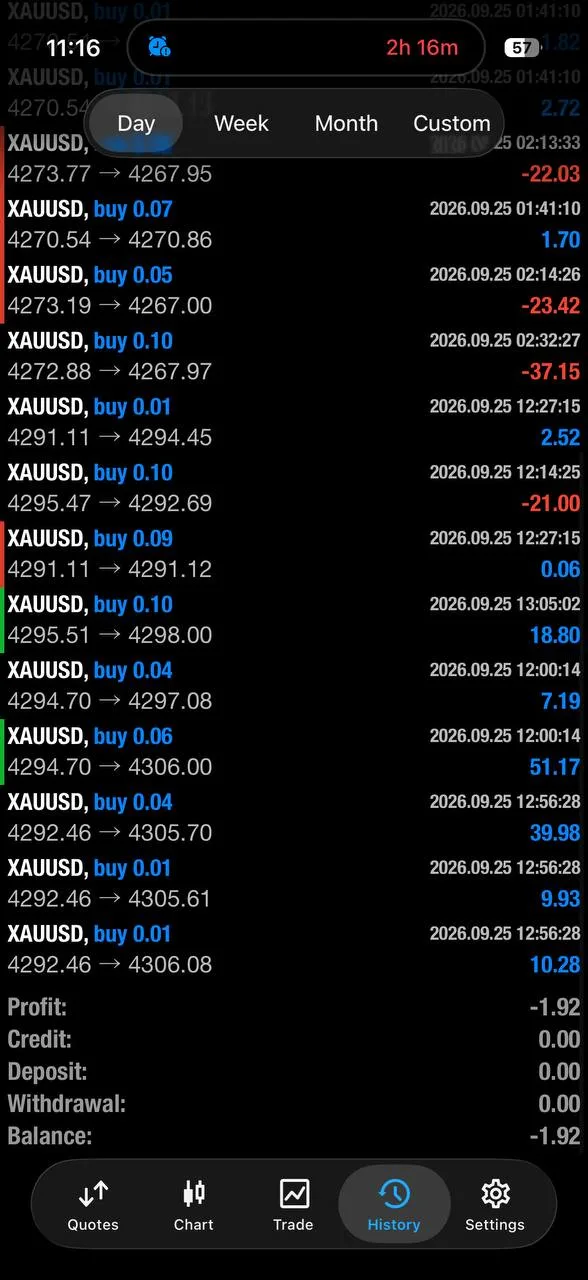
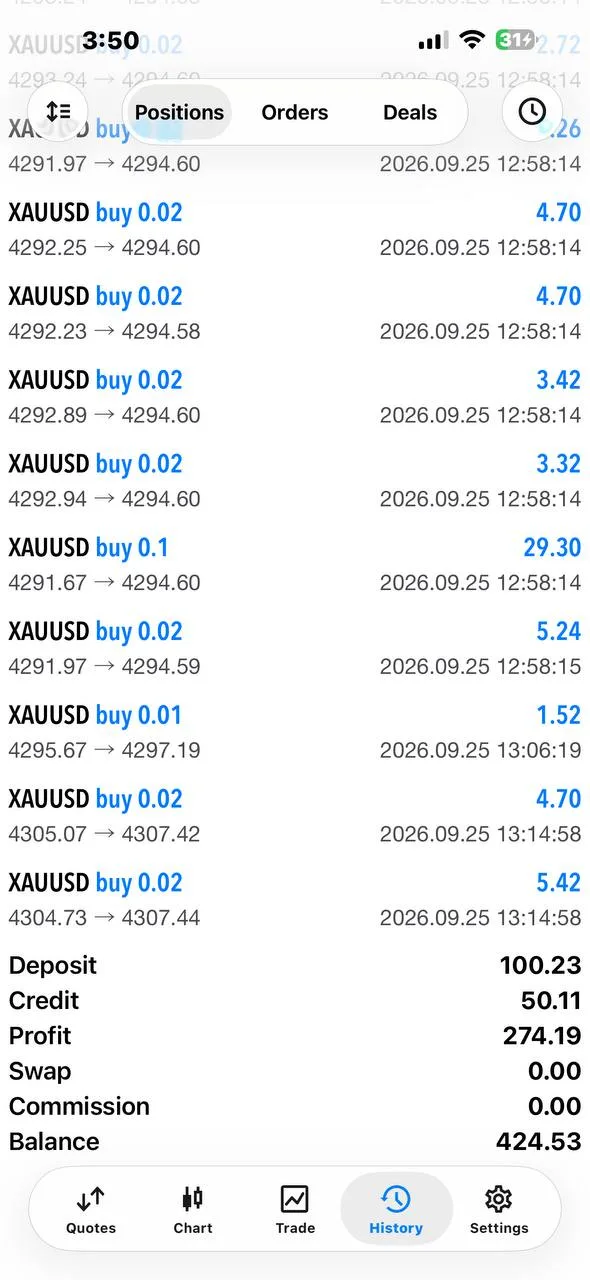
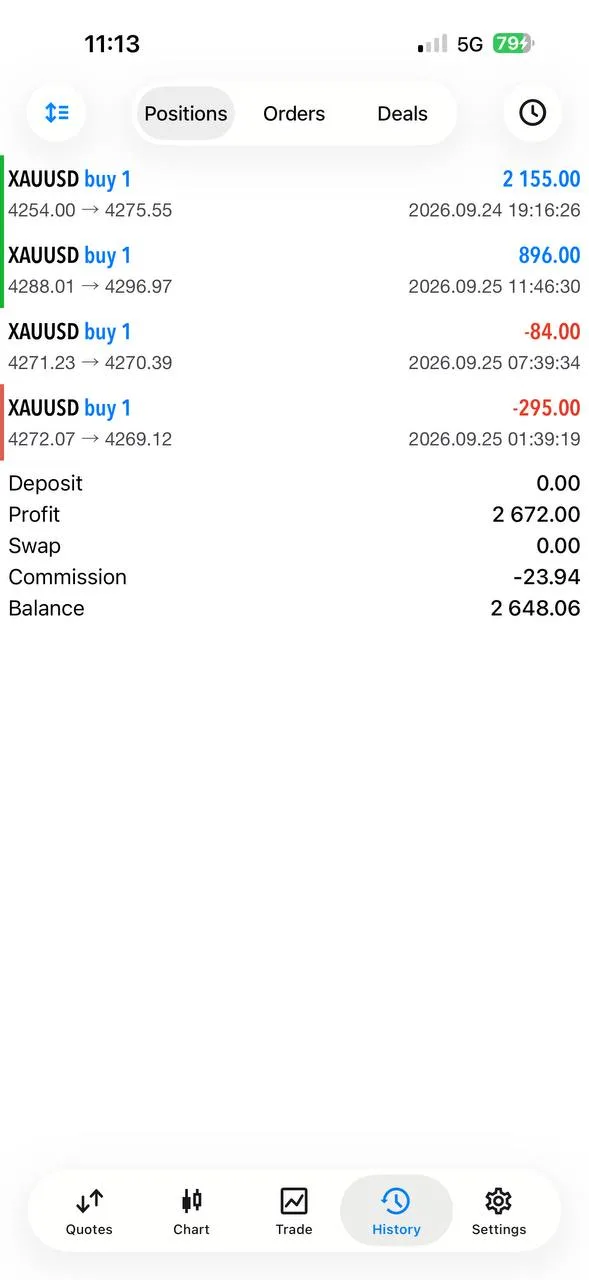
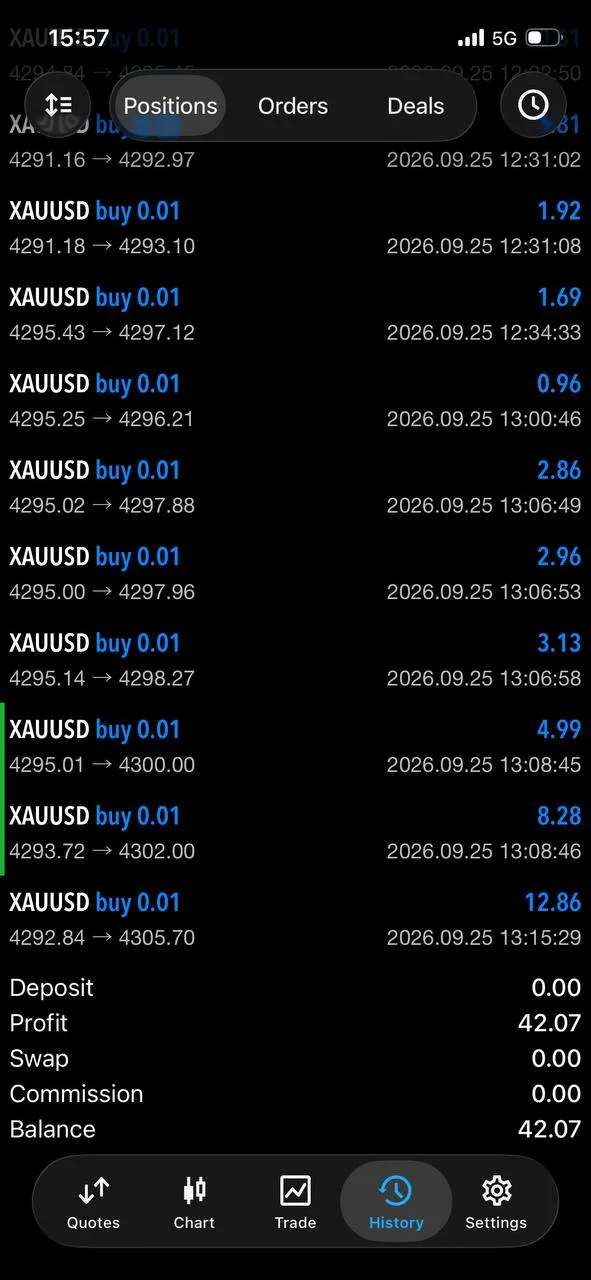
The session’s strongest evidence is the order of events: public call, profit expansion, protection adjustment, temporary pressure, renewed progress, and a documented close. That order is more informative than simply quoting the best number.
Across the same-day public record, 22 member feedback messages were visible. This article selects 8 public proof screenshots: 4 trading/profit images and 4 community images. The counts are intentionally different. The 22 figure describes the full feedback set; the 8 figure describes only the clearest images chosen for this report. A screenshot count is not a substitute for a message count.
The member responses add useful texture without turning every reply into a promise. One member said the session helped recover a personal trade and then called it a day. Another posted a result for sharing. Other replies were short thanks, a “to the moon” celebration, or a first $200 day. These are individual experiences, not guarantees. They show why the public record felt meaningful to members while leaving the outcome attached to each person’s own account and decisions.
The selected community gallery follows this section so readers can inspect that response directly. The images are deliberately paired with modest captions: they identify what the screenshot shows without inventing a name, balance, or return that the image does not clearly establish.
For a second performance comparison, read the September 21 protected $10K recap. The point is not to rank days by a headline amount. It is to see how protection language, staged outcomes, and member feedback change from one session to another.
Execution Lessons#
The first lesson is to treat risk adjustments as part of the result. On September 25, protection was not a footnote added after the win. It was part of the public sequence: profit was taken, the risk level was changed, and the plan was allowed to continue only after exposure had been reduced. That is the difference between a recap that teaches and a recap that merely celebrates.
The second lesson is to separate an uncomfortable update from a failed thesis. “Back in blues” was a real moment of pressure, but the later record shows that the session was not abandoned. The right question was whether the structure and protection still justified staying with the historical plan. That question is more durable than any one target number.
The third lesson is evidence discipline. The $23,000+ close statement and the $23,561.25 history screenshot are both compelling, but they are not interchangeable. Keeping them separate lets a reader understand what was said publicly and what was visible in an account-history image. Clear attribution builds more trust than blending every strong detail into one headline.
Finally, member feedback should be read as context rather than as a promise. A first $200 day, a recovery message, or a grateful reply can be important to the person who wrote it. None of them removes trading risk for the next person. The public record is strongest when it shows both the result and the limits around the result.
What The Day Means Going Forward#
September 25 belongs in the recovery-and-reset category. The market snapshot showed a rebound into the $4,300 area, but the trading story was the way the desk handled speed, pressure, and renewed follow-through. Readers can carry that framework into future reports: identify the historical zone, note where protection changed, distinguish planned levels from realized outcomes, and check the public record before accepting a headline.
The macro backdrop also argues for humility. A 101.24 dollar index and a 5.213% 10-year yield can keep a rebound fragile even when the chart looks constructive. If the next session tests the $4,310–$4,317 band, the honest question is whether price can hold above it with supportive context, not whether one prior success guarantees another.
That is why the report leads with the public signal and the recovery path. Market context explains the environment; it does not manufacture a result. The strongest conversion asset is a readable record that lets a new reader understand what happened, what was protected, and where the evidence stops.
FAQ#
Was September 25 a final-close report?#
No. The market table is a timestamped intraday snapshot captured at 21:09 GMT+7. The report keeps the current spot, intraday high and low, DXY, and US 10-year yield labelled as snapshots because a final settlement was not available in the research window.
What was the main historical setup?#
The public buy sequence was shared around 4,295.4–4,292, with a protective level at 4,288 and several planned levels above. Later messages documented profit, risk adjustment, and staged follow-through. Those details describe September 25 and are not a live instruction.
How should I read the $23,000+ message and the $23,561.25 screenshot?#
Read them as two separate pieces of same-day evidence. The public close message described a $23,000+ day. A separate history screen showed $23,561.25 profit. The report does not add them together or claim they are the same measurement.
How many member screenshots are included?#
There were 22 visible member feedback messages, and 8 selected public proof screenshots are included here: 4 trading/profit images and 4 community images. The selected set is an editorial subset, not the total response count.
Where can I find the next free update?#
Message @GTMOBest for free signals and FREE VIP channel access. You can also follow Gold Trader Mo and return to the daily report archive for the next verified recap.
Connect with Gold Trader Mo#
If this recovery-focused report is the kind of evidence you want to read before deciding whether a setup fits your own process, start with the free channel. Message @GTMOBest for free signals and FREE VIP channel access, and ask for the current access path. The September 25 record shows the complete arc: a public buy zone, a risk reset, staged progress, member feedback, and a close that is clearly separated from the account-history screenshot.
This is historical reporting, not financial advice. Trading involves risk, results vary by account and execution, and no past session guarantees a future outcome.