
Market Snapshot#
September 21 was a fast, highly visible XAUUSD sell-session recap. The public @GTMO record shows an initial sell alert at 10:18:29 UTC, followed two minutes later by a parameterized sell zone at 4354.4-4358 with a protective stop at 4362 and five downside checkpoints: 4352, 4350, 4348, 4346 and 4344. The sequence then moved through target updates, a breakeven instruction and a close-safe result claim.
The strongest bounded result shared publicly was that $10,000 was closed safe while the remainder continued under breakeven protection. Later messages recorded all trades closed and five target milestones. Those are same-day channel claims, not a promise of typical returns. Readers who want free signals and FREE VIP channel access can message @GTMOBest.
The market snapshot used for this historical recap is intentionally intraday. At 14:02 GMT+7, XAUUSD was shown at $4,348.08, with an approximate session range of $4,345-$4,380. The full September 21 close was not available at that observation, so $4,348.08 is not presented as a settlement price. The surrounding backdrop was high-level consolidation: the dollar was still firm but losing some upside momentum, the U.S. 10-year yield was around 4.96%-4.97%, crude was softer, and the Federal Reserve target range remained 3.75%-4.00%.
| Market input | Historical snapshot |
|---|---|
| XAUUSD | $4,348.08 intraday snapshot at 14:02 GMT+7 |
| Approximate intraday range | $4,345-$4,380 |
| Immediate levels | Resistance 4358; support 4344 |
| Wider level | Resistance 4400; support 4235 |
| U.S. 10-year yield | About 4.96%-4.97% intraday |
| Fed target range | 3.75%-4.00% |
Why The Tone Changed So Fast#
The tone changed because the desk did not wait for a perfect-looking headline before showing its work. The first sell alert appeared at 10:18:29 UTC. At 10:20:04 UTC, the public record gave readers a defined zone, a protective invalidation level and a five-step path lower. That made the later updates readable as a sequence instead of a collection of hindsight screenshots.
Within minutes, the record moved from the first target being close to the second target check. A breakeven update followed at 10:32:09 UTC, and the next public notes tracked the third and fourth checkpoints before the fifth was marked. The change in tone was therefore about execution as much as direction: the move was allowed to develop, but exposure was reduced after progress.
This is the useful contrast with a generic “gold went down” recap. A market can move in the expected direction and still punish a trader who refuses to define risk. Here, the public sequence kept returning to checkpoints, protection and the next decision. The historical lesson is not to copy an old sell call. It is to see how a plan can stay legible as the tape accelerates.
For a nearby comparison, the September 18 four-target recap shows a different session structure. Reading the two together makes the point clearer: the value is in the documented process, not in pretending every day produces the same shape.
Technical Outlook#
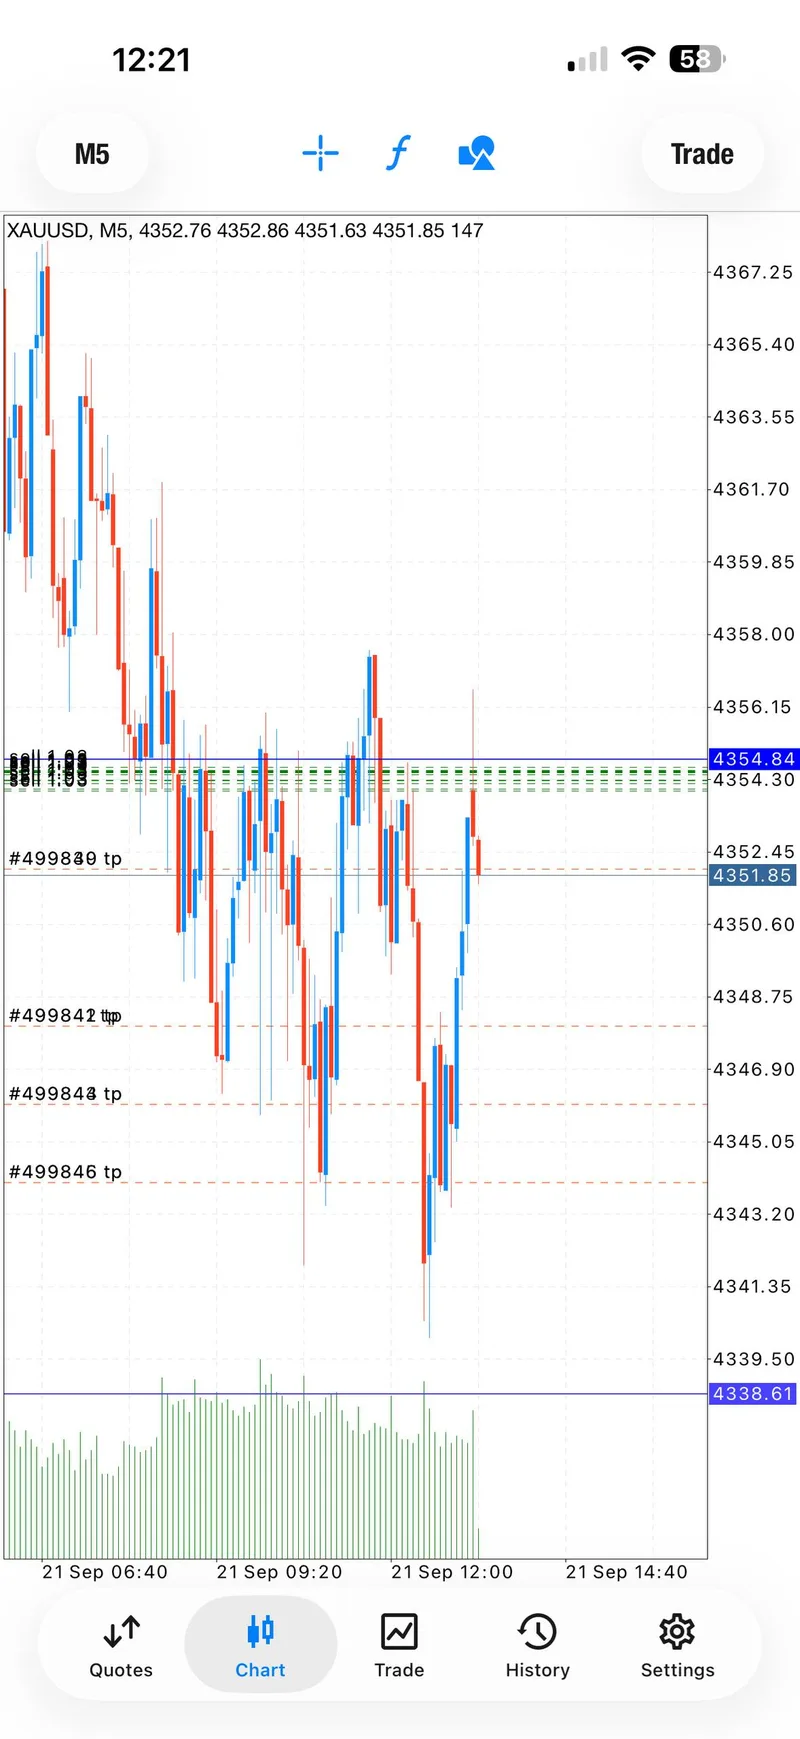
The technical frame was simple enough to follow after the fact. The parameterized sell zone sat at 4354.4-4358. The public stop was 4362, so the invalidation line was visible before the sequence progressed. The checkpoints stepped lower in five increments: 4352, 4350, 4348, 4346 and 4344.
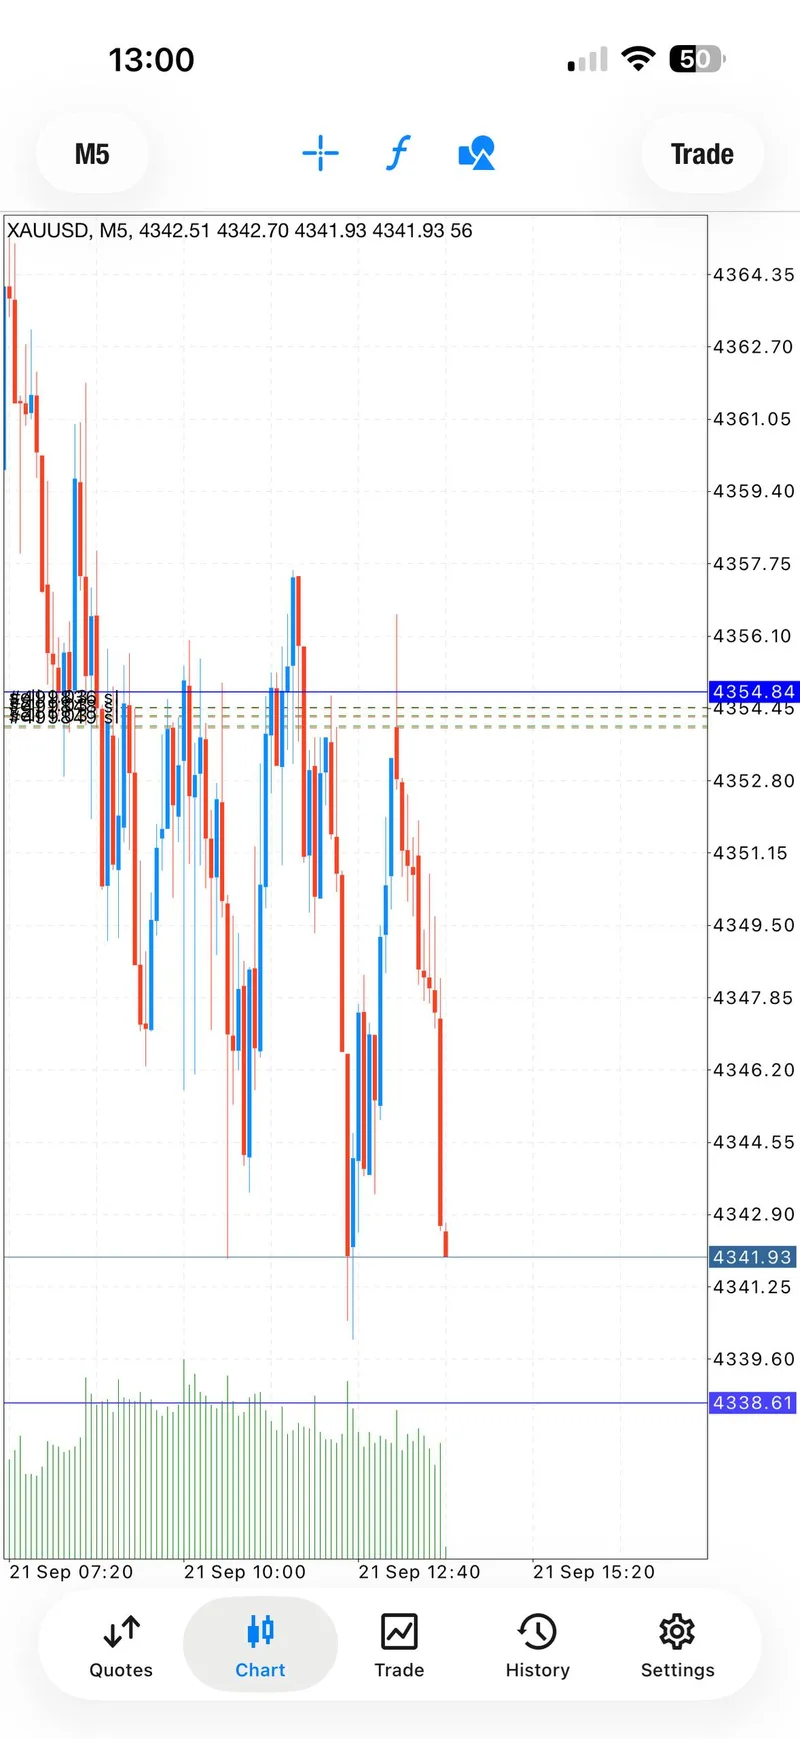
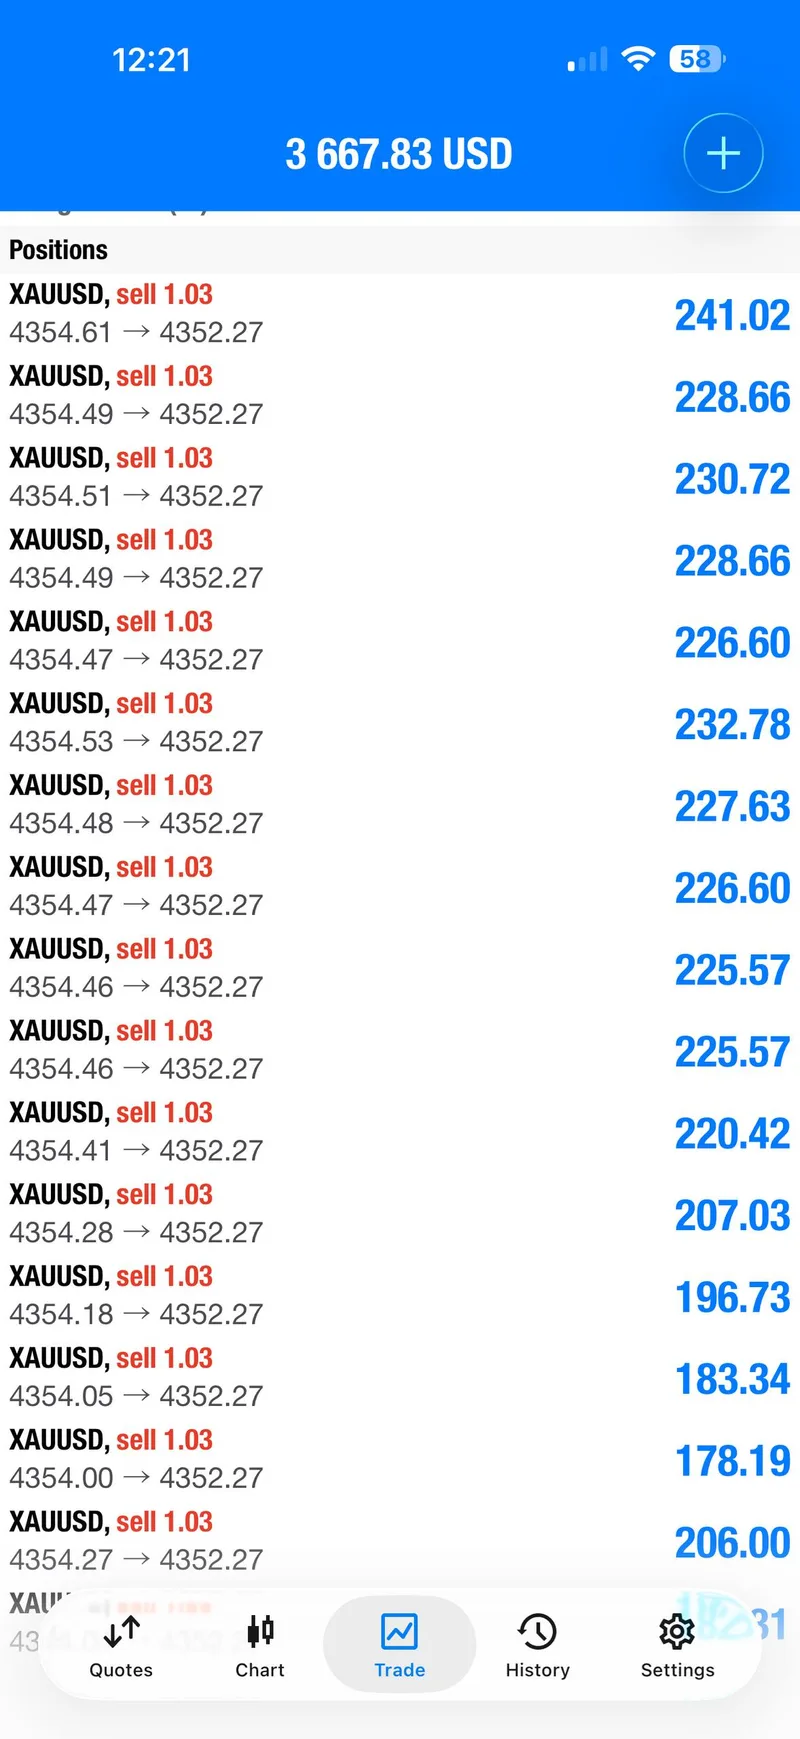
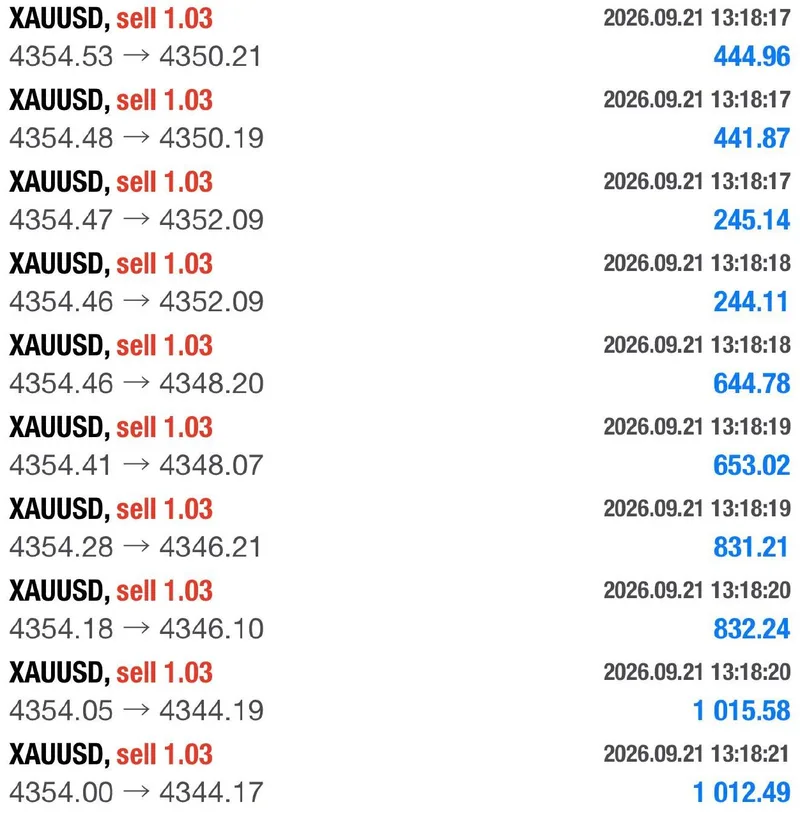
The chart screenshots show why that structure mattered. The market repeatedly moved away from the entry area, and the later trade-history screens show positions closing at progressively lower prices. The same-day record also reported almost 100 pips and the fifth target together. Because platform prices can vary by account and feed, the recap keeps that wording as a channel-reported milestone rather than translating it into a universal result.
The wider market snapshot points to a tug-of-war rather than a clean macro trend. The dollar remained firm but had started to lose upward momentum. The 10-year yield eased below the 5% psychological threshold to an intraday band around 4.96%-4.97%. Softer crude oil reduced part of the immediate inflation panic, while the Fed's 3.75%-4.00% target range still kept opportunity cost in view for a non-yielding asset.
At the time of the snapshot, the nearest technical levels were 4358 resistance and 4344 support, with 4400 and 4235 as wider reference points. Those levels are context for the past session, not a live trading instruction. Traders should treat any future setup as new work that needs its own confirmation, sizing and risk decision.
The September 17 five-target reset report offers another useful comparison: five checkpoints can appear in both a continuation and a recovery story, but the management logic is not interchangeable.
Trading Signals#
One parameterized SELL sequence#
The first public alert was “Gold sell now” at 10:18:29 UTC. The canonical setup followed at 10:20:04 UTC: SELL 4354.4-4358, stop 4362, and targets 4352, 4350, 4348, 4346 and 4344. The recap treats these two messages as one evolving sequence, not as two unrelated trades.
Target progress was visible in the public record: the first target was approaching at 10:21:25 UTC, the second was checked at 10:31:48 UTC, and breakeven protection was announced at 10:32:09 UTC. The third target was checked at 10:40:52 UTC, the fourth at 10:58:49 UTC, and the fifth was marked around 10:59:45 UTC.
The final same-day follow-through was also visible. At 11:00:38 UTC the public record reported $10,000 closed safe while the rest ran under breakeven. At 11:18:43 UTC all trades were reported closed, and at 12:03:16 UTC a five-target summary was posted. The article records that chain as past-session evidence, never as a current instruction.
Signal Performance Breakdown#
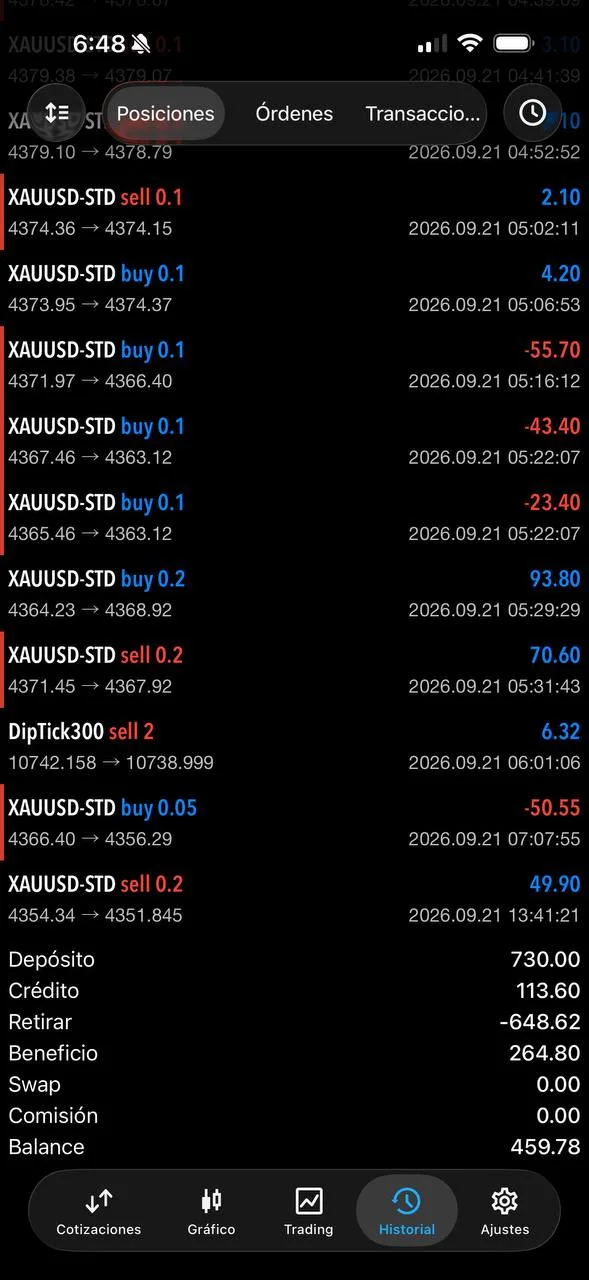
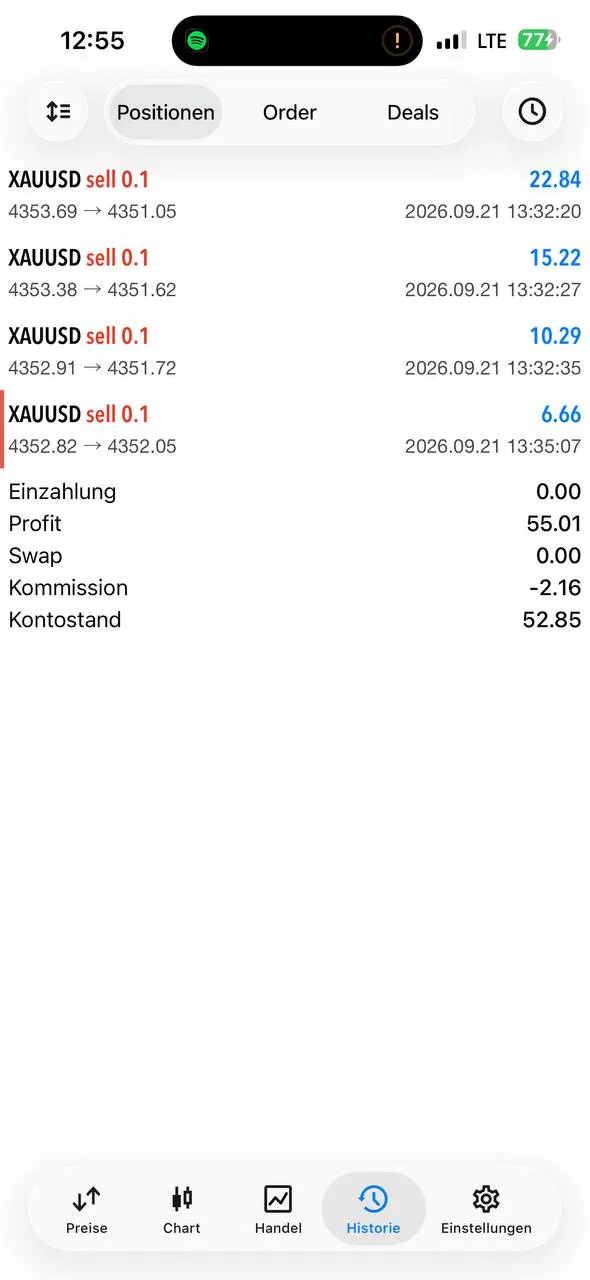
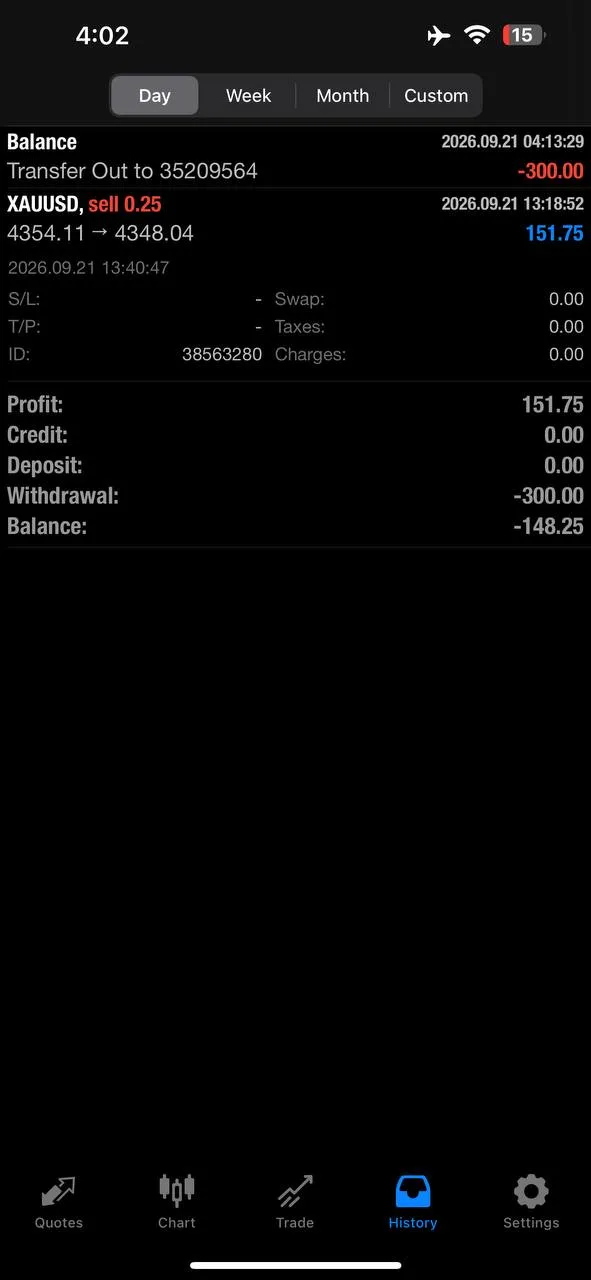
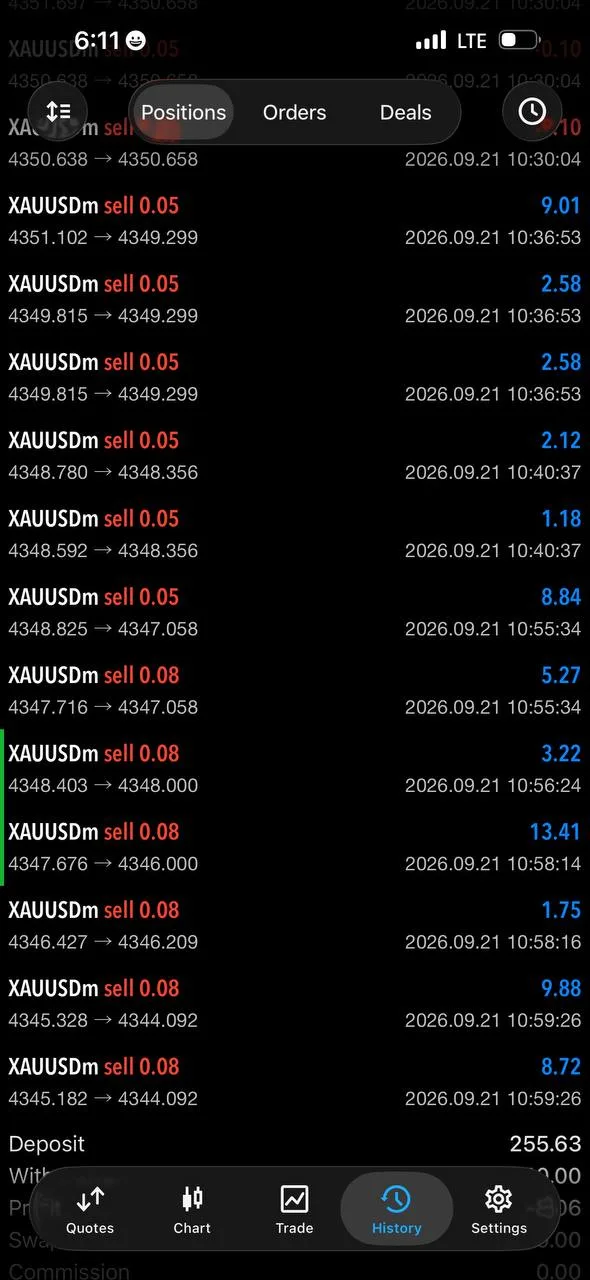
The cleanest way to read this session is as a progression of checkpoints and protection. The public record did not only show an entry. It showed the entry zone, the invalidation line, the path through five targets, the move to breakeven and the close-safe update. That sequence gives the reader something concrete to audit without pretending that one account result applies to everyone.
The headline result remains bounded: $10,000 was reported closed safe, while the remainder kept running under breakeven. The same record later said all trades were closed and the five targets were complete. A separate later message described almost $12,000 after the quick chart session; that remains an individual channel claim and is not used as the article's main result.
nine member feedback messages appeared in the same-day public @GTMO record. This article shows eight selected public proof screenshots: four trading-sequence images and four community images. The difference is deliberate. The nine-message count describes the full response; the eight-image gallery keeps only the clearest visual moments tied to the session.
What the proof screenshots show#
The trading screenshots move from a chart with the sell zone and target lines to dated trade-history screens showing positions closing lower. One chart captures the protected close-safe moment, while the later screen records five completed milestones. The community screenshots add a second perspective: named reactions from Jorky E. Pérez C and Nick, a short thank-you paired with a profit history, and a member trading-history screen without a placeholder username.
The screenshots are not presented as audited statements or guarantees. They are public proof moments shared around the same session, and they are strongest when read alongside the timestamps and the written risk updates.
For another recent example of how a public report separates the channel headline from account-specific evidence, see the September 16 four-target report.
Execution Lessons#
First, define invalidation before celebrating progress. The 4362 stop was visible alongside the sell zone, which makes the later protection update more meaningful. A result is easier to trust when the losing line was not hidden.
Second, let progress change the risk. The breakeven message came after the second target update, not after the final screenshot. That is the practical difference between holding a plan and holding a hope. When the move had paid enough, the record showed an effort to protect the open remainder.
Third, separate a public channel result from a personal account result. The $10,000 close-safe wording belongs to the same-day public record. The account screens belong to the individual members who shared them. Neither should be treated as a promise that the next reader will see the same dollars.
Fourth, keep a fast sequence readable. The five checkpoints gave the room a shared map. Instead of a vague “gold is falling” message, readers could see which level had been reached and what protection came next. That communication discipline is part of what makes a trading recap useful after the session has ended.
What The Day Means Going Forward#
September 21 is worth remembering as a compact example of a documented continuation: one parameterized sell sequence, five checkpoints, a breakeven change and a bounded close-safe claim. The macro backdrop was mixed, and the full market close was not available at the snapshot time. The public evidence therefore carries the story without requiring the article to invent a perfect end-of-day number.
For readers, the next step is not to copy the old zone. It is to look for the same habits in a new session: a defined invalidation, checkpoints that can be verified, a protection update when the trade has paid, and an honest separation between channel-wide language and individual account screenshots.
The free lane is where readers can follow future public updates. If they want the additional access route, they can message @GTMOBest for free signals and FREE VIP channel access. Gold Trader Mo's public reports are designed to show the sequence clearly enough that a reader can decide whether the process deserves closer attention.
FAQ#
Was $10,000 a guaranteed result?#
No. The public record reported $10,000 closed safe while the remainder ran under breakeven. It is a bounded same-day channel claim, not a guarantee, audited statement or promise of future performance.
Was the September 21 market number a closing price?#
No. The same-day market snapshot captured an intraday spot of $4,348.08 at 14:02 GMT+7 and left the full-session close unavailable. The recap labels it as an intraday snapshot rather than a settlement.
How many member responses were there?#
Nine member feedback messages appeared in the same-day public record. Four community screenshots were selected, and the full gallery contains eight selected proof screenshots because it also includes four trading-sequence images.
Can I copy this old SELL setup?#
No. The setup is historical evidence from September 21. Any future trade needs a fresh market read, its own invalidation level, appropriate sizing and a risk decision that fits the reader's circumstances.
Where can I ask for the free signal lane?#
Message @GTMOBest for free signals and FREE VIP channel access.
Connect with Gold Trader Mo#
The September 21 recap is a public record of one fast sequence, not a promise that every session will end with five targets. Readers who value clear levels, visible protection updates and honest proof framing can follow Gold Trader Mo's next public report on the site and in the free Telegram lane.
To ask for free signals and FREE VIP channel access, message @GTMOBest. The contact route appears here because access should be clear, not hidden behind a generic “learn more” button.
What readers can expect from the public lane:
- A readable recap of the setup, the levels and the management decisions.
- Historical proof framed with timestamps and a clear distinction between channel claims and personal account screenshots.
- A direct way to ask about free signals and FREE VIP channel access through @GTMOBest.
This article is for education and market commentary only, not financial advice. Trading involves risk, capital can be lost, and past performance does not guarantee future results.