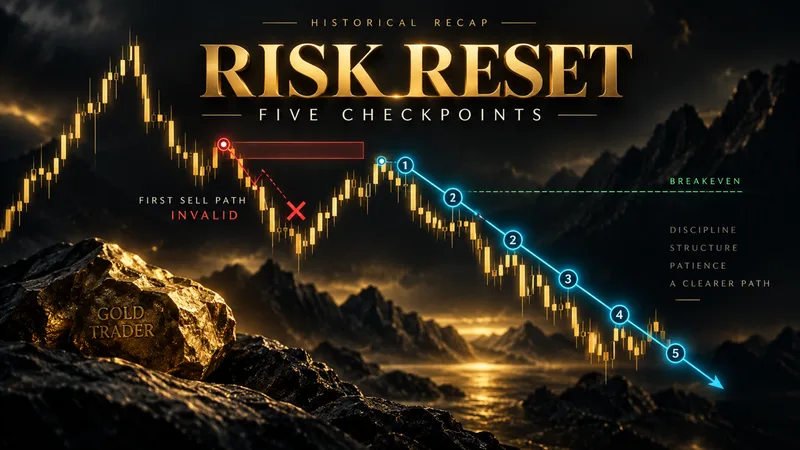
Market Snapshot#
Friday, September 18, 2026 was an open intraday session when this report was prepared, so the strongest story is the price path and the trade-management record, not a made-up daily close. The intraday snapshot placed XAUUSD at 4,378.97 at 11:41 UTC, or 18:41 GMT+7, after an intraday range that stretched from an approximate 4,235 post-Fed low to a 4,439.80 high. The same snapshot put DXY near 100.22 and the US 10-year yield near 4.98%, while the Federal Reserve target range remained 3.75%-4.00%. Final closes were not available at capture time.
The public @GTMO record then supplied the human story: a SELL sequence reached four targets, risk was moved to breakeven, and the result was later described as 140+ pips. A BUY sequence followed the reversal, reached four targets as well, and was later described as almost 100 pips. Readers who want free signals and FREE VIP channel access can message @GTMOBest before reading the detailed historical recap.
| Metric | Intraday snapshot |
|---|---|
| XAUUSD current spot | 4,378.97 at 11:41 UTC |
| XAUUSD day high | 4,439.80 |
| XAUUSD day low | Approx. 4,235 after the Fed move |
| DXY | 100.22 |
| US 10Y yield | 4.98% |
| Fed target range | 3.75%-4.00% |
This is context, not a live trading instruction. The market data describes the conditions around the record, while the proof below explains what Gold Trader Mo actually shared and how members responded.
Why The Tone Changed So Fast#
The tone changed because gold did not stay trapped in the first post-Fed reaction. The September 16 rate increase initially drove liquidation and a sharp downside sweep, but Friday's tape recovered in a V-shaped fashion as crude oil eased, inflation pressure looked less immediate, and the dollar cooled from its recent high area. That backdrop helps explain why both a downside sequence and an upside sequence could appear in the same day. It does not, by itself, prove that every account received the same fill or result.
The more useful editorial point is the order of events. The SELL call used a defined entry band, a clear risk cap, and staggered targets. Once the move paid, the public record showed a breakeven instruction rather than a demand to hold blindly. Later, when the market turned, the BUY call used a separate zone and separate invalidation. The day therefore reads as a protection-and-adaptation story, not as a single direction that worked without friction.
For comparison, the September 17 daily report also focused on a reset before the next push. That continuity matters because a historical recap should show how the desk behaves across changing tape conditions, not treat every green screenshot as the same setup.
Technical Outlook#
The market context identified 4,400 as the immediate psychological and structural boundary, with 4,439.80 as the session high. On the downside, 4,380 was the nearby reaction area, 4,335 the next intermediate support, and approximately 4,235 the post-Fed trend floor. A sustained close above 4,400 would have been needed to confirm a broader bullish shift; an intraday touch alone was not enough.
Those levels are included to explain the environment around the historical calls, not to tell a reader what to buy or sell now. The first SELL entry at 4,387-4,391 sat just beneath the key 4,400 area and used 4,395 as its published stop. The later BUY entry at 4,379.8-4,376 appeared near the reaction zone and used 4,372 as its stop. Both examples show why entry, invalidation, and target structure must be read together.
The September 16 four-target report provides another useful reference point: target progression is most informative when the reader can also see the risk boundary and the session conditions. Past levels are not promises about the next candle, and the intraday market can invalidate a clean-looking historical map quickly.
Trading Signals#
Signal 1: SELL sequence#
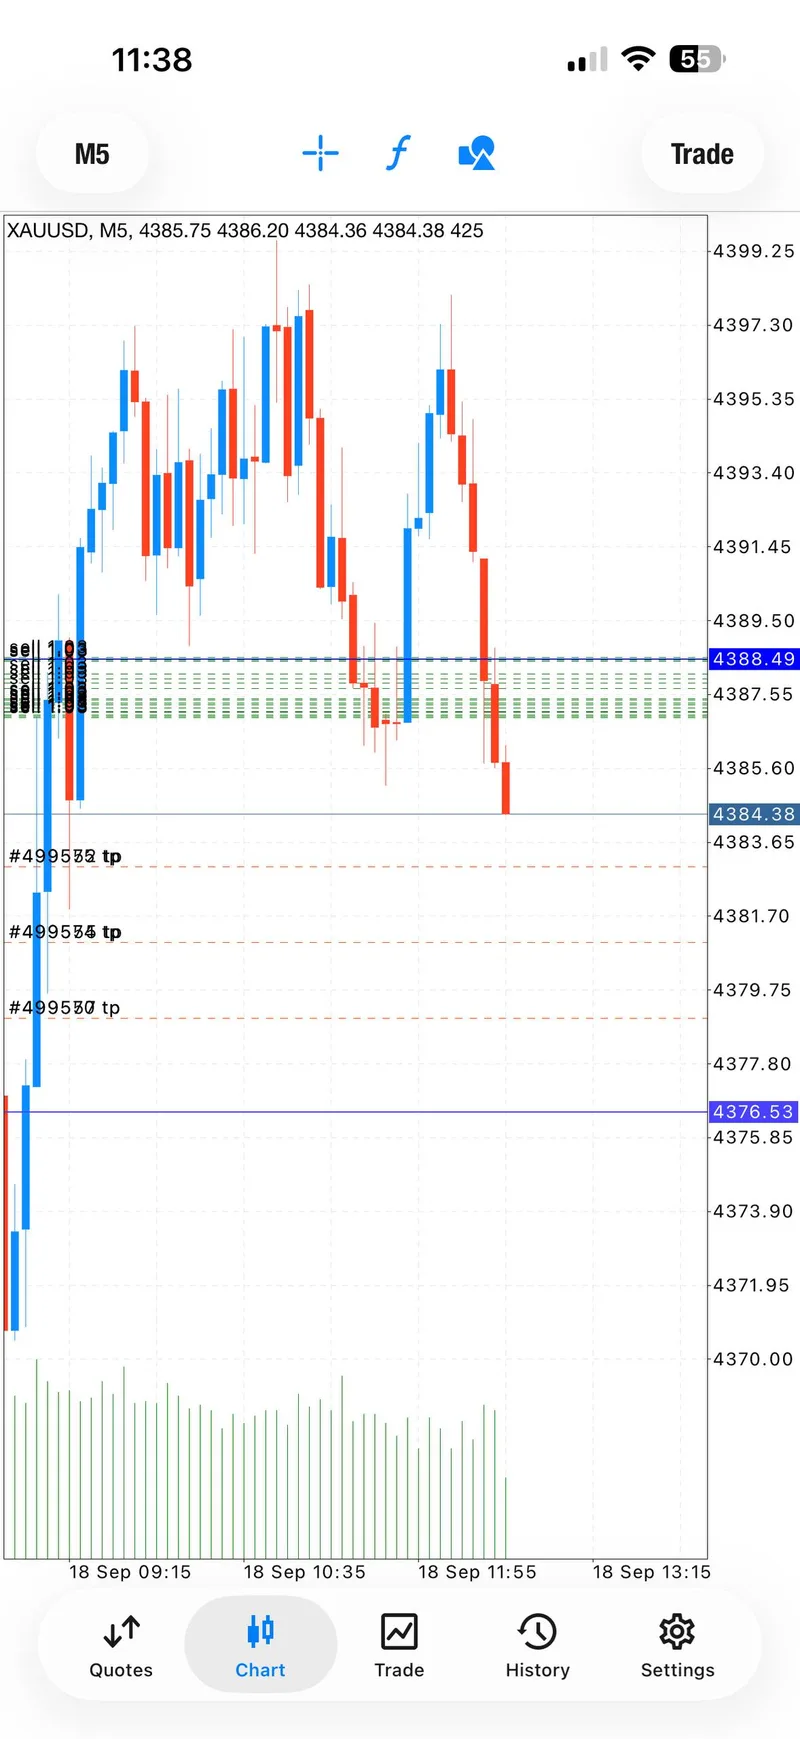
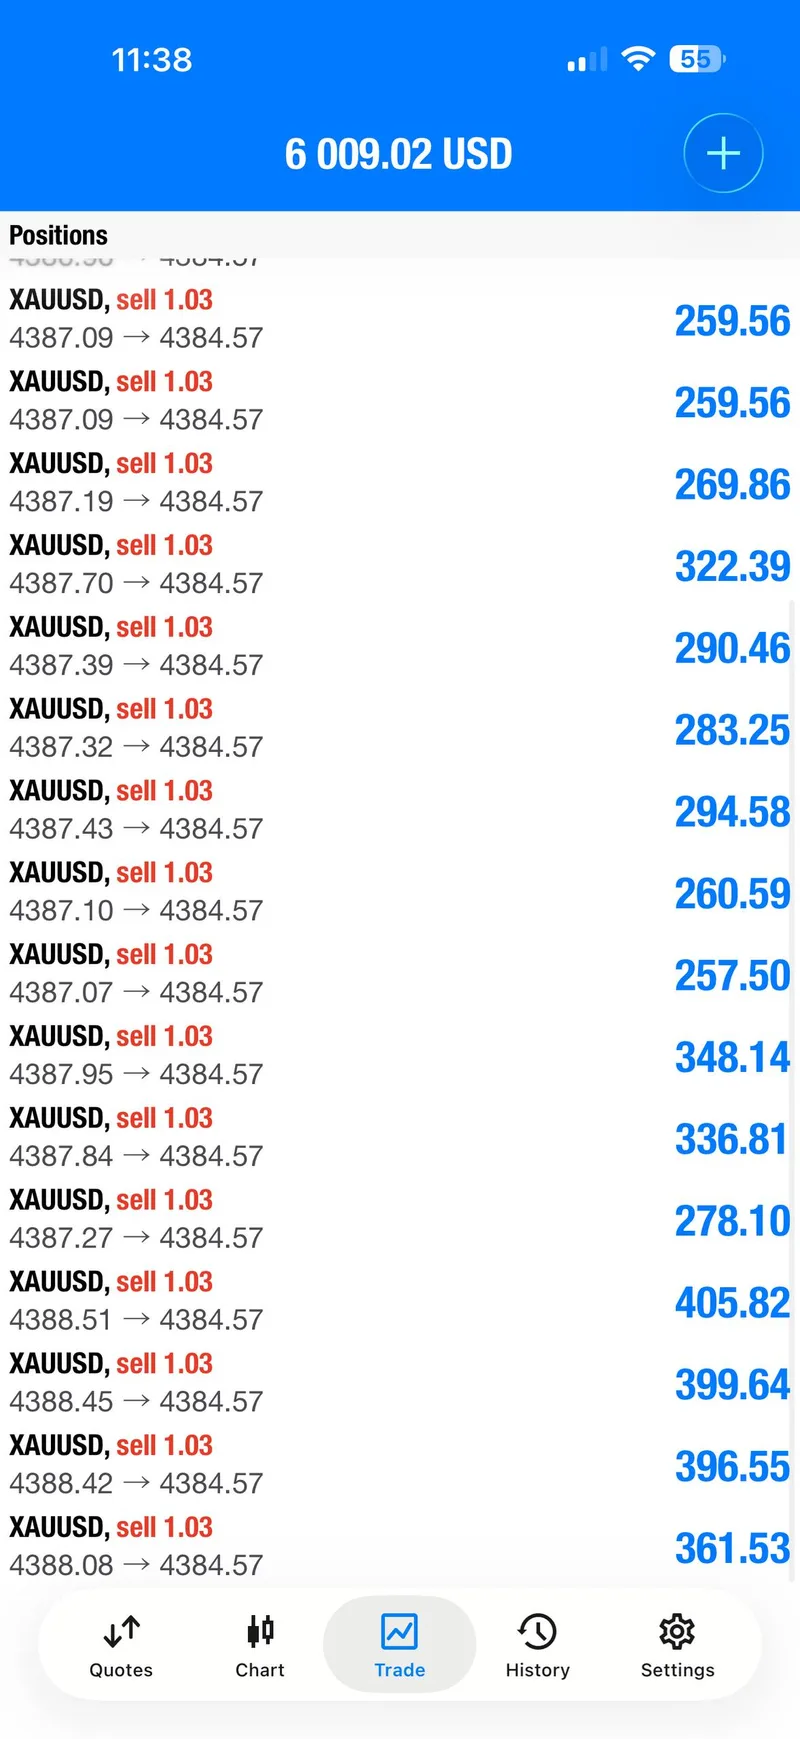
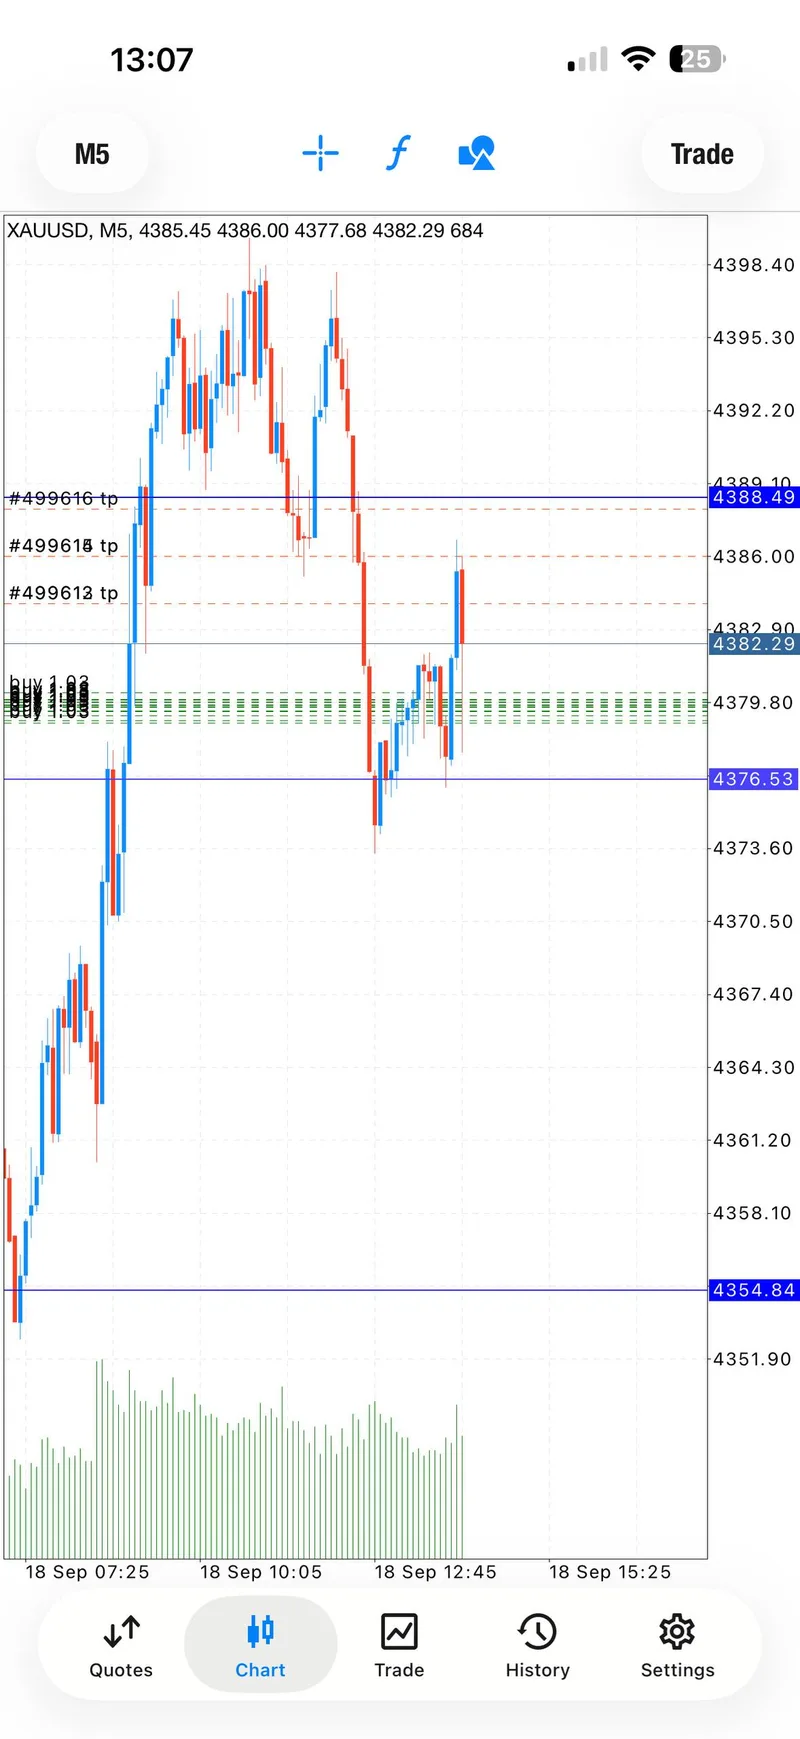
The first public setup was a SELL from 4,387-4,391 with a 4,395 stop and staged targets at 4,385, 4,383, 4,381, and 4,379. The record showed the first target, then later target progress, followed by a breakeven instruction for zero-risk management. The public follow-up said all four targets were complete and later described the move as 140+ pips.
That claim is bounded to the public channel record. It is not an audited broker statement and it does not establish a universal return. What it does establish is a same-day sequence: the entry band was published, the risk was adjusted after progress, and four planned targets were reported complete.
Signal 2: BUY sequence#
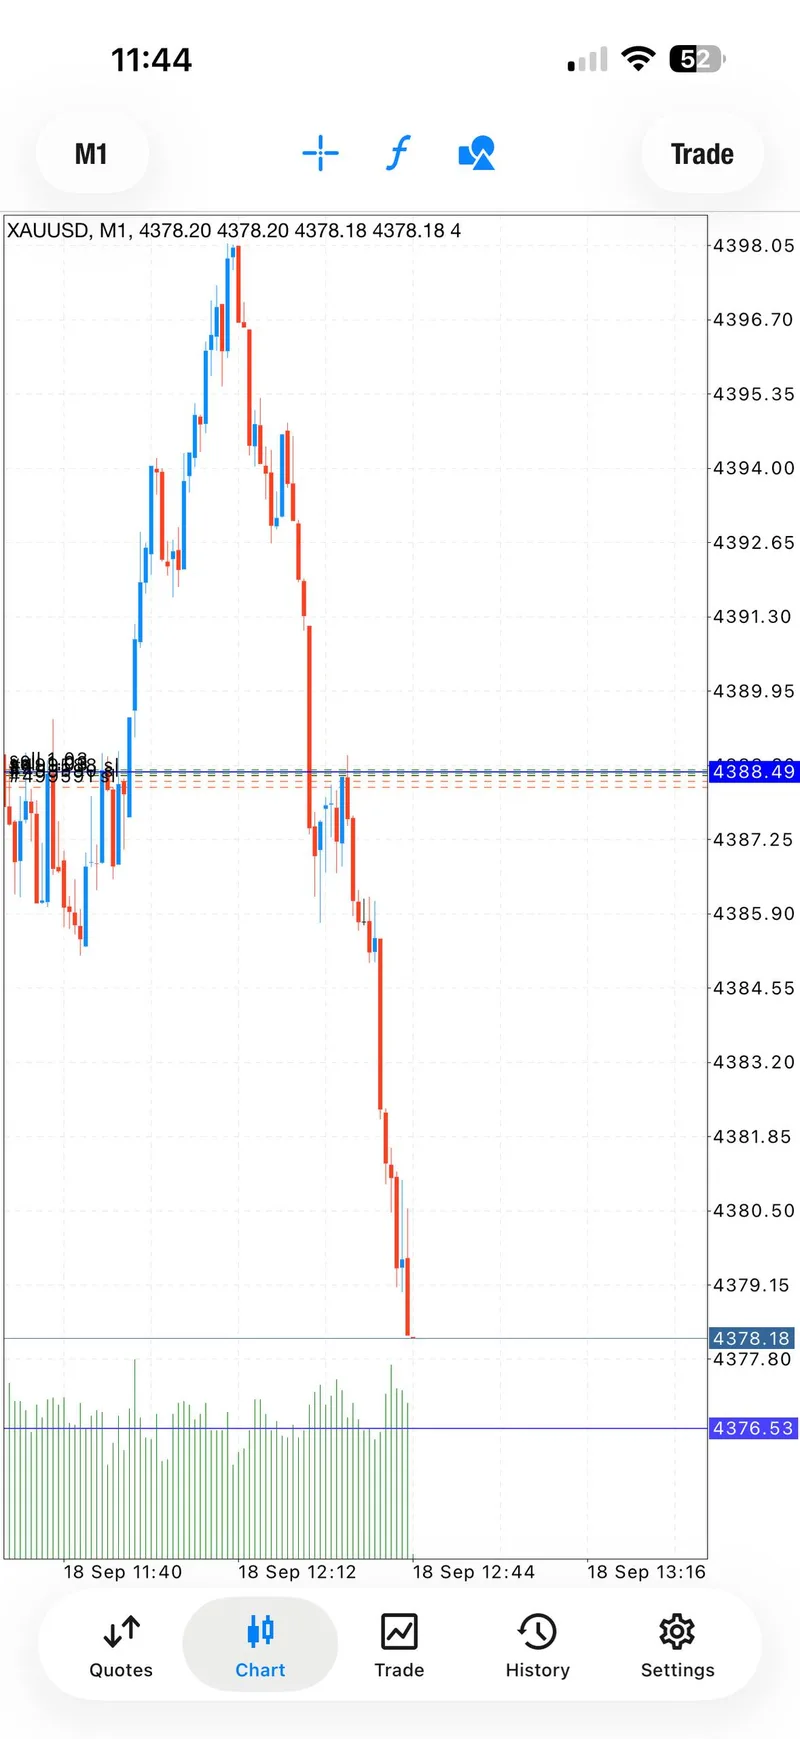
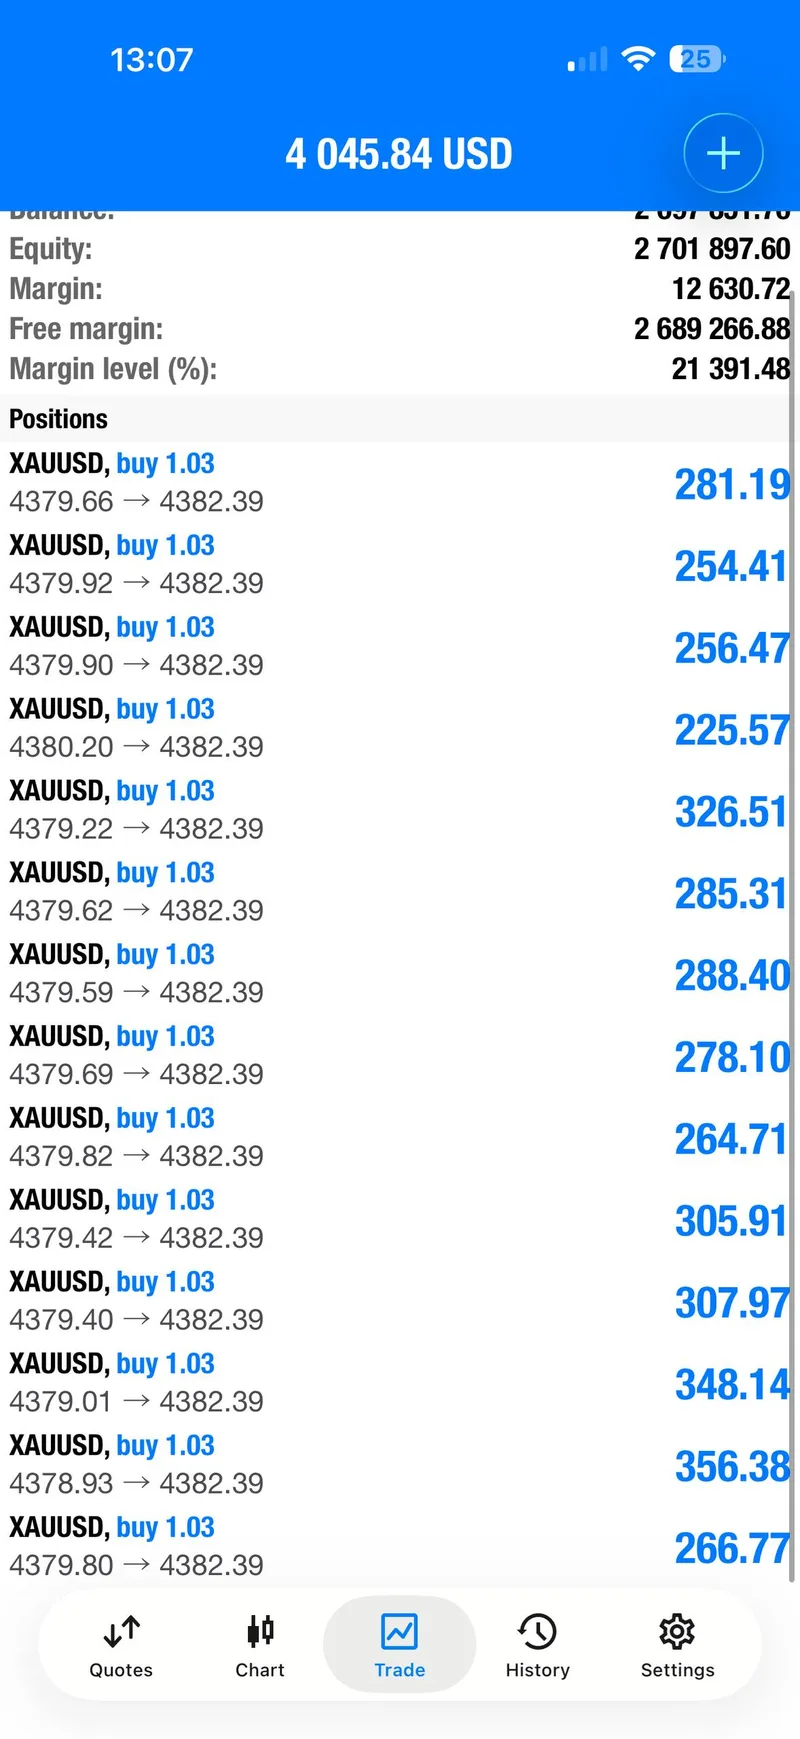
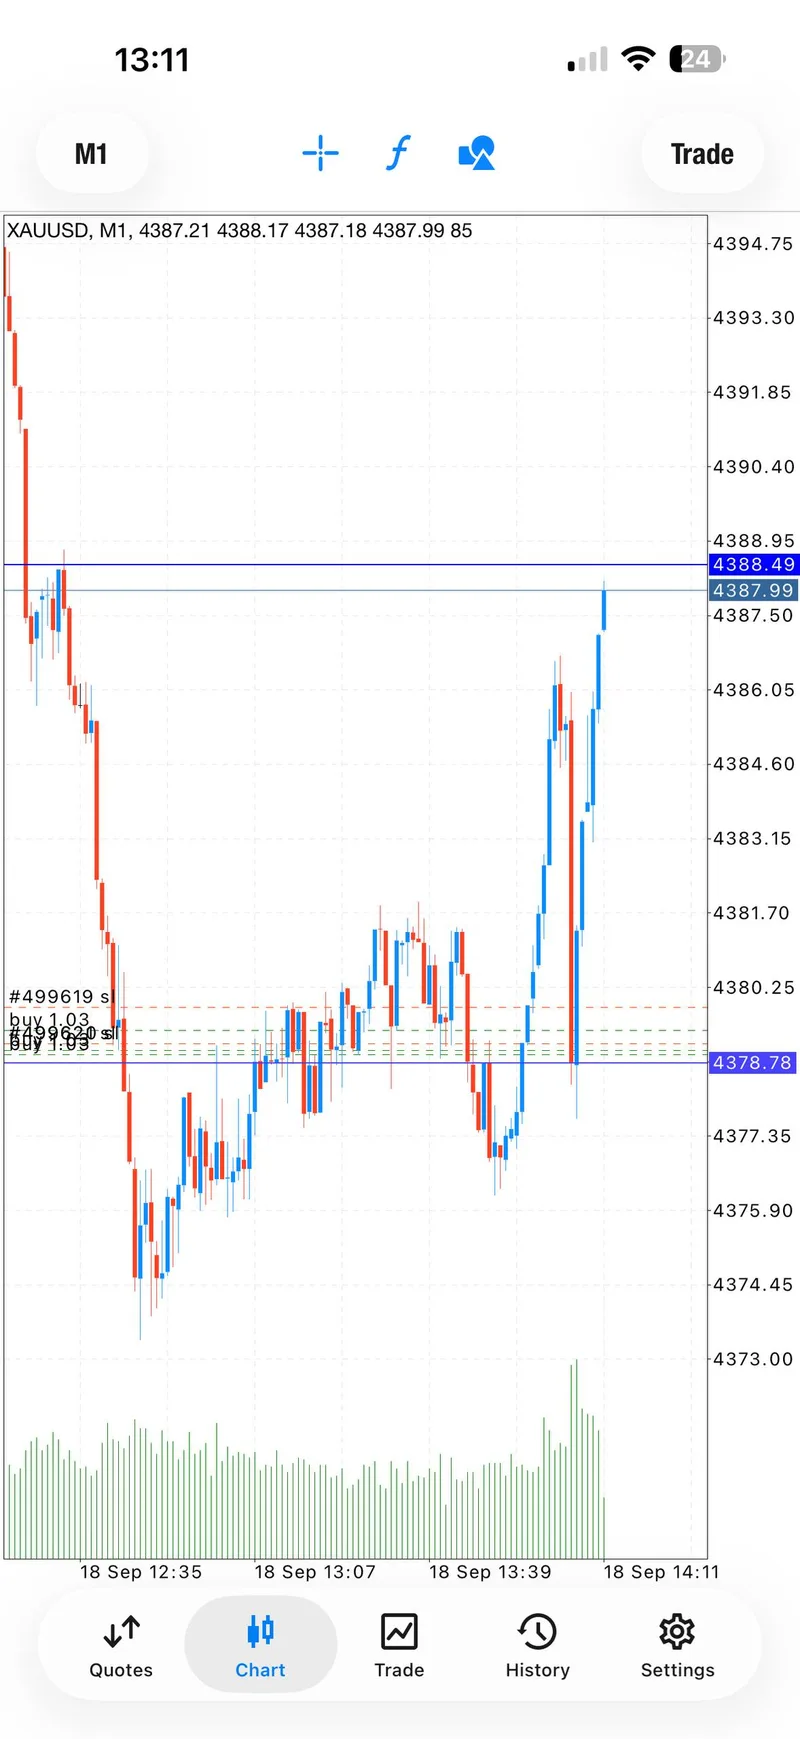
The second public setup was a BUY from 4,379.8-4,376 with a 4,372 stop and staged targets at 4,382, 4,384, 4,386, and 4,388. The follow-up again moved through the target ladder, then posted a breakeven update before the record reported all four targets complete. The final public wording described almost 100 pips.
The contrast with Signal 1 is the point. The two directions were not one blended claim; they were separate ideas with separate entry bands, stops, and target ladders. A historical reader can evaluate the sequence without mistaking it for a current entry alert.
Signal Performance Breakdown#
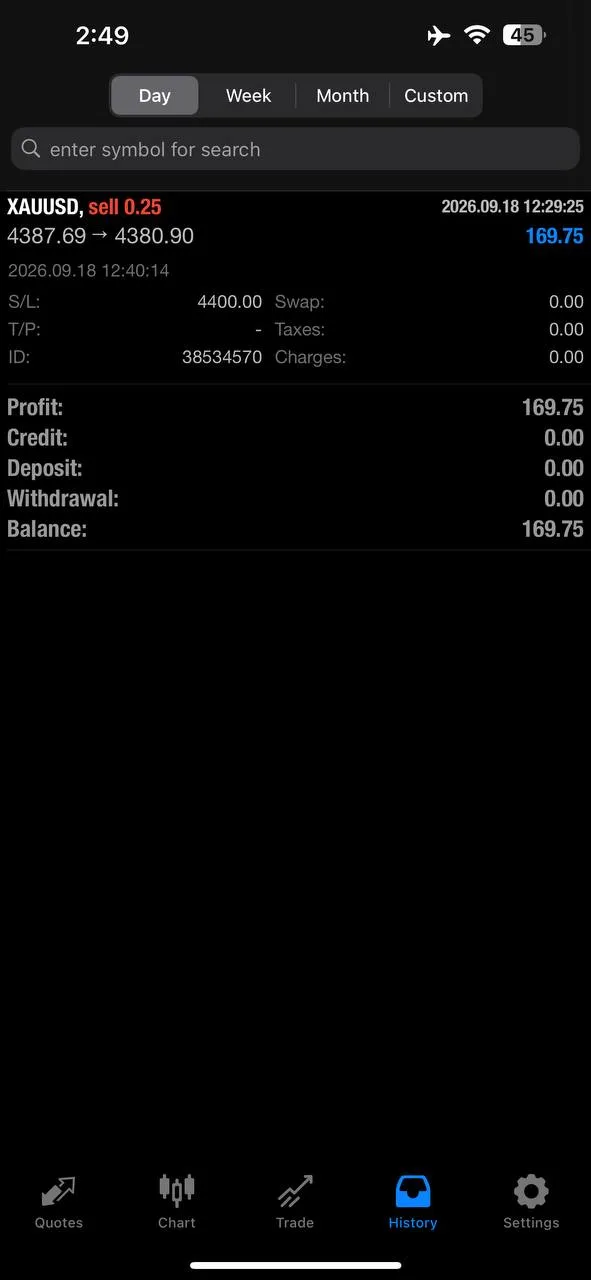
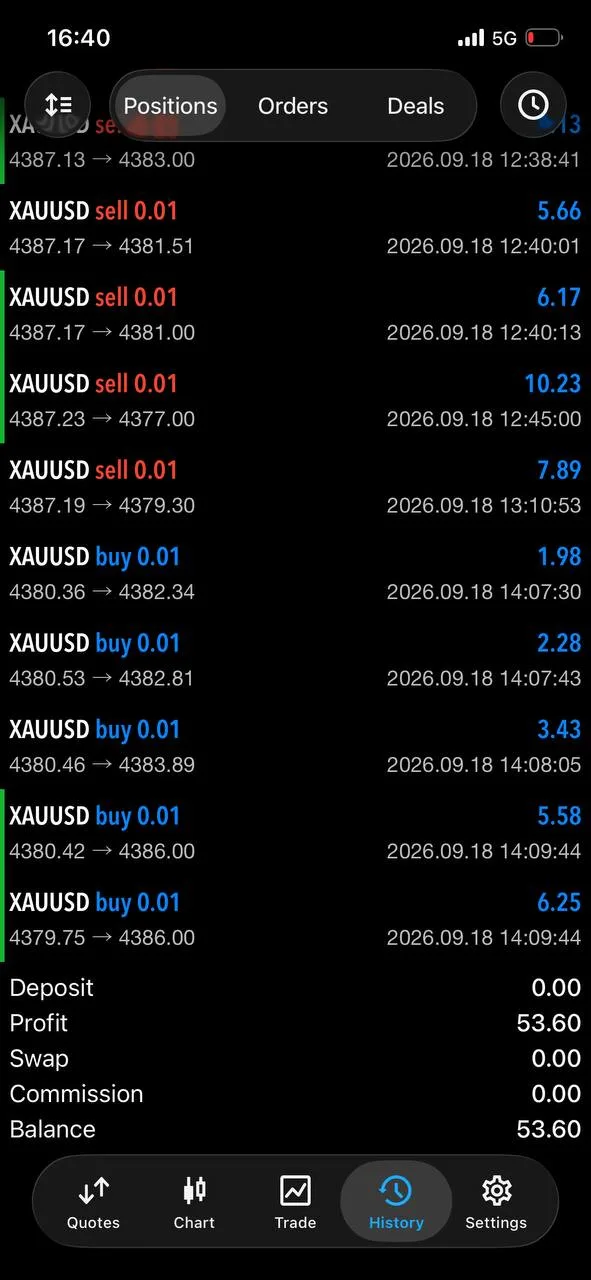
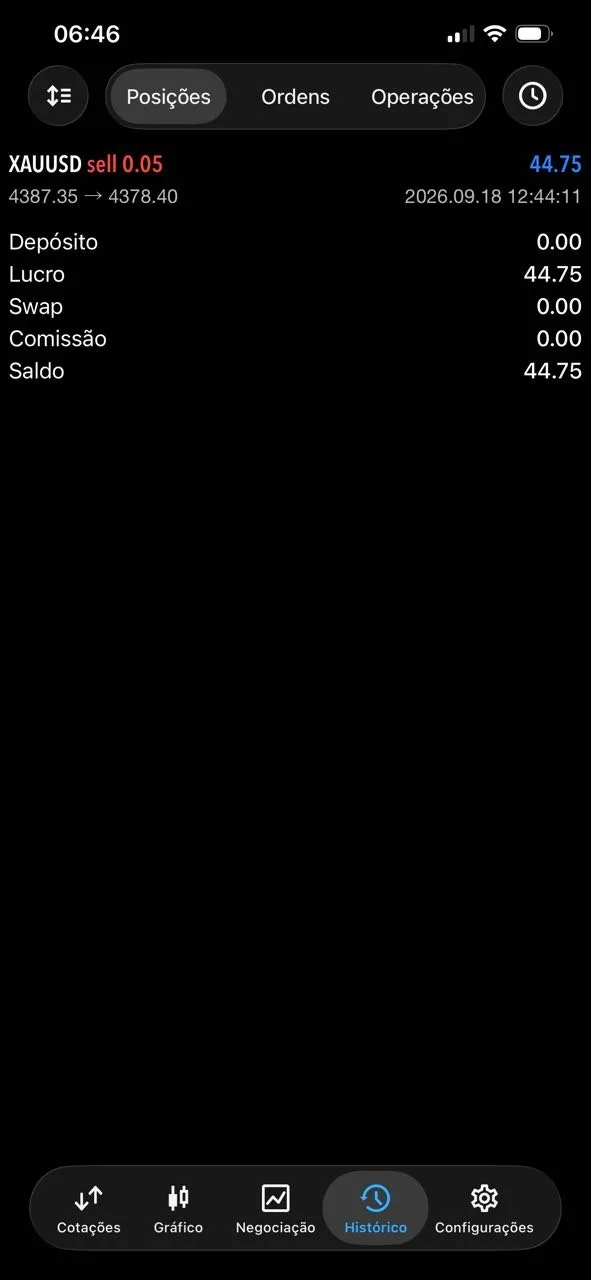
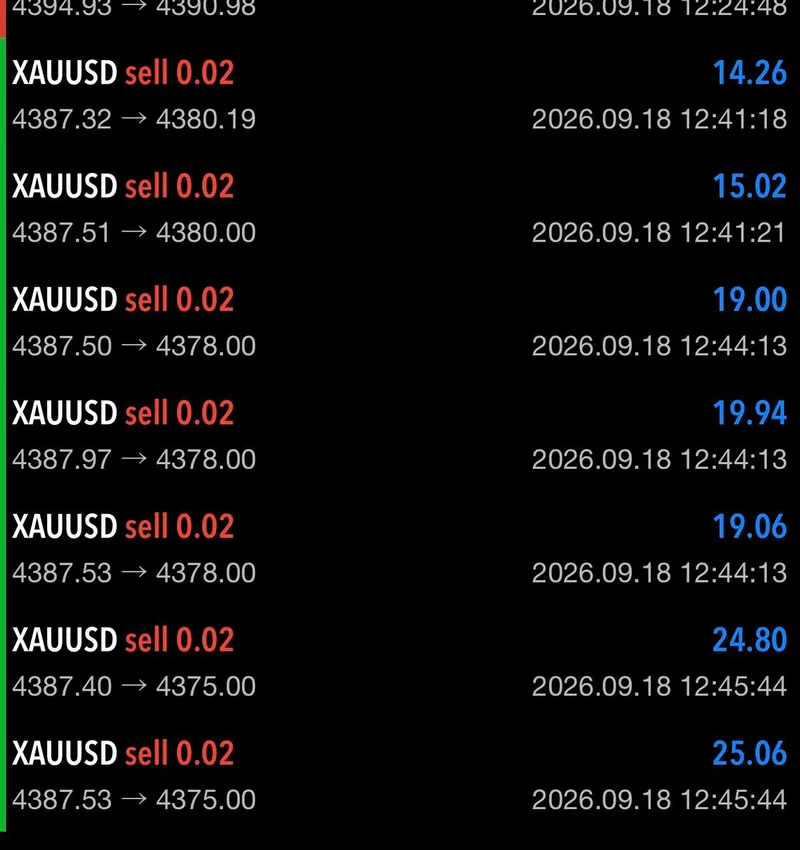
The strongest same-day claim is simple: two opposing XAUUSD setups each reached four targets. The SELL sequence was described at 140+ pips after protection was moved to breakeven, and the BUY sequence was described at almost 100 pips. One channel post also said that more than $13,000 had been secured with no entries left open. That is a self-reported account-level statement, so it belongs in context rather than as a promise to readers.
The response around the calls adds a second layer of evidence. There were exactly 45 member feedback messages in the same-day record, while 10 public proof screenshots are shown with this report: six tied to the two trading sequences and four member-posted views. The counts are intentionally different. Message volume describes the full response; screenshot count describes the clearest visual proof.
One member reported making $750 that day, and another public member result referenced $4.5K. Those are individual reports. They help show why the room reacted strongly, but they do not mean every account had the same balance, lot size, entry, execution, or outcome. The selected account screenshots should therefore be read as personal evidence, not a standard result.
The September 15 risk-reset report makes the same distinction between a protected sequence and an account-specific result. Across all of these recaps, the trustworthy unit is the documented process: what was posted, how risk was reduced, and what was later reported.
Execution Lessons#
First, a defined stop makes the story legible. The SELL sequence had 4,395 as its published invalidation and the BUY sequence had 4,372. A stop does not remove risk, but it gives the reader a concrete boundary instead of a vague claim that the market was always under control.
Second, staged targets create checkpoints. Reporting 4,385, 4,383, 4,381, and 4,379 separately is more informative than only saying “the trade won.” The same is true for 4,382, 4,384, 4,386, and 4,388 on the BUY. A target ladder shows how a fast market was managed in pieces.
Third, breakeven language matters. Moving risk after progress can protect a trade from turning a winner into an avoidable loss, but it does not guarantee the remaining targets. The record on September 18 shows protection being discussed before the final result, which is a useful lesson even for a reader who never follows the exact setup.
Finally, a reversal should be described as a reversal. The second BUY did not erase the uncertainty of the earlier SELL; it showed that the desk adapted when structure changed. Good reporting keeps those facts in the same frame and avoids rewriting the day as an effortless one-way prediction.
What The Day Means Going Forward#
For a historical reader, September 18 is a case study in flexibility under macro pressure. The intraday high near 4,439.80, the 4,400 boundary, and the nearby 4,380 reaction zone explain why the tape could switch quickly. The two public sequences show one way traders attempted to manage that switch: publish a zone, define invalidation, take staged targets, and reduce risk as the move paid.
Going forward, the useful questions are structural rather than promotional. Did price hold or reject the 4,400 area? Did 4,380 and 4,335 act as support on retests? Did the post-Fed floor near 4,235 remain protected? These are observation points for future reporting, not instructions to enter a live trade. Readers should use their own risk plan and understand that past performance never guarantees the next session.
The member response also matters because it keeps the report human. Thank-you messages, personal account screenshots, and the $750 report show that the record was meaningful to people in the room, while the exact counts and captions keep that enthusiasm bounded. For free signals and FREE VIP channel access, readers can contact @GTMOBest and ask about the current channel options.
FAQ#
Were both September 18 setups reported at four targets?#
Yes. The public @GTMO record reported all four listed targets for the SELL sequence and all four listed targets for the BUY sequence. The reported distances were 140+ pips for the first and almost 100 pips for the second. These are historical channel claims, not audited guarantees.
Why are the 45 feedback messages and 10 screenshots counted separately?#
The 45 figure is the exact total of same-day member feedback messages. The 10 figure is the number of public proof screenshots used in this recap, split into six trading screenshots and four member screenshots. A message can be useful context without being a clear visual proof frame, so the two counts answer different questions.
Is this a live gold signal?#
No. This is a past-session editorial recap. Price, spreads, liquidity, fills, and risk can change, and any reader considering a trade must make an independent decision with capital they can afford to lose.
Connect with Gold Trader Mo#
Follow Gold Trader Mo for the broader report library, then message @GTMOBest for free gold signals and FREE VIP channel access. The free lane is the best place to see the next public update, ask questions about the channel, and compare future evidence with this September 18 recap.
What readers can expect from the public lane:
-
Historical signal recaps that show entry zones, target progression, and protection notes when the record supports them.
-
Clear separation between channel claims, member feedback, and individual account screenshots.
-
A direct way to ask @GTMOBest about free signals and FREE VIP access without treating old results as a promise.
This report is for education and commentary only. Trading involves risk, capital can be lost, and past performance does not guarantee future results.