Market Snapshot#
This is a historical recap of the public Gold Trader Mo record from September 16, 2026. It is not a live instruction and it does not turn an unfinished market session into a made-up closing price.
At 21:00 GMT+7, the visible market snapshot put spot gold at $4,327.53 after a wide intraday move from $4,275.60 to $4,360.39. The US session was still open, so a daily XAUUSD close was not available. The same snapshot placed the Dollar Index near 99.702, the US 10-year yield near 4.97%, and WTI near $104.63. The pre-decision Federal Reserve target range was 3.50%–3.75%; a VIX reading was not exposed in the reconciled snapshot.
| Market input | September 16 snapshot | How to read it |
|---|---|---|
| XAUUSD spot | $4,327.53 | Intraday observation, not a close |
| Intraday range | $4,275.60–$4,360.39 | Wide, volatile session |
| Dollar Index | 99.702 | Intraday context |
| US 10-year yield | 4.97% | Intraday context |
| WTI crude | $104.63 | Intraday context |
| Fed target range | 3.50%–3.75% | Pre-decision range |
Those numbers explain why the public record repeatedly used caution around the US-session and FOMC window. They provide context, not a promise that the next candle will repeat the same move. For readers who want to compare the historical snapshot with the visible market pages, the XAU/USD historical table, DXY history, and US 10-year yield history are the relevant reference points.
Why The Tone Changed So Fast#
The public channel record began with patience. At 09:31:43 UTC, the desk described gold as consolidating and said that lower-timeframe ideas would carry higher risk. That message matters because it shows the starting posture: wait for structure instead of manufacturing a trade because the screen is moving.
The tone changed at 10:05:12 UTC with a ready notice, followed two minutes later by a simple gold-buy message. The complete details arrived at 10:06:47 UTC. Within three minutes, the record moved from an entry plan to a second-checkpoint update. At 10:10:03 UTC, the desk told readers to move protection to a risk-free level as the third checkpoint approached. By 10:10:57 UTC, the public update said all four fixed checkpoints had been reached.
That speed can look like hindsight when it is presented as a single celebratory screenshot. The timestamped sequence is more informative: caution, a defined plan, staged confirmation, a protection reset, and then a completed move. The September 15 risk-reset recovery report is a useful comparison because that session started with a failed idea and then recovered. September 16 was a cleaner follow-through day, but the common thread was waiting for evidence before increasing exposure.
Technical Outlook#
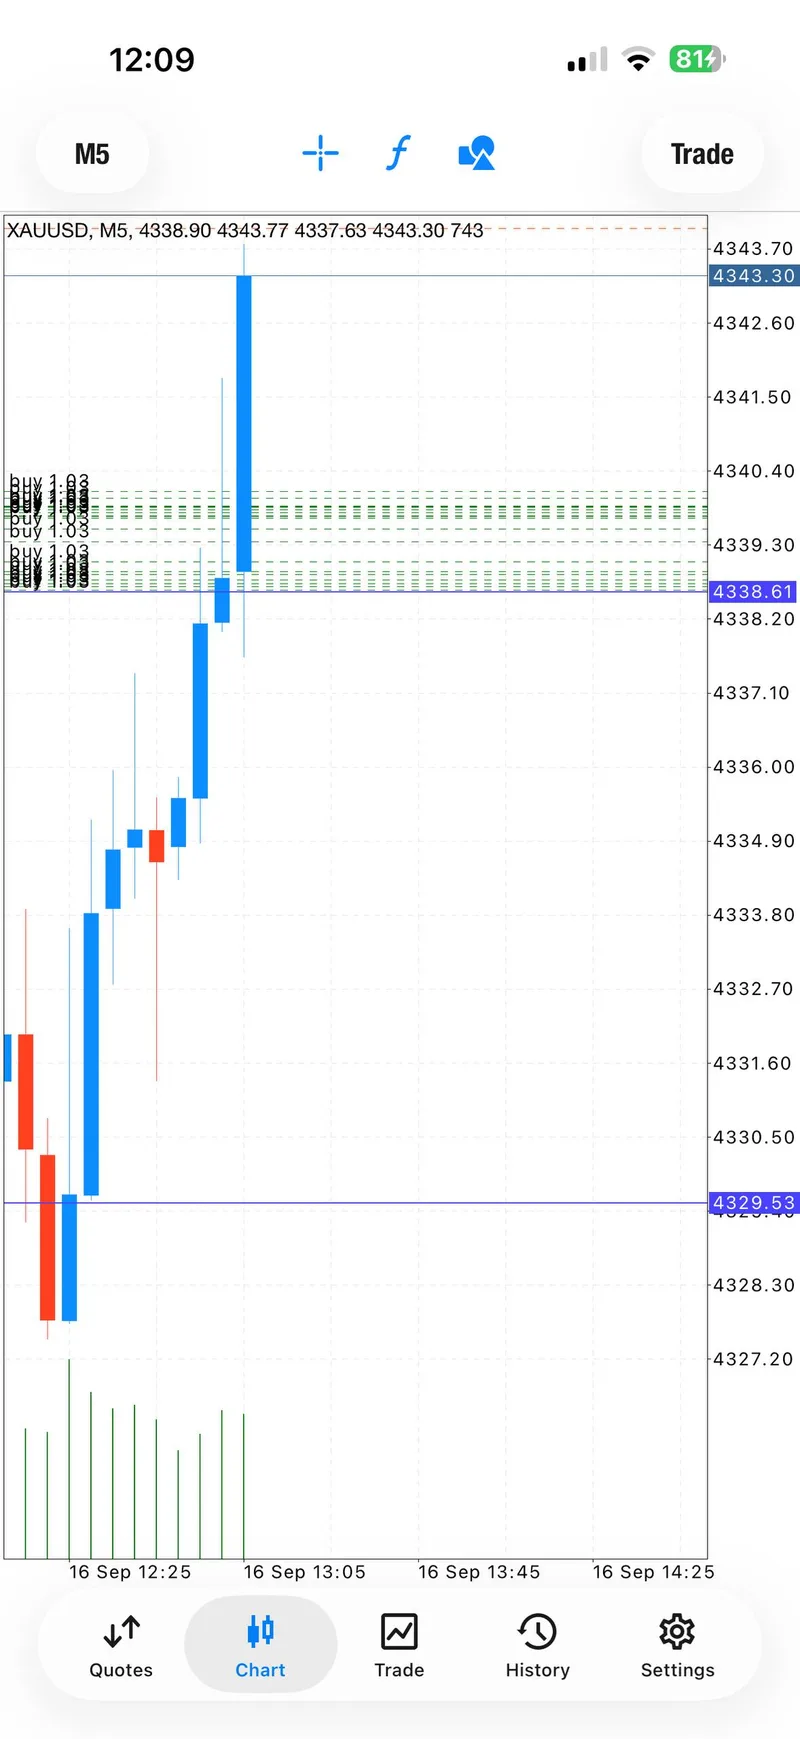
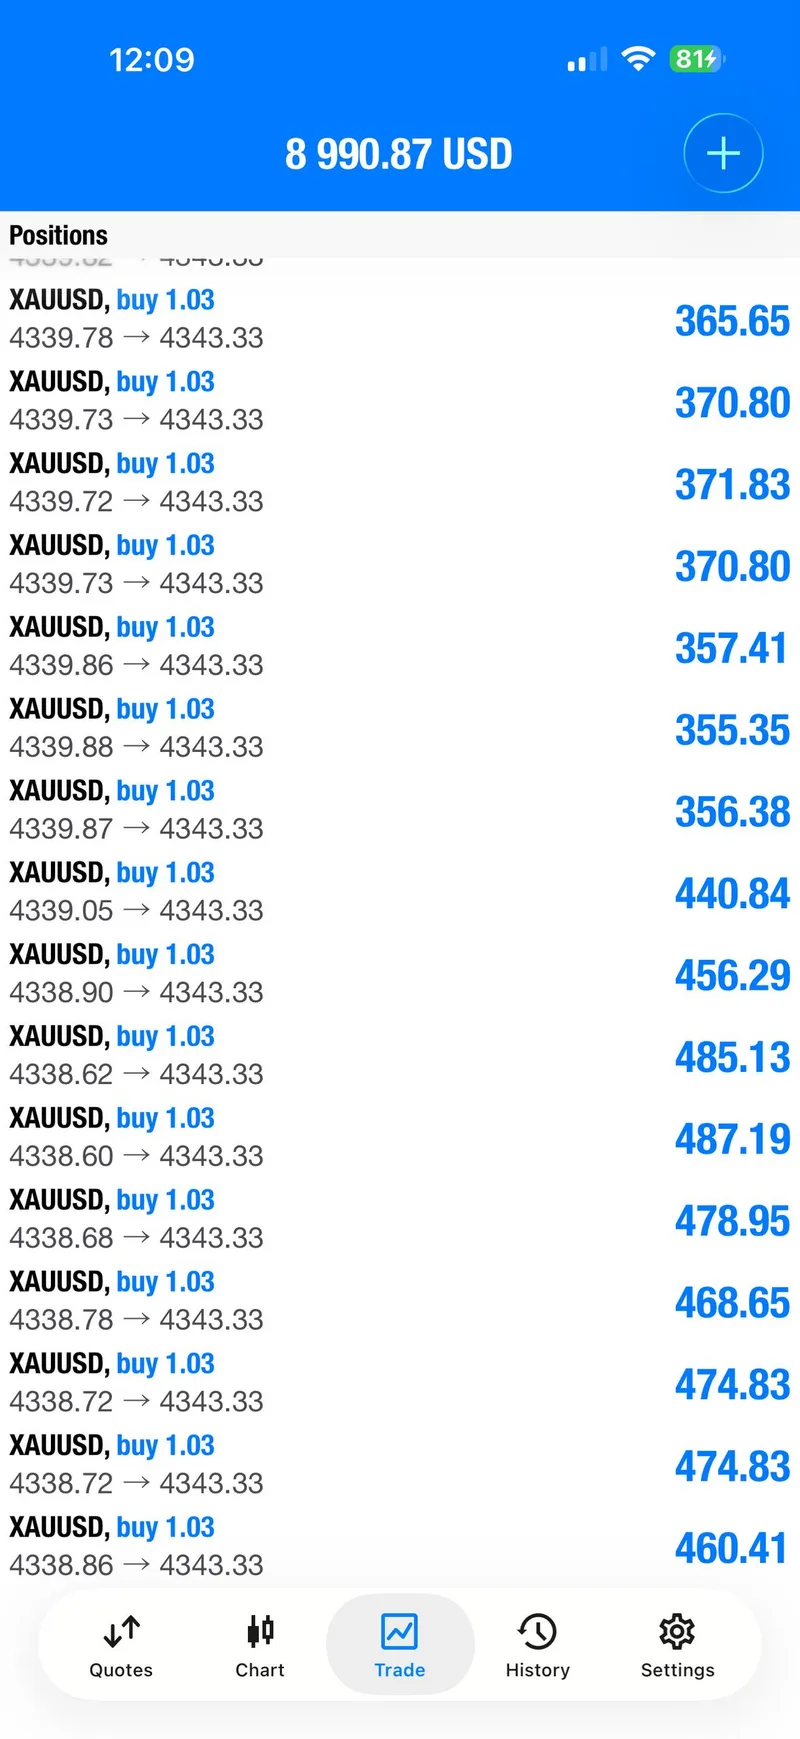
The public setup used a 4,340–4,336 entry area, with protection at 4,332 and four fixed targets at 4,342, 4,344, 4,346, and 4,348. A final runner was left open rather than given an invented exit price. This is the level map that can be checked against the chart and trade-log screenshots in the gallery below.
The broader intraday snapshot supplied a separate context map: $4,300 was the first support reference, followed by $4,250, while $4,354 and $4,400 were the nearby resistance references. Those levels are not a new recommendation. They simply show how the completed 4,340–4,336 idea sat inside a much larger, volatile range.
A reader comparing this session with the September 14 four-target report will notice the difference between a repeated process and a repeated outcome. The process is to define the invalidation point, take progress in stages, and reduce risk when the move has paid. The outcome depends on the market and cannot be promised in advance.
Trading Signals#
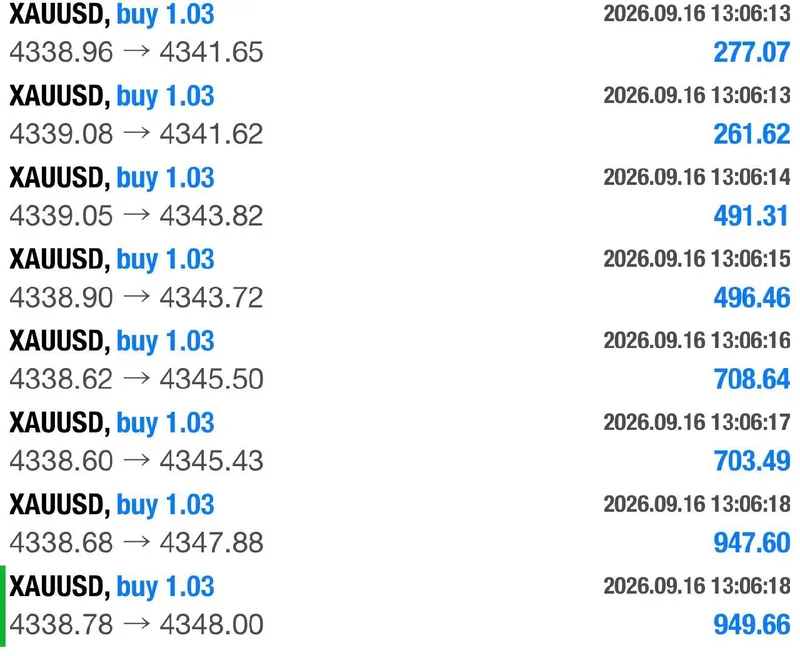
The canonical public setup#
There was one fully parameterized setup in the September 16 record. The earlier “Gold buy now” line was an opener, not a second independent trade. Counting both as separate signals would inflate the day’s story.
- Direction: gold buy.
- Entry area: 4,340–4,336.
- Protection: 4,332.
- Fixed checkpoints: 4,342, 4,344, 4,346, and 4,348.
- Runner: open-ended in the public message, with no fabricated final exit.
The public message also carried the ordinary warning that trading is not financial advice and that readers act at their own risk. The setup therefore has a clear boundary: it is evidence of what was posted that day, not an invitation to copy an old price.
The minute-by-minute follow-through#
The sequence is unusually compact. At 10:09:21 UTC, the public record posted the first burst of momentum. At 10:09:40 UTC, the second checkpoint was called. At 10:10:03 UTC, the third checkpoint was close and the desk instructed readers to move protection to break-even. At 10:10:28 UTC, the third checkpoint was confirmed. At 10:10:57 UTC, the message said that all four fixed checkpoints had been reached.
The follow-through did not end with the first burst. At 10:27:20 UTC, the record noted three runners moving back up. At 10:31:24 UTC, a public recap described a 100-plus-pip move in less than five minutes and listed all four checkpoints. At 11:07:37 UTC, one more runner was closed while two were left with protection at break-even. This is the part of the day that makes the recap useful: the plan was allowed to work, but the risk was repeatedly narrowed as the move extended.
Signal Performance Breakdown#
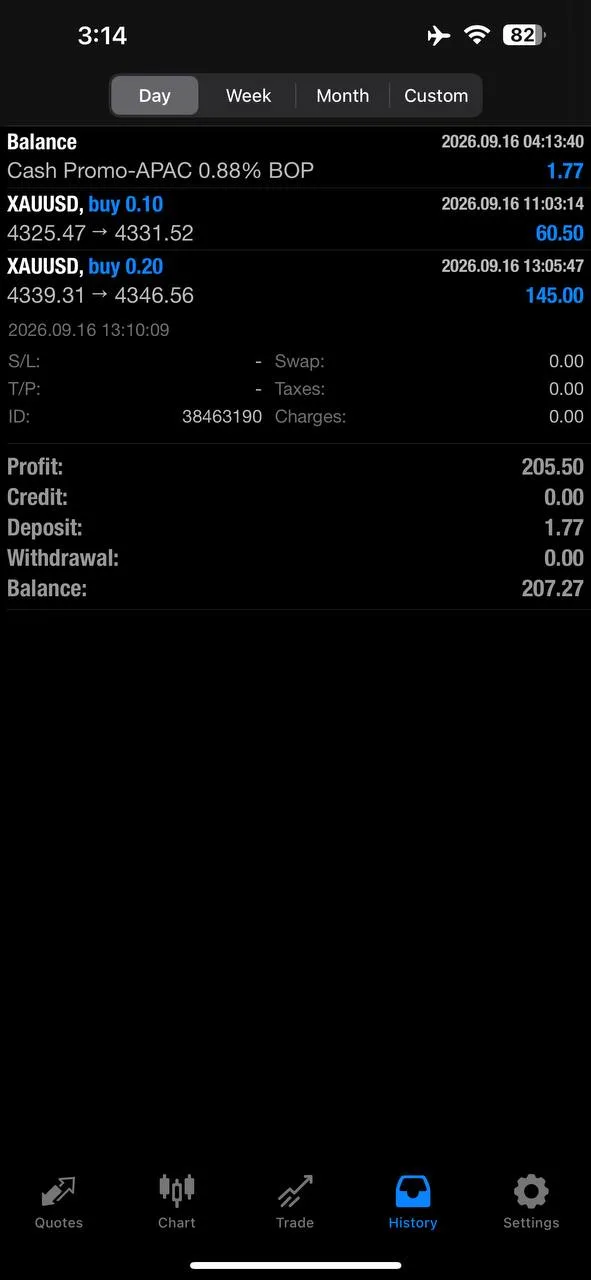
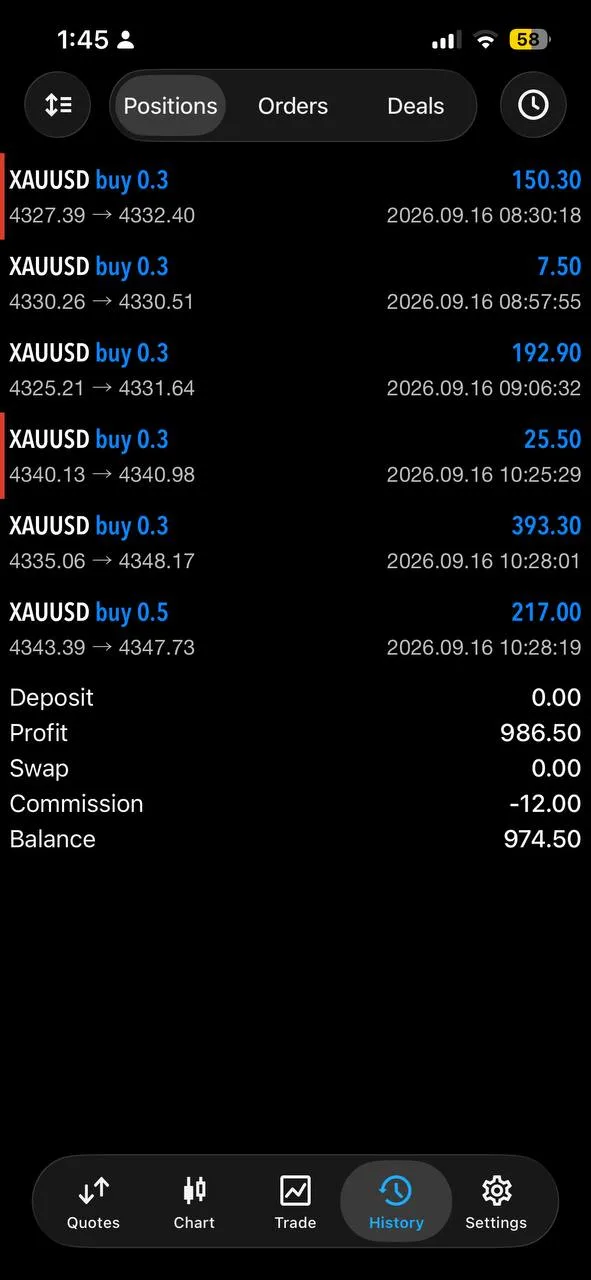
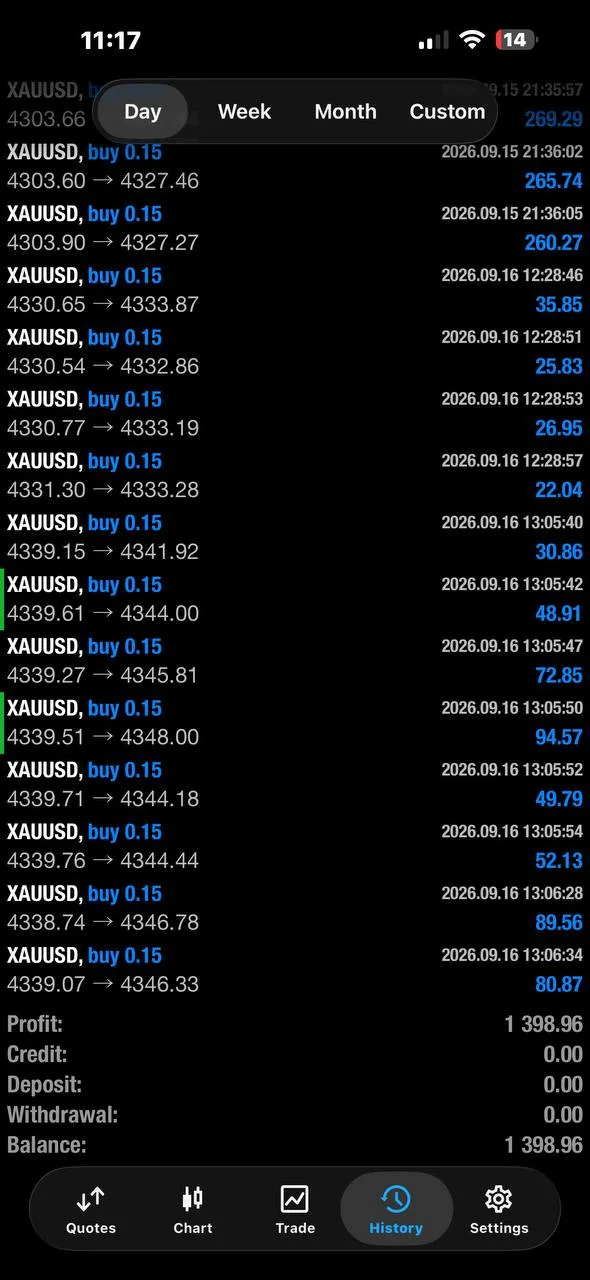
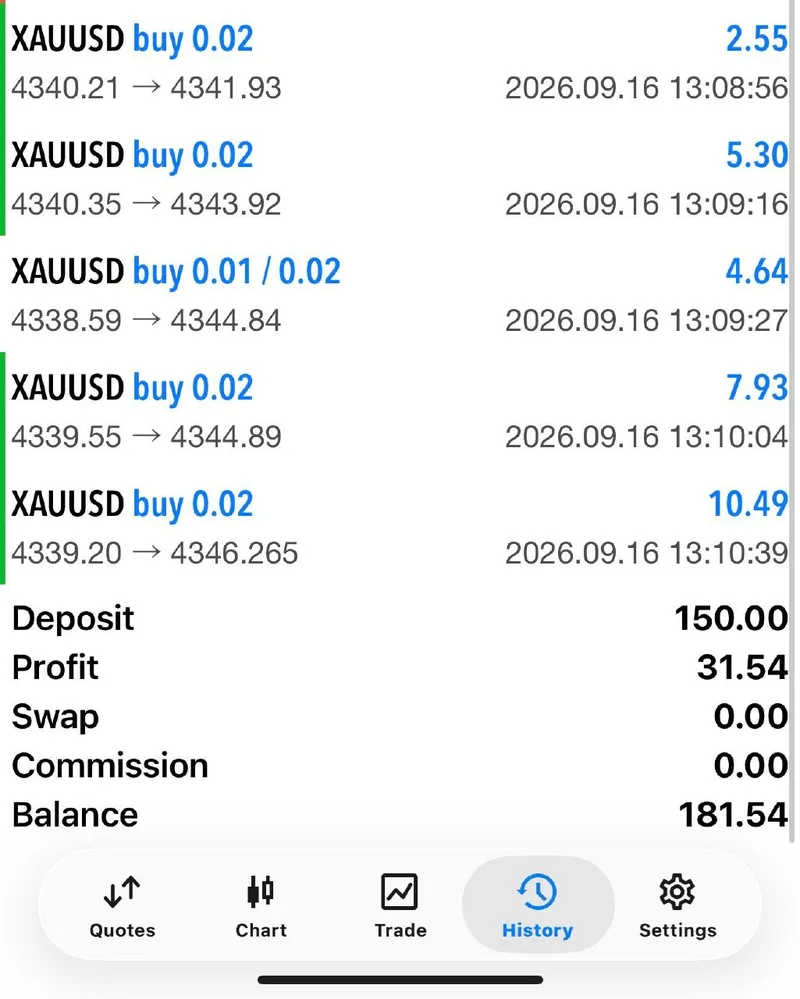
The public record for the day contains 122 messages. Of those, 106 are GTMO-authored channel messages and 16 are member feedback messages. There are 55 media-bearing messages and 32 photos available in the evidence set. These are record counts, not a claim that every message represents a separate trade.
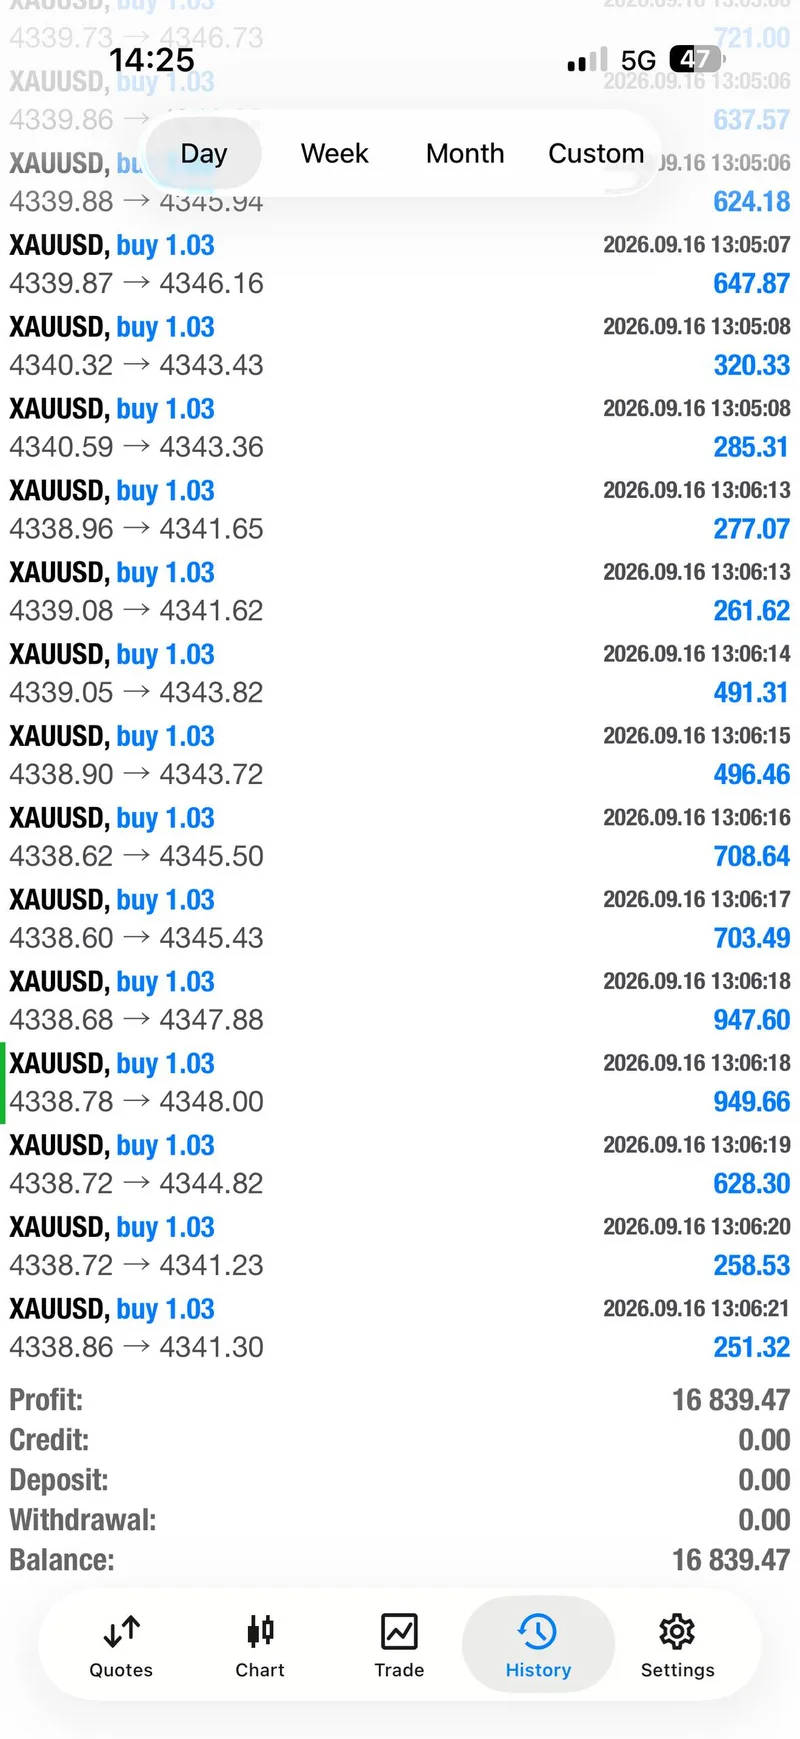
The strongest same-day account claim came later in the public record: “$16,800+ today profits” after one winning trade and four checkpoints. One attached account-history screenshot displays $16,839.47. That figure is a self-reported, account-specific result visible in the screenshot; it is not audited performance, a guaranteed return, or a result every reader should expect.
The member layer adds useful context without changing that boundary. Nick wrote that he could only enter one lot and closed at the third checkpoint. J reported a $600 result. Aaron wrote “nearly £1,400,” while his screenshot visibly includes rows dated both September 15 and September 16, so the full displayed total is not assigned to September 16 alone. Muhammad wrote that all four checkpoints were reached and shared a small-account history view. Four of those visual records are selected for the gallery because they are legible and tied to a named public message; they are not presented as a survey of every member outcome.
This distinction is also why the September 11 two-setup report remains a useful internal comparison. That report has a different count and structure. A trustworthy daily recap keeps the day’s own message count, setup count, and selected proof count separate instead of merging them into one impressive-looking number.
Execution Lessons#
The first lesson is patience. The 09:31 UTC consolidation note could easily have been followed by a low-quality chase. Instead, the public record waited for a defined zone and a defined protection level. That waiting period is part of the trade, not empty space before the exciting screenshot.
The second lesson is to make risk changes visible. Moving protection to break-even near the third checkpoint changed the emotional shape of the trade. Once the move had paid for some of the risk, the desk could close one runner, leave two with protection, and avoid turning a winning sequence into an unbounded gamble.
The third lesson is to describe evidence at the right scale. A chart can show where entries clustered. A history view can show what one account displayed. A member message can show what one reader reported. None of those items, alone or together, proves a universal return. The cleanest editorial claim is narrower and stronger: the public record shows one clearly defined gold idea, rapid staged progress, a visible risk reset, and multiple same-day reactions.
Finally, a historical report should resist the temptation to backfill missing data. Because the US session was open at the market snapshot time, there is no honest daily close to print. Because the runner was left open in the message, there is no honest final runner price to invent. That restraint is part of professional reporting.
What The Day Means Going Forward#
September 16 shows why a public process can be more persuasive than a loud result. The day had a recognizable arc: consolidation, a single parameterized idea, four quick checkpoints, protection moved to break-even, and a later runner update. The account screenshot and member messages make the outcome tangible, but the sequence is what lets a reader evaluate the work without relying on a slogan.
It also shows the value of stopping. After the bullish move, the desk described the market as being at the top, warned that another lower-timeframe idea would be higher risk, and chose to watch around the US-session and FOMC window. There was no need to manufacture a second setup to make the article feel fuller.
Readers should carry forward the method rather than the exact price. Define the zone, define the point that proves the idea wrong, take progress in stages, and narrow risk when the market has paid. Then verify any new session independently. The next day may have a different range, different event risk, and no comparable move.
FAQ#
Was September 16 a one-trade day?#
The record contains one fully parameterized setup: the 4,340–4,336 gold-buy idea with 4,332 protection and four fixed checkpoints. The short “Gold buy now” opener is treated as part of that same sequence, not as a second trade.
Why is there no daily closing price in the snapshot?#
The market snapshot was taken at 21:00 GMT+7 while the US session was open. It therefore records a current spot and a visible intraday range, while the daily close remains unavailable.
Does the $16,839.47 screenshot prove a universal result?#
No. It is a legible, account-specific screenshot attached to a same-day public claim. It supports what that account displayed at that moment; it cannot establish audited performance or predict another reader’s outcome.
What did the member screenshots add?#
They show how individual readers described the move, including a one-lot third-checkpoint result, a reported $600 result, a nearly £1,400 message with mixed-date rows, and a small-account view tied to the four-checkpoint message. They are selected proof records, not guarantees.
Where can I follow the next public update?#
Follow Gold Trader Mo for the site archive and message @GTMOBest for the free Telegram signal lane. Use the historical reports to learn the process, not to copy an old price.
Connect with Gold Trader Mo#
If this kind of evidence-led recap is useful, start with the Gold Trader Mo home page and the public report archive. The free Telegram lane at @GTMOBest is the direct place to ask about the next update and how the public signal record is shared.
The invitation is simple: read the levels, timing, protection notes, and source-bounded proof; then decide whether the communication style fits you. No screenshot can remove market risk, and no historical result guarantees the next session.
This article is educational commentary, not financial advice. Trading involves risk, capital can be lost, and past performance never guarantees future results.