
Market Snapshot#
September 15 was an open-session recovery day, not a clean one-way victory lap. At 08:05 ET, USA TODAY reported spot gold at 4282.99 USD/oz, down 1.45% from the previous close of 4345.90. Converted to the report clock, that is 20:05 GMT+7. The market snapshot was captured at 21:05 GMT+7 while the global spot session was still open, so this report does not invent a New York daily close.
The same-day range was approximately 4317.39 at the high and 4263.19 at the low, a spread of about 54.20 dollars. Those two range points are approximate snapshots, not exchange-settled closes. Yahoo Finance added a useful macro frame: December futures opened around 4340.30 as Treasury yields pushed higher, a two-day FOMC meeting approached, and oil moved above 100 USD per barrel after a Saudi pipeline disruption was reported. The dollar index was near 99.41 in the captured snapshot, while the 10-year Treasury yield was described as above 5%.
| Market input | September 15 reading | How to use it |
|---|---|---|
| Spot gold | 4282.99 USD/oz at 08:05 ET | Exact intraday observation from USA TODAY |
| Previous close | 4345.90 USD/oz | Comparison point, not a new close |
| Approximate session high | 4317.39 | First range resistance |
| Approximate session low | 4263.19 | Deeper range support |
| DXY snapshot | Near 99.41 | Approximate same-day pressure gauge |
| US 10Y yield | Above 5% reported level | Rate-sensitive headwind |
| WTI | Above 100 USD/bbl reported level | Inflation and risk backdrop |
The channel record supplies the trading story behind that snapshot. An initial sell zone at 4274–4278 was later cut after price invalidated the idea. A second sell zone at 4284–4288 then became the recovery attempt. The sequence matters more than any single screenshot because it shows how a desk handled a wrong read, a new zone, staged exits, and protection. Readers looking for free context can message @GTMOBest, but every level below is a historical recap rather than a live instruction.
Why The Tone Changed So Fast#
The tone shifted quickly because price, rates, and event risk were moving together. Higher Treasury yields raise the opportunity cost of holding a non-yielding asset. The approaching FOMC meeting kept traders sensitive to every rate signal, while a firm dollar near 99.41 added another headwind for gold priced in dollars. Oil above 100 USD per barrel added an inflation and geopolitical layer, making the tape more defensive even when a short-term bounce appeared.
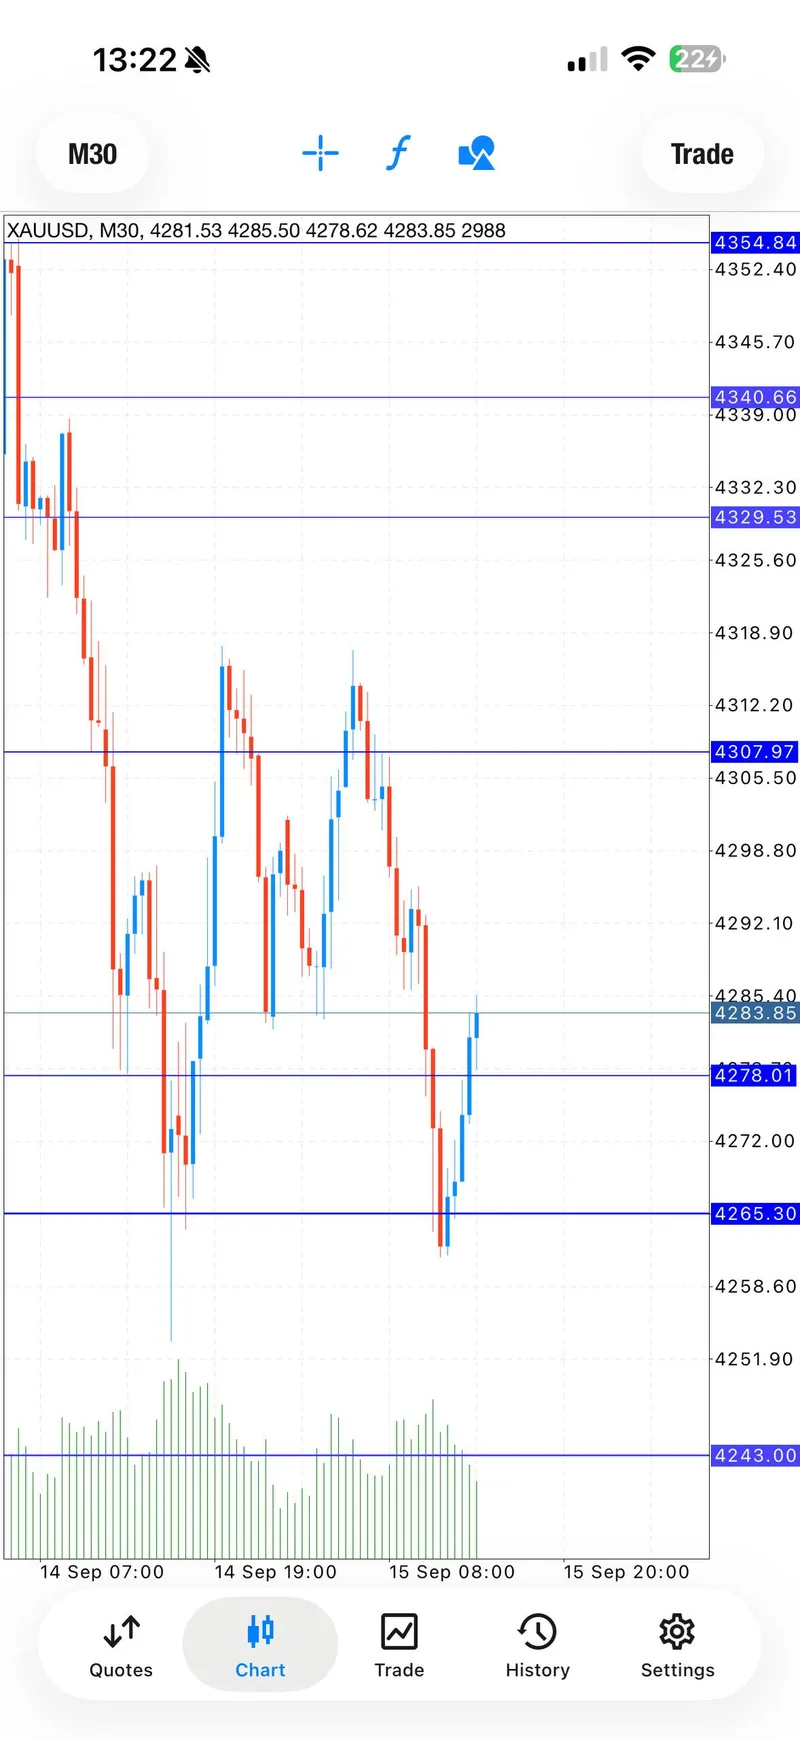
That macro pressure explains why a sell idea could look attractive and still fail. The first setup was posted at 10:09 UTC, or 17:09 GMT+7, with a 4274–4278 entry zone, a planned stop at 4283, and targets at 4272, 4270, 4268, and 4266. Early target messages followed, but the channel later posted Cut loss and Setup failed at 11:16 UTC. The follow-up explanation was unusually direct: the expectation was for London to continue the bearish trend with lower retraces, and that expectation was wrong. That admission is part of the result, not a footnote.
The recovery tone began because the invalidation was followed by a defined re-entry rather than by chasing. At 11:27 UTC, the public record placed a new sell zone at 4284–4288 with a stop at 4293 and checkpoints at 4282, 4280, 4278, 4276, and 4274. This is why the day reads as defensive and tactical. The macro backdrop pushed price around, but the operating response was to reset the zone, wait for structure, and reduce risk as the move developed.
For continuity, compare the September 14 daily report, which had a different signal-day rhythm. The contrast is useful: the same brand can publish a strong result while the path to that result still contains an invalidated idea and a controlled reset.
Technical Outlook#
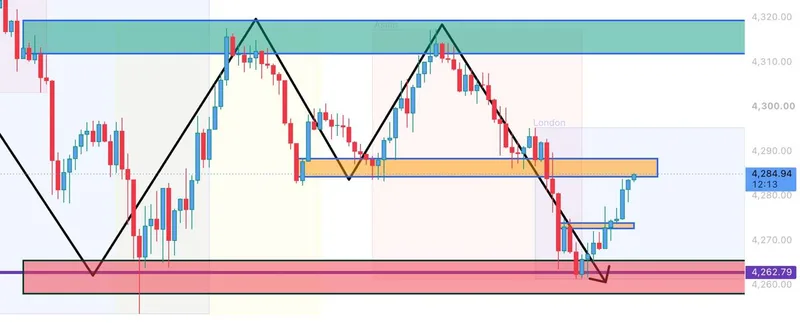
The captured market levels create a simple map. First resistance was 4300.00, followed by the approximate session high at 4317.39. On the downside, 4276.00 was the nearer support reference and 4263.19 was the deeper approximate low. A break and hold above 4300 would have weakened the defensive intraday tone; a return below 4276 would have kept the lower range in focus. Because the daily close was unavailable at capture, these are observation levels, not settled end-of-day signals.
The two historical trade zones add execution context without changing the map:
- The first idea used 4274–4278 as the sell area and 4283 as its invalidation point. It was closed when the read failed.
- The recovery idea used 4284–4288 as the sell area and 4293 as its invalidation point. Its five planned checkpoints ran from 4282 to 4274.
The difference between those zones is important. The second zone was not presented as a guarantee that the first loss would be recovered. It was a new setup with a new invalidation point. A trader studying the day should ask whether the second entry had a clear structure, whether size stayed appropriate after the first loss, and whether protection moved as planned. That process is more transferable than copying a number from a screenshot.
The September 11 report offers another comparison point for readers tracking how the desk handles multiple setups. On September 15, the key technical feature was not a complex indicator stack. It was the transition from a failed zone to a better-defined zone while the broader market remained sensitive to yields and the FOMC.
Trading Signals#
First sell setup: a documented invalidation#
At 17:09 GMT+7, the public @GTMO record posted a gold sell zone at 4274–4278 with an invalidation at 4283 and four fixed downside checkpoints plus an open extension. Early updates reported the first and second checkpoint tests. When price returned to the zone and the bearish continuation did not hold, the record posted Cut loss at 18:16 GMT+7 and Setup failed moments later.
The useful detail is the explanation that followed. The channel said the London continuation assumption had been wrong and that accepting a loss protects the account from a much larger mistake. That is a complete historical signal record: entry context, invalidation, attempted follow-through, exit, and a plain-language review. It should not be rewritten as a winning trade simply because a later setup worked.
Second sell setup: the risk-reset sequence#
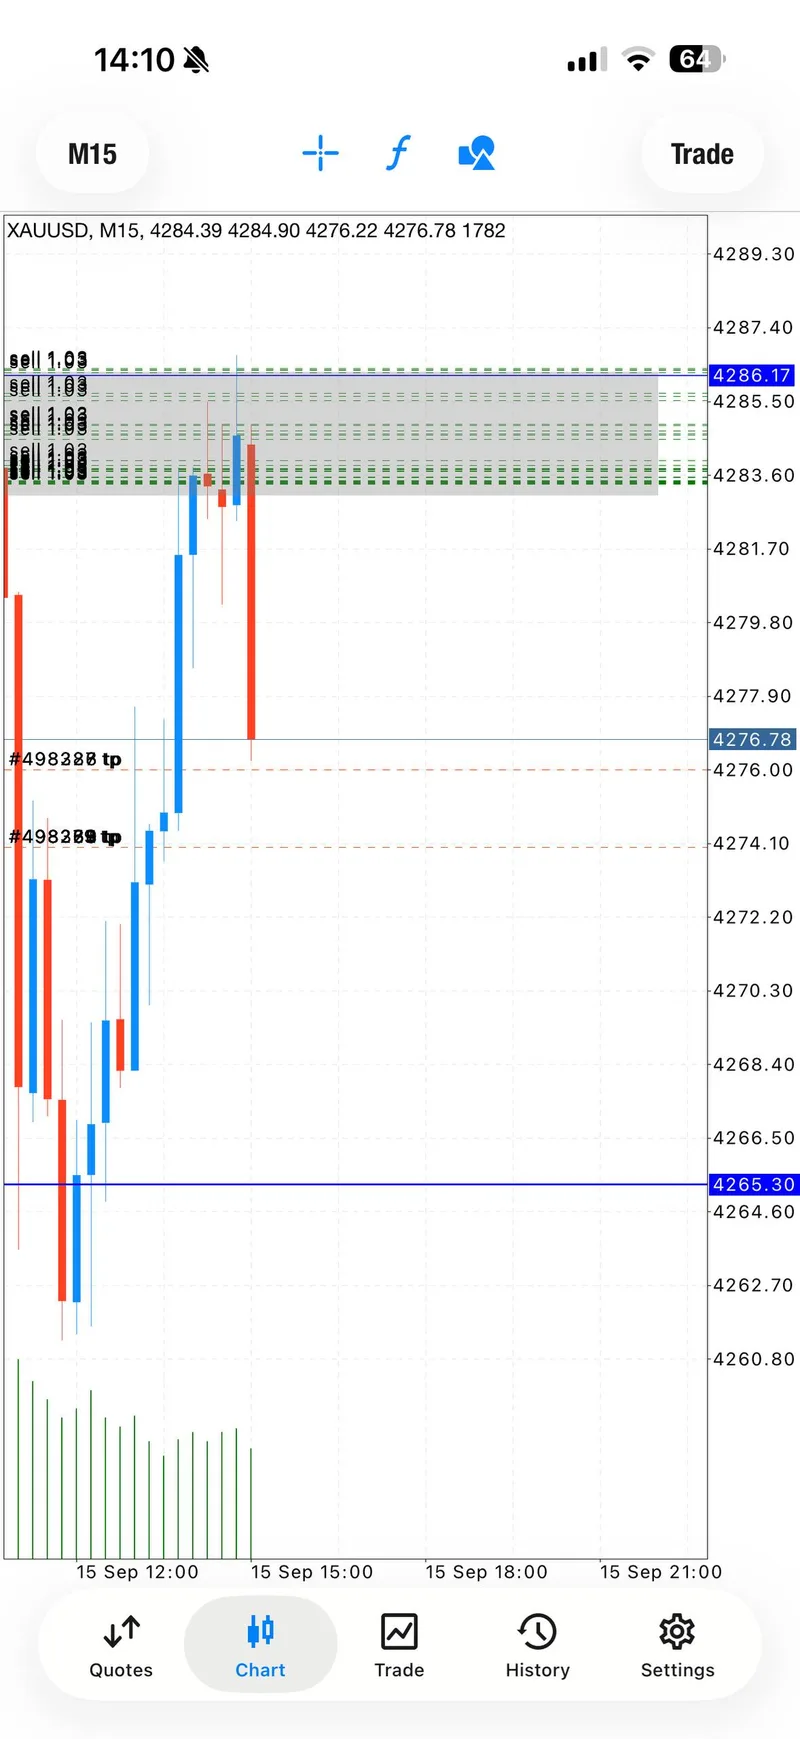
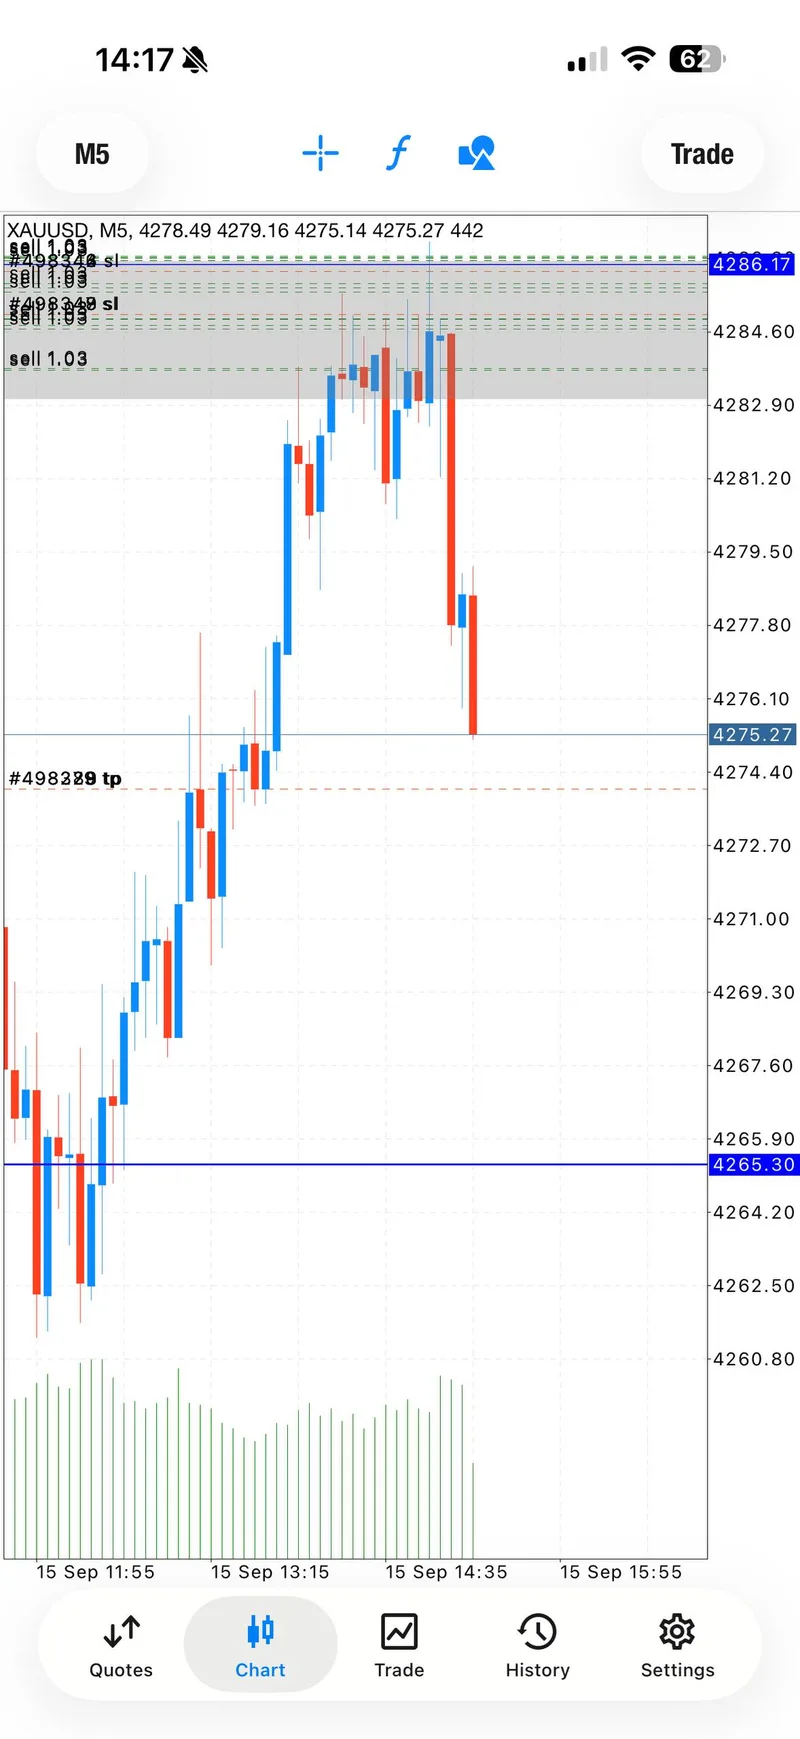
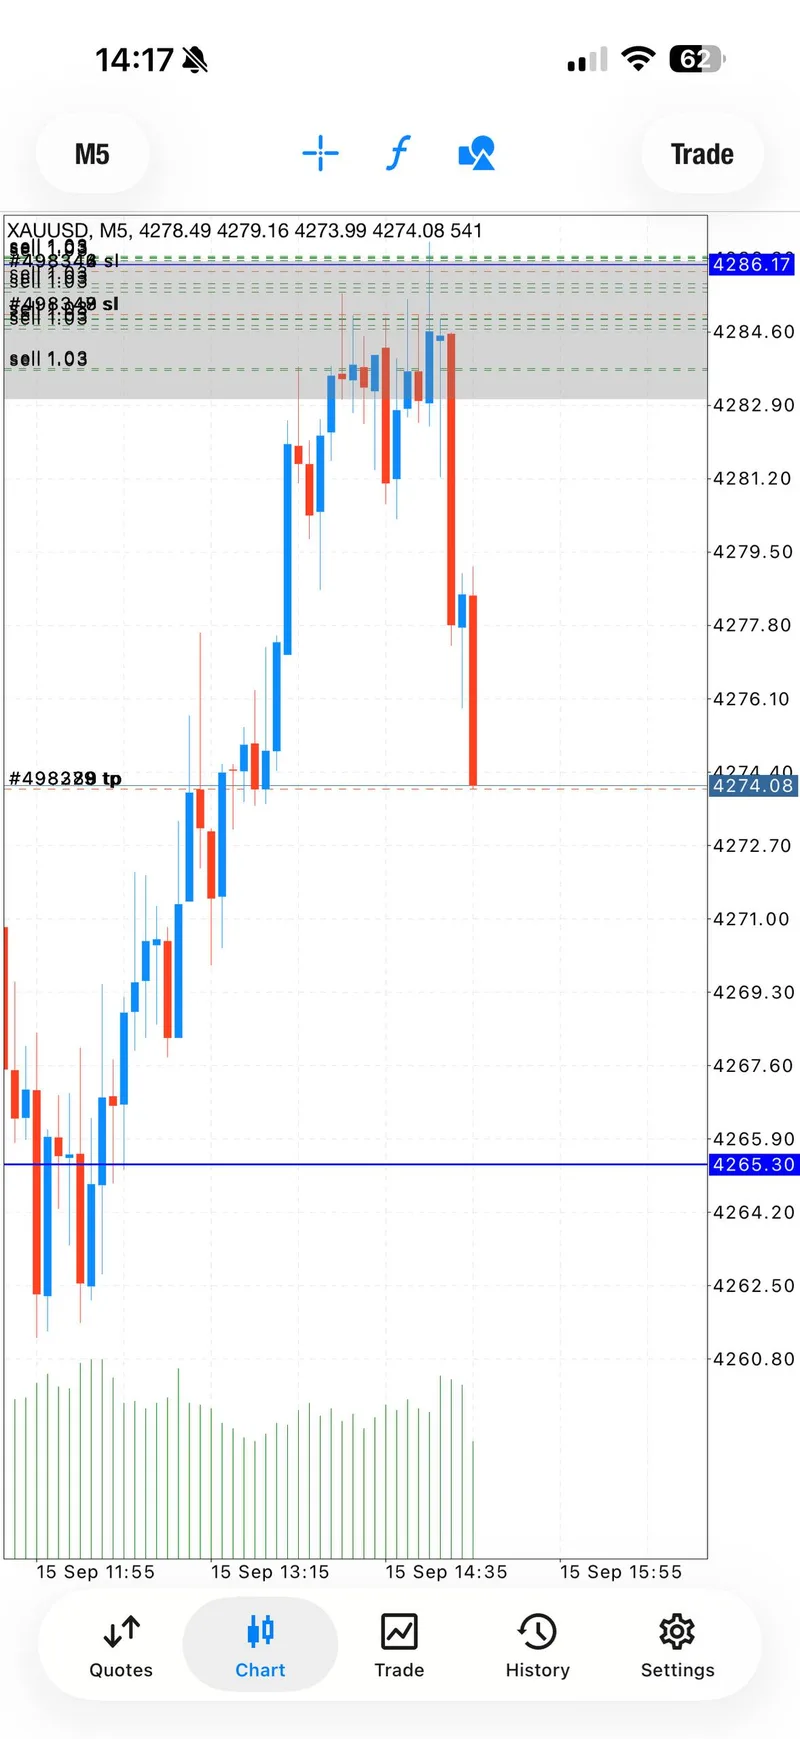
At 18:27 GMT+7, the next public setup used 4284–4288 as the sell zone, 4293 as the invalidation point, and five planned checkpoints at 4282, 4280, 4278, 4276, and 4274. The first checkpoint was reported at 18:32 GMT+7. Price then tested the entry area again, and the channel reminded readers that the H1 candle needed to close bearish before the move could be trusted.
The record continued with the second and third checkpoint updates, a reminder to take profit according to personal comfort, a half-profit update around 19:17 GMT+7, and a breakeven update on the final two entries around 19:43 GMT+7. At 19:44 GMT+7, the channel claimed that all five take-profit checkpoints had been reached and that a 140-plus-pip drop had been caught. Those statements are channel claims tied to message timestamps; they are not an audited broker statement or a promise about a future trade.
This two-step structure is the central trading lesson. The first idea was allowed to be wrong. The second idea was allowed to be new. Treating them as separate decisions is what kept the narrative from becoming a revenge trade.
Signal Performance Breakdown#
The strongest same-day claim in the public record was a $30,000 result message at 19:10 GMT+7. A separate message described a move from $27,000 negative to $10,000 positive. Both are self-reported channel claims, not universal returns. They belong in the breakdown because they explain the excitement around the second setup, but they must remain attached to their source and context.
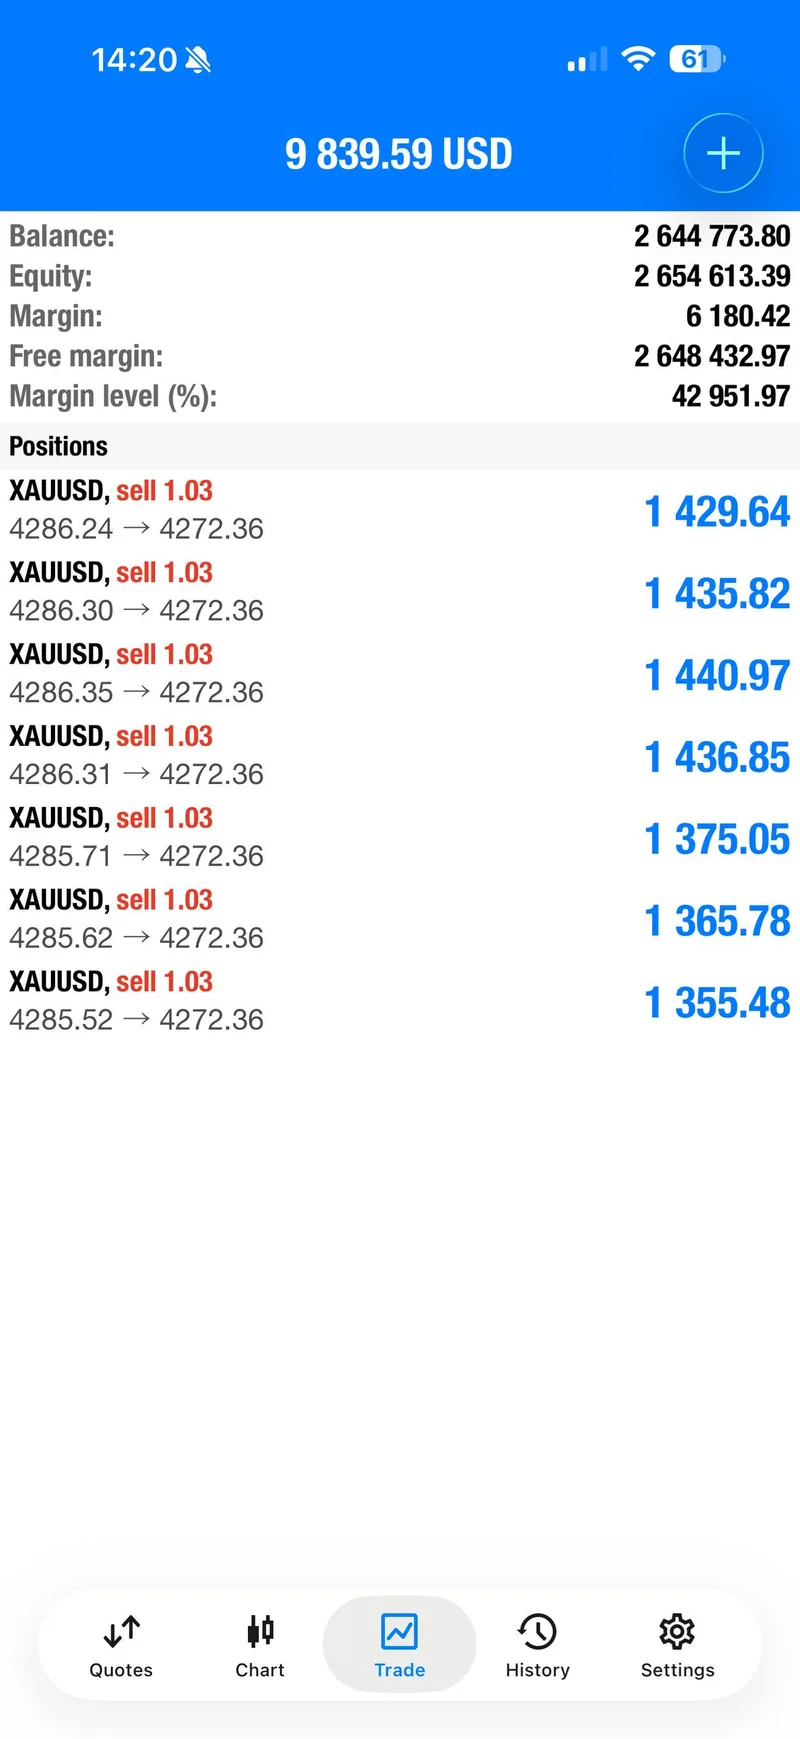
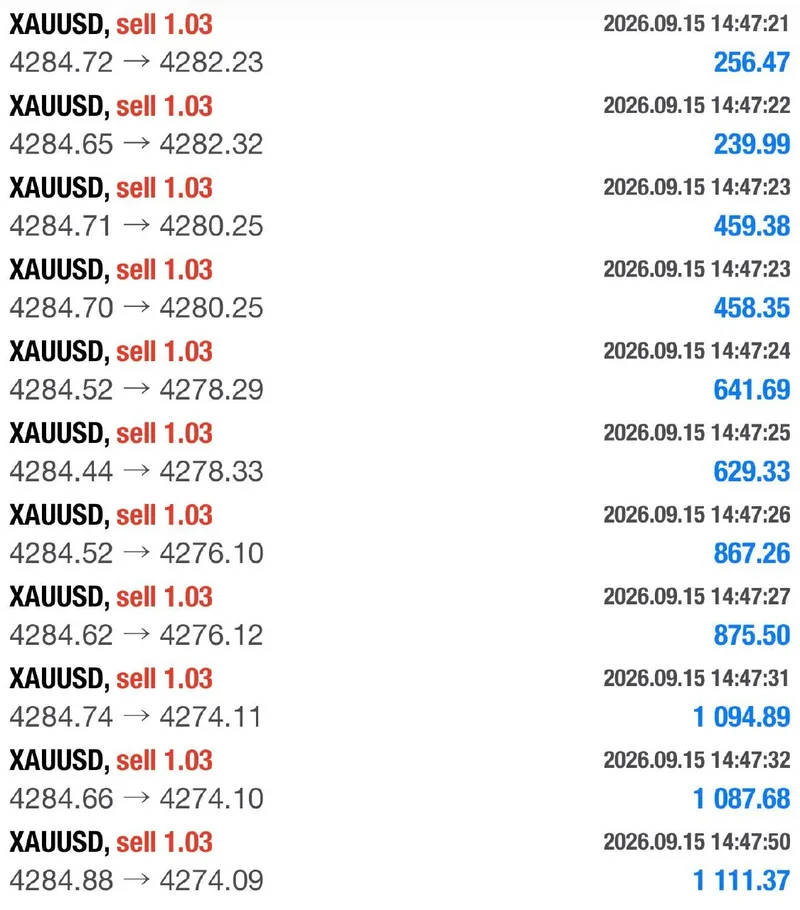
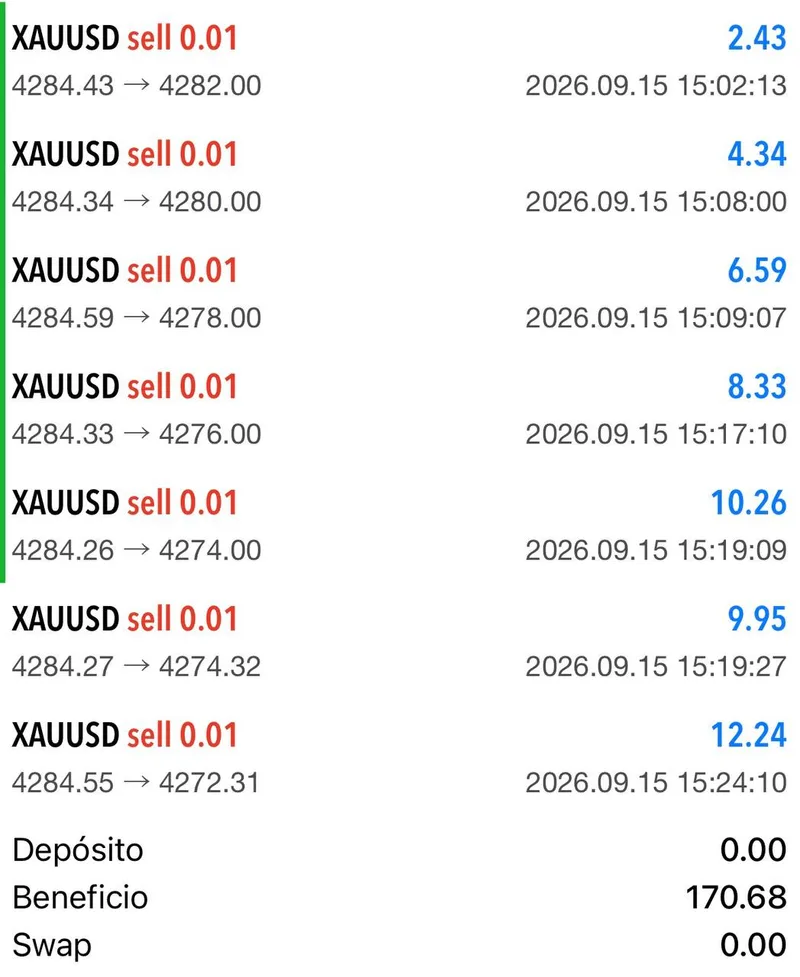
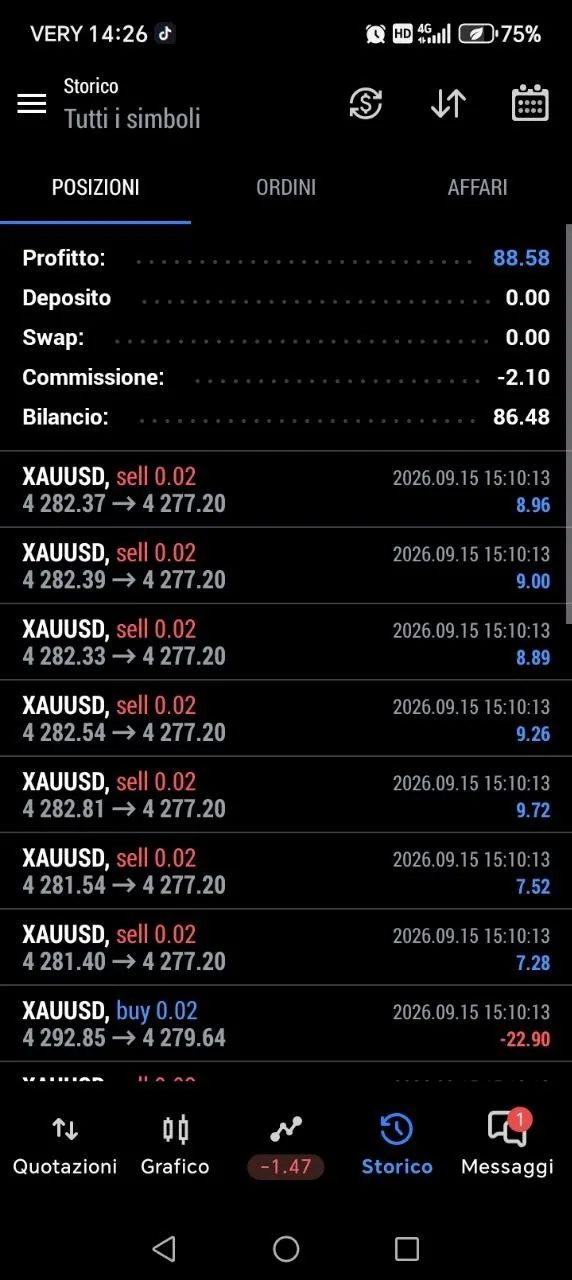
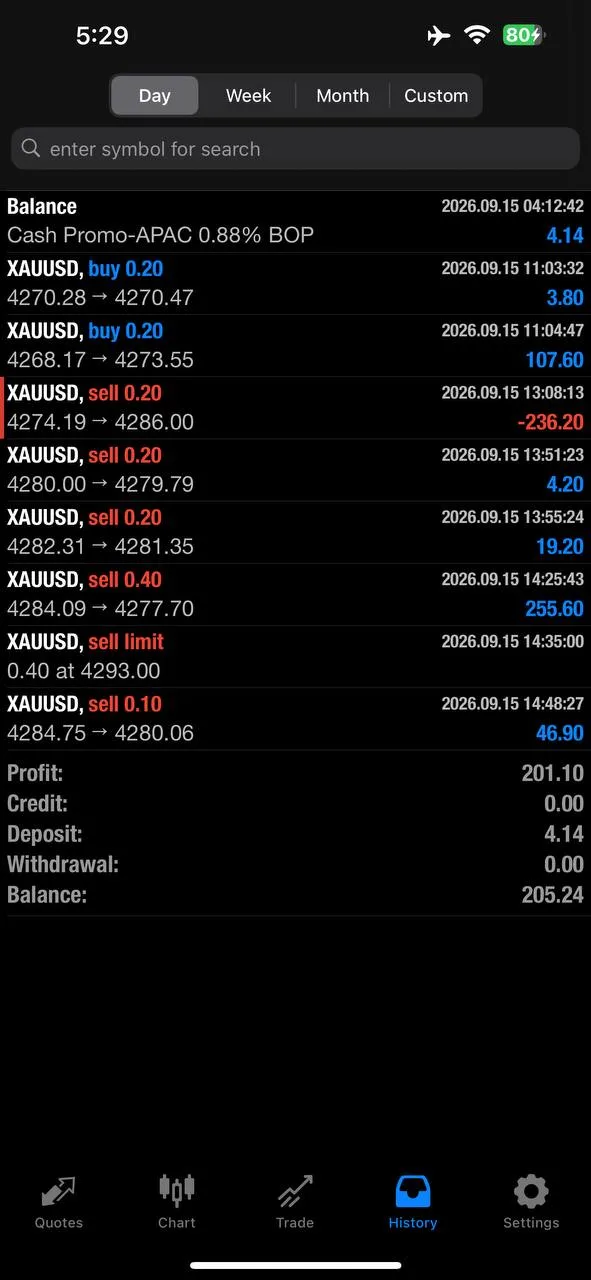
The more durable evidence is the sequence of operating updates: first checkpoint, a return to entry, a bearish H1-close reminder, later checkpoints, partial profit, breakeven on the remaining entries, and a final five-of-five claim. Seven selected trading screenshots preserve that progression, from the failed-zone chart through the later chart and individual account-history views. The account screenshots show single-user snapshots, so displayed balances or benefits cannot be treated as the outcome for every reader.
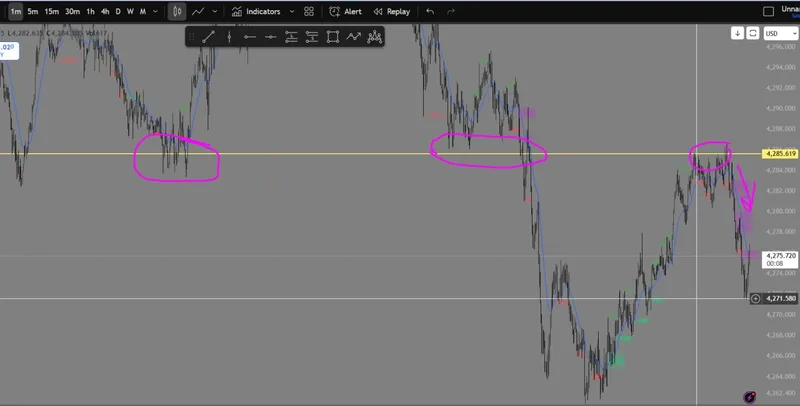
The community response adds another layer. Eighteen member messages followed the session, and four public proof screenshots were selected for this recap. Domas wrote that risk management kept the stop just above 85 and left only a small loss on a couple of early entries; the accompanying chart marked the touch-and-go zones. Jasson Paolo shared an account-history view showing a displayed benefit of 170.68 across small XAUUSD sells. Antar shared a view showing 88.58 profit and 86.48 balance while one losing position remained visible. Nick shared a history view showing 201.10 profit and 205.24 balance after an earlier losing sell and later gains.
Those examples are intentionally mixed. They include a chart explanation, small account snapshots, and a visible earlier loss. That mix is more credible than selecting only the largest number. It also aligns with the September 10 daily report, where the useful question was how many checkpoints held and how risk was managed, not whether one headline number could carry the entire story.
The performance summary for September 15 is therefore:
| Evidence layer | What the record supports |
|---|---|
| Public setup record | Two separate sell ideas, with the first cut and the second re-entry documented |
| Checkpoint sequence | A channel claim of five planned checkpoints reached |
| Same-day claims | $30,000 and $27,000-to-$10,000 claims, both self-reported |
| Member response | 18 messages, with 4 selected screenshots for public context |
| Account screenshots | Individual views only; not a universal return or audit |
Execution Lessons#
The first lesson is that a stop is a decision boundary, not a decoration. The initial 4274–4278 idea had a defined invalidation at 4283. Once that premise failed, the channel cut the setup and said so publicly. That action limits damage and preserves the ability to evaluate a new setup on its own merits.
The second lesson is to separate a reset from revenge. The 4284–4288 re-entry had a different stop at 4293 and a new sequence of checkpoints. There was a return to entry and a test of emotions before the move continued. Waiting for the H1 structure and moving the last entries to breakeven reduced the cost of being early.
The third lesson is to make exits granular. Five checkpoints let a trader reduce exposure in stages instead of waiting for a single perfect exit. The half-profit message around the fourth checkpoint shows that the operating plan allowed partial realization while leaving room for continuation. That is a risk choice, not a guarantee of a waterfall.
The member comments reinforce the same point. Chris described a small loss followed by recovery above a daily target and then chose to stop overtrading. H described a first trade at minus 250 and a second at plus 340. These are individual statements, but they show why the day should be studied as a sequence of decisions. A loss can coexist with a positive session when size, stops, and the urge to keep clicking are controlled.
What The Day Means Going Forward#
September 15 belongs in the recovery-and-reset category. The macro background was defensive, the spot session was still open at the time of capture, and the public record included both an invalidated sell and a later five-checkpoint claim. That combination makes the report useful for process review, not for copying a headline result.
Going forward, readers should watch whether gold can reclaim 4300 and hold above it, or whether 4276 and then 4263 remain in play. They should also watch the post-FOMC rate reaction rather than treating one intraday snapshot as a settled regime. If yields stay elevated and the dollar remains firm, rallies may continue to meet supply. If rates ease and price reclaims the upper range, a defensive sell-only interpretation would need to be reconsidered.
The public @GTMO record also sets a standard for future recaps: show the failed idea, show the reset, preserve the protection updates, and label account screenshots as individual evidence. That is how a daily gold trading report can be useful without turning a volatile session into a promise.
FAQ#
Did September 15 have an official gold close in this report?#
No. The market snapshot was captured at 21:05 GMT+7 while the global spot session was open. The report uses the exact 4282.99 spot snapshot and the approximate 4317.39–4263.19 range, but it does not claim a New York daily close.
What happened to the first sell setup?#
The 4274–4278 sell idea used 4283 as its invalidation. After price returned to the zone, the public record posted Cut loss and Setup failed. The later 4284–4288 idea was a separate re-entry with a 4293 invalidation.
Does the $30,000 message mean every reader earned that amount?#
No. It was the strongest same-day result claim shared on the public channel. The $27,000-to-$10,000 message and the account screenshots are also self-reported or individual evidence. Results vary, and trading can lose capital.
Where can I follow the next public update?#
Visit Gold Trader Mo for the report archive or message @GTMOBest for free channel access and future updates. Do not treat a public recap as a live instruction.
Connect with Gold Trader Mo#
The Gold Trader Mo home page is the best starting point for the archive, while @GTMOBest is the public contact for free gold-signal updates. The daily report format is designed to keep the sequence visible: market context, technical map, signal decisions, evidence, and lessons.
If you follow the free channel, use the same discipline shown in this recap. Define the invalidation before entering, size for the possibility of loss, take partial profit according to your own plan, and stop when the day has met its limit. Do not copy an entry because a screenshot looks convincing, and do not assume an individual account view represents your result.
This report is for education and market commentary only, not financial advice. Trading involves risk, capital can be lost, and past performance or self-reported results do not guarantee future outcomes.