
Daily Gold Report — September 24, 2026: One Sell, Five Targets#
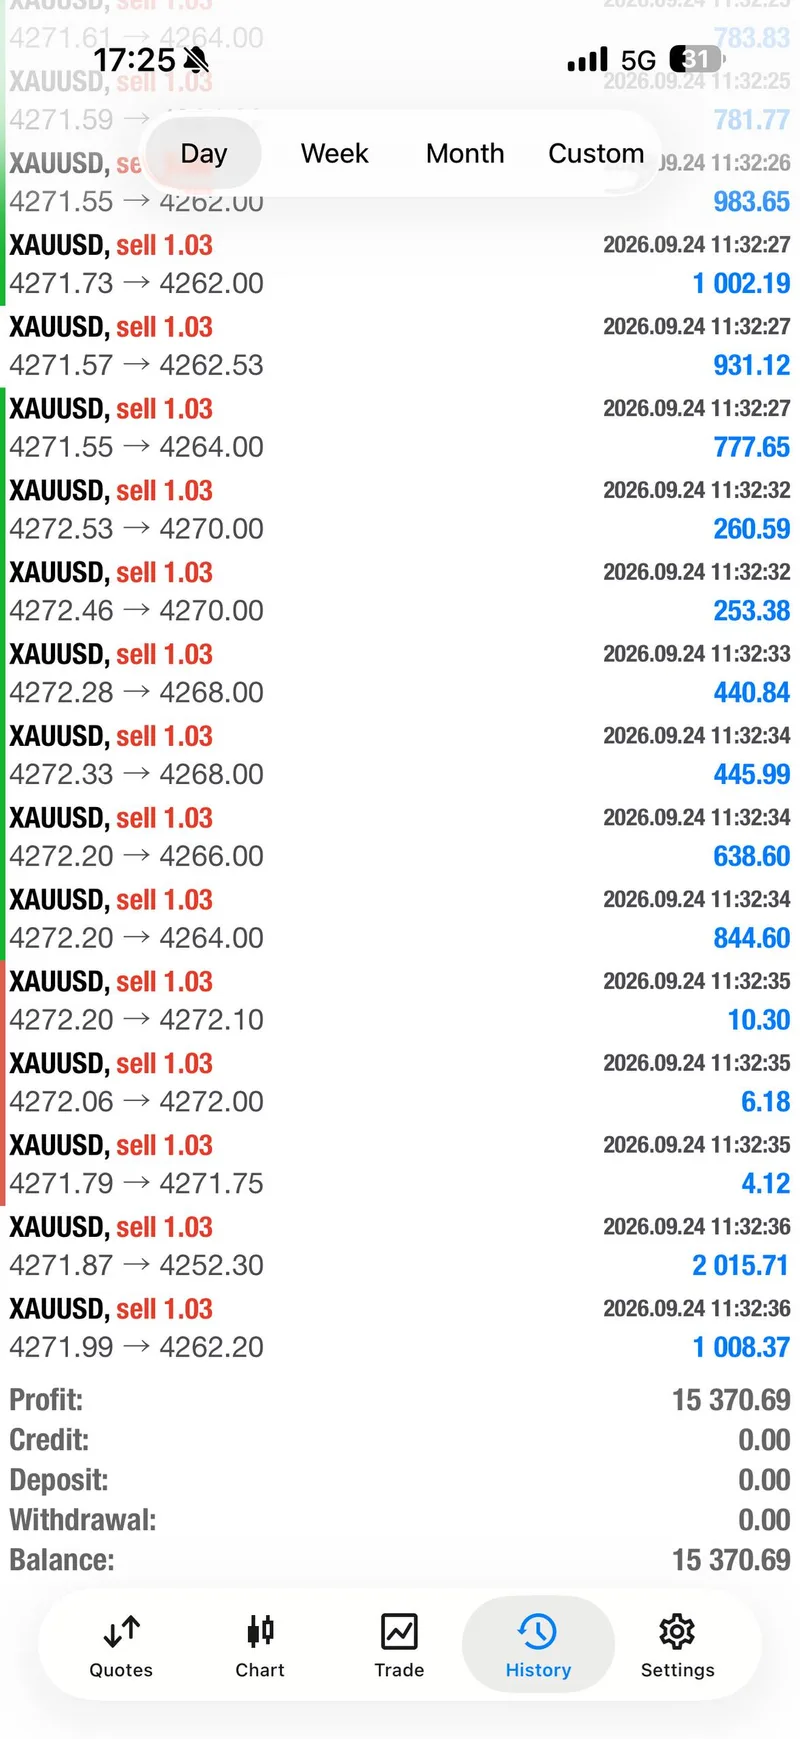
September 24 delivered a clean historical lesson in execution: one public SELL from 4272-4276 moved through five staged target levels, early entries later reached 200+ pips, and risk was protected at breakeven before the session was closed. A same-day public post said almost $20,000 was secured. One selected history view shows $15,370.69, so this recap keeps those records separate rather than turning them into one oversized promise.
Message @GTMOBest early for free signals and FREE VIP channel access. This page is a historical September 24 recap, not a live trading instruction.
Market Snapshot#
At 21:00 GMT+7, the same-day market packet showed XAUUSD at 4276.62 while the broader North American session was still open. The reported intraday high was 4303.30 and the intraday low was 4273.73. DXY was 101.08, the US 10-year yield was 5.11%, and WTI was 91.39. No official daily close was available for XAUUSD, DXY, the 10-year yield, or WTI at that snapshot, and VIX plus the Federal Reserve target range remained unavailable.
The macro picture supported a heavy gold tape: stronger September private-sector activity and hawkish Federal Reserve commentary pushed the dollar and Treasury yields higher, increasing the opportunity cost of holding a non-yielding asset. That context explains why the public SELL sequence had room to run, but the trade record itself is the evidence of how the day was handled.
For continuity, September 23: Flight-Mode Recovery shows a different recovery sequence, while September 21: $10K Protected focuses on protection before the headline. September 18: Two Four-Target Setups adds another example of staged exits across a changing tape.
Why The Tone Changed So Fast#
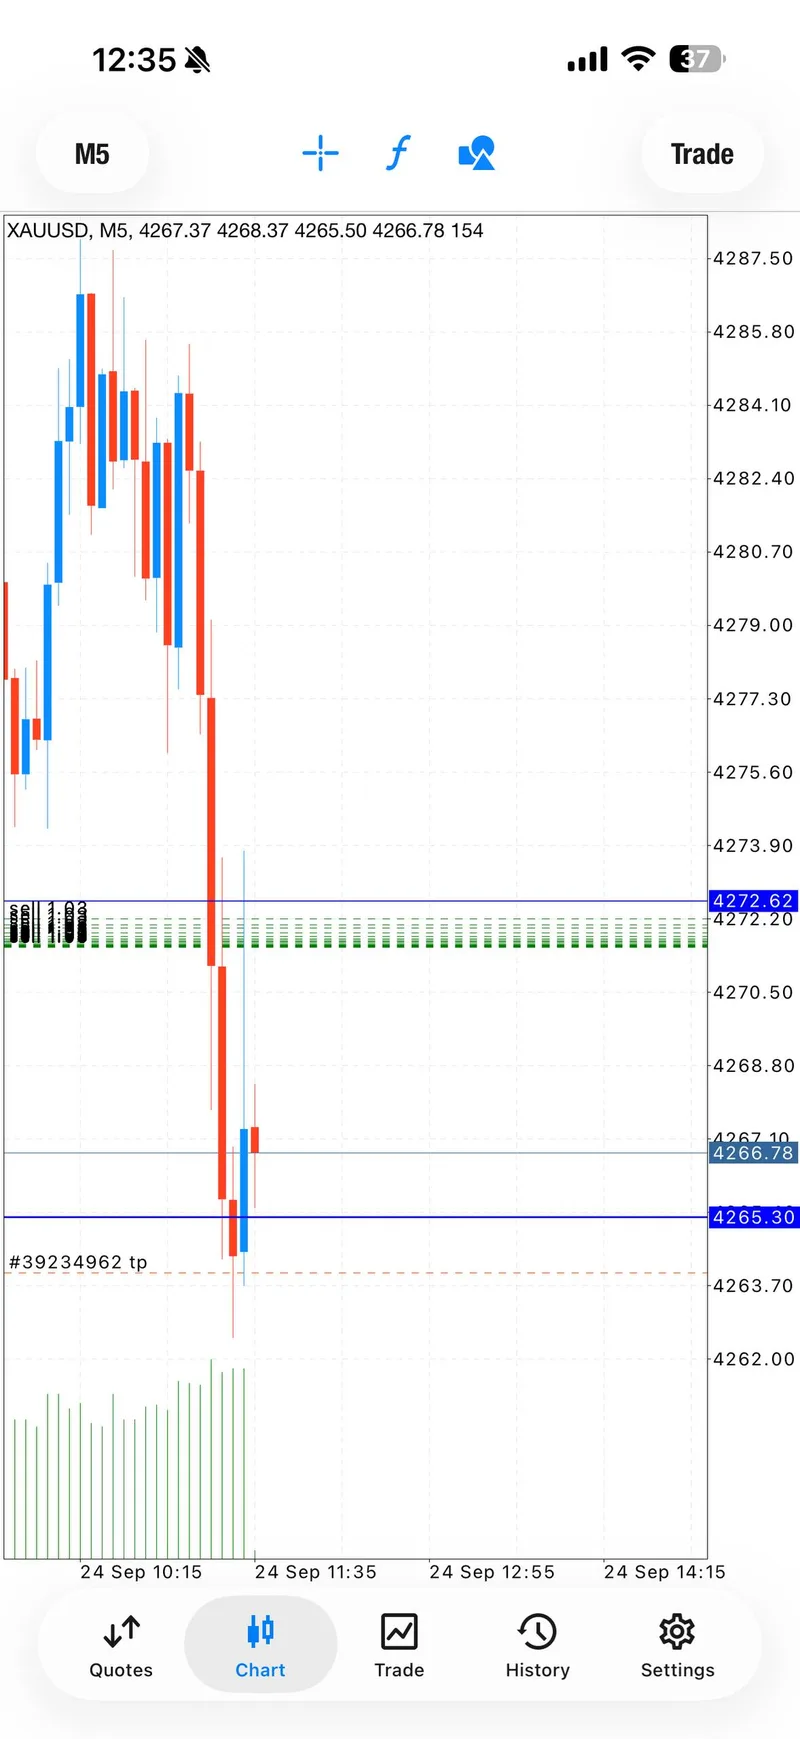
The public @GTMO record posted the SELL setup before the result: 4272-4276 entry zone, 4279 stop, and target levels at 4270, 4268, 4266, 4264, and 4262, with an open target beyond the ladder. The first update marked target 1, target 2, and target 3. The next important decision was not a bigger boast; it was the instruction to move risk to breakeven for zero risk.
The remaining two target levels were then marked complete. Follow-up messages recorded 100+ pips, 120+ pips, and later 200+ pips on the first entries. That order matters because the public record showed the plan, the protection step, and the result in sequence rather than presenting a chart after the fact.
Technical Outlook#
The levels below are historical reference points from September 24 and are not instructions for a new trade:
- The public SELL zone was 4272-4276 with a 4279 stop reference.
- The five posted target levels were 4270, 4268, 4266, 4264, and 4262.
- The market packet placed nearby resistance at 4287.35 and 4303.30, with support at 4273.73 and 4265.30 during the intraday snapshot.
The signal sat close to the reported session low, while the broader market snapshot remained bearish under a stronger dollar and higher yields. That is useful context for a past session, not a reason to copy a completed setup.
Trading Signals#
The public SELL setup#
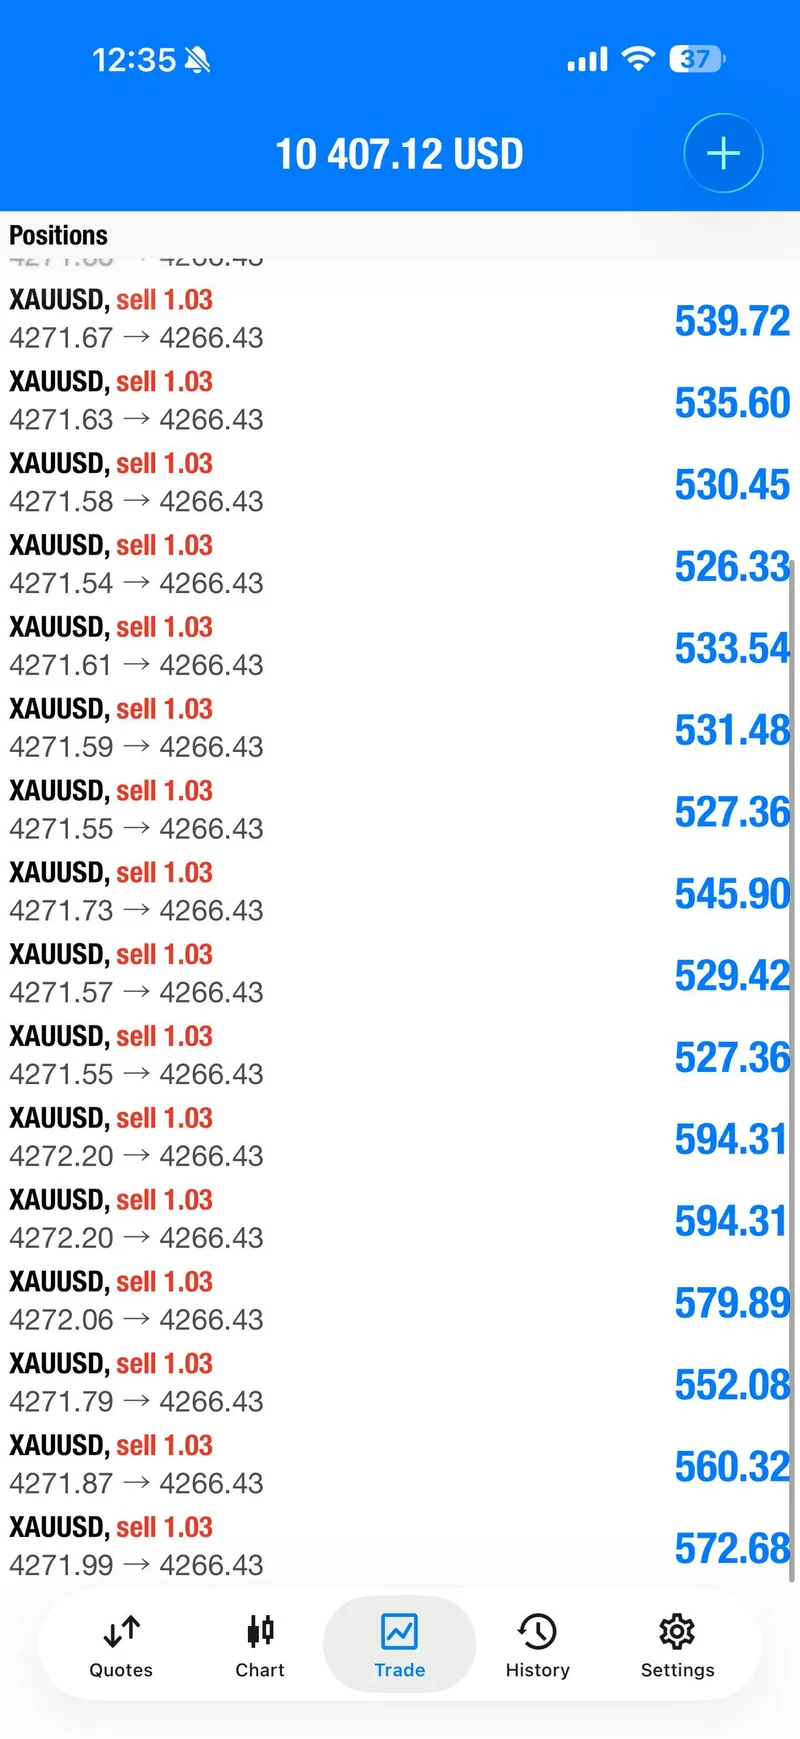
This was the only verified signal sequence collected for the day. It was shared publicly on @GTMO with a clear zone, stop, five-step target ladder, and an open extension target. The visual record begins with the chart and target path so readers can see the plan before the celebration.
Protection before the headline#
Target 1 through target 3 were checked first. Breakeven protection followed while the trade was still active, then the remaining two target levels were marked complete. The later 100+, 120+, and 200+ pip updates belong to that same sequence and are framed as historical milestones, not current calls.
Signal Performance Breakdown#
The clean way to read the day is to keep the signal, the risk decision, and the result in one chain:
- SELL setup: 4272-4276 with a 4279 stop and five posted target levels.
- Risk reset: target 1-3 were checked, then breakeven was set before the final two target levels.
- Outcome: the first entries later reached 200+ pips, and a final public message said all trades were closed with almost $20,000 secured.
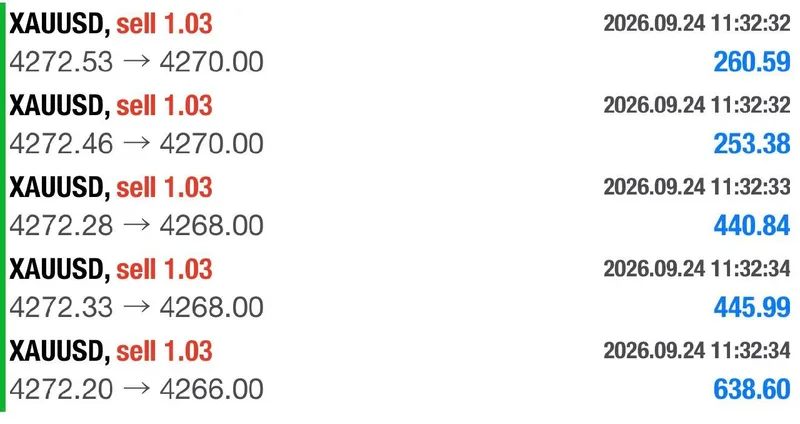
The selected history screenshot shows $15,370.69 for the displayed day range. That figure is not silently substituted for the public message, and the two numbers are not added together. They are retained as separate same-day records with different visible scope.
Three member feedback messages followed the move. Two readable public highlights were from painkllz, who wrote “300$ great trade,” and Nils, who wrote “One Trade, 8 % Profit.” Those are member reactions, not guarantees or typical outcomes. The gallery contains four selected public trading screenshots; no member screenshot was counted because the feedback evidence was text-only.
Execution Lessons#
The first lesson is to show the plan before the result. A zone, stop, and target ladder give readers something auditable before the account screenshots appear. The second is to reduce risk after the first targets rather than hold every entry open for a bigger headline.
The third is to keep the figures bounded. “Almost $20,000” is the wording of the public closing message. “$15,370.69” is the number visible in the selected history view. Reporting both, with their different scope, is more useful than pretending the record contains one perfectly reconciled account total.
The fourth is to treat a completed session as a case study. The market can reverse, liquidity can change, and a historical target ladder is never a promise for the next day.
What The Day Means Going Forward#
September 24 shows why a public signal record can feel more trustworthy when the risk reset is visible. The story is not just that gold moved lower. It is that the desk posted a SELL, showed five target levels, protected the trade at breakeven, and then closed the session without asking readers to guess which part of the result was real.
The intraday market snapshot points to a bearish correction, but it does not provide an official close. Use the article as a transparent post-session record and compare it with the September 23 recovery report before drawing broader conclusions.
FAQ#
Was the almost-$20,000 result guaranteed?#
No. It was the wording of one same-day public message. The selected history view displays $15,370.69, and neither figure is a guarantee or a typical reader outcome.
What was the verified signal?#
One SELL setup from 4272-4276 with a 4279 stop and five target levels: 4270, 4268, 4266, 4264, and 4262. Those levels are historical September 24 evidence, not live instructions.
How many member responses were recorded?#
Three member feedback messages were recorded. Two readable highlights are summarized above, while the four selected gallery images are trading screenshots rather than member proof.
Is 4276.62 an official close?#
No. It was the 21:00 GMT+7 intraday snapshot available while the North American session was still open. The close field remains unavailable.
Connect with Gold Trader Mo#
Follow the wider Gold Trader Mo archive for transparent historical recaps, then message @GTMOBest for free signals and FREE VIP channel access. You will see the plan, the risk decision, and the result kept together, with the same public-first discipline used in this report.
Trading involves substantial risk, including loss of capital. Historical examples are not financial advice, guarantees, or a promise of future performance. Do not treat the levels, prices, pip milestones, or account figures in this article as current trading instructions.