
The Week Gold Kept Changing the Question#
Gold did not offer one clean idea from August 31 through September 4. It offered a series of different problems: find the rebound, sell the rejection, admit when the sell was wrong, rebuild from the other side, and finally decide whether another trade was worth taking into NFP volatility.
For Gold Trader Mo, that last decision became the week’s clearest lesson. MO had already navigated a demanding sequence and the public channel had reported a $10,000+ Friday result. The experienced move was not to chase a bigger headline. It was to protect the week and step away before the highest-risk event window. If you want to watch that decision-making live and ask about free VIP access, message support @GTMOBest.
Across five active sessions, the archive supports 12 documented trade plans: two on Monday, three on Tuesday, three consolidated setups on Wednesday, two on Thursday, and two on Friday. The public daily labels included $19,000+ on Monday, a $31K recovery-day label on Thursday, and $10K on Friday. Those are session-level channel claims, not an audited weekly total, average member result, or promise of what comes next.
Weekly Market Overview#
The available market record did not provide a clean official close-to-close series for every session, so this recap does not manufacture one. The available timestamped spot observations moved from $4,455.19 on Monday at 19:10 GMT+7 to $4,391.61 on Friday at 21:57 GMT+7—a difference of $63.58, or about 1.43%, between two non-synchronous intraday snapshots. That describes the pressure in the available record; it is not presented as an official weekly return.
The macro tone also changed underneath the tape. Early in the week, a firmer dollar, elevated Treasury yields, hawkish rate expectations, and oil-linked inflation concern created a heavier backdrop for gold. By Thursday, the trading record showed a recovery phase. Friday then brought the August payroll release and an immediate volatility shock: the available record cited payrolls at 162,000 against roughly 53,000 expected and spot gold down 2% at the referenced intraday observation.
This is why the week cannot be reduced to “bullish” or “bearish.” The desk had to read what was in front of it, change its answer when structure changed, and recognize when event risk made the next answer too expensive.
| Weekly evidence | Verified scope |
|---|---|
| Active trading sessions | 5 |
| Documented trade plans | 12 |
| Directional path | BUY → SELL → failed SELLs / BUY recovery → BUY recovery → protected BUY / stop before NFP |
| Public session labels | $19,000+ Monday; $31K Thursday; $10K Friday |
| Selected proof package | 5 trade screenshots + 4 community screenshots |
| Market-data limitation | Intraday snapshots; no invented official weekly close |
Monday: Build the Rebound, Then Protect It#
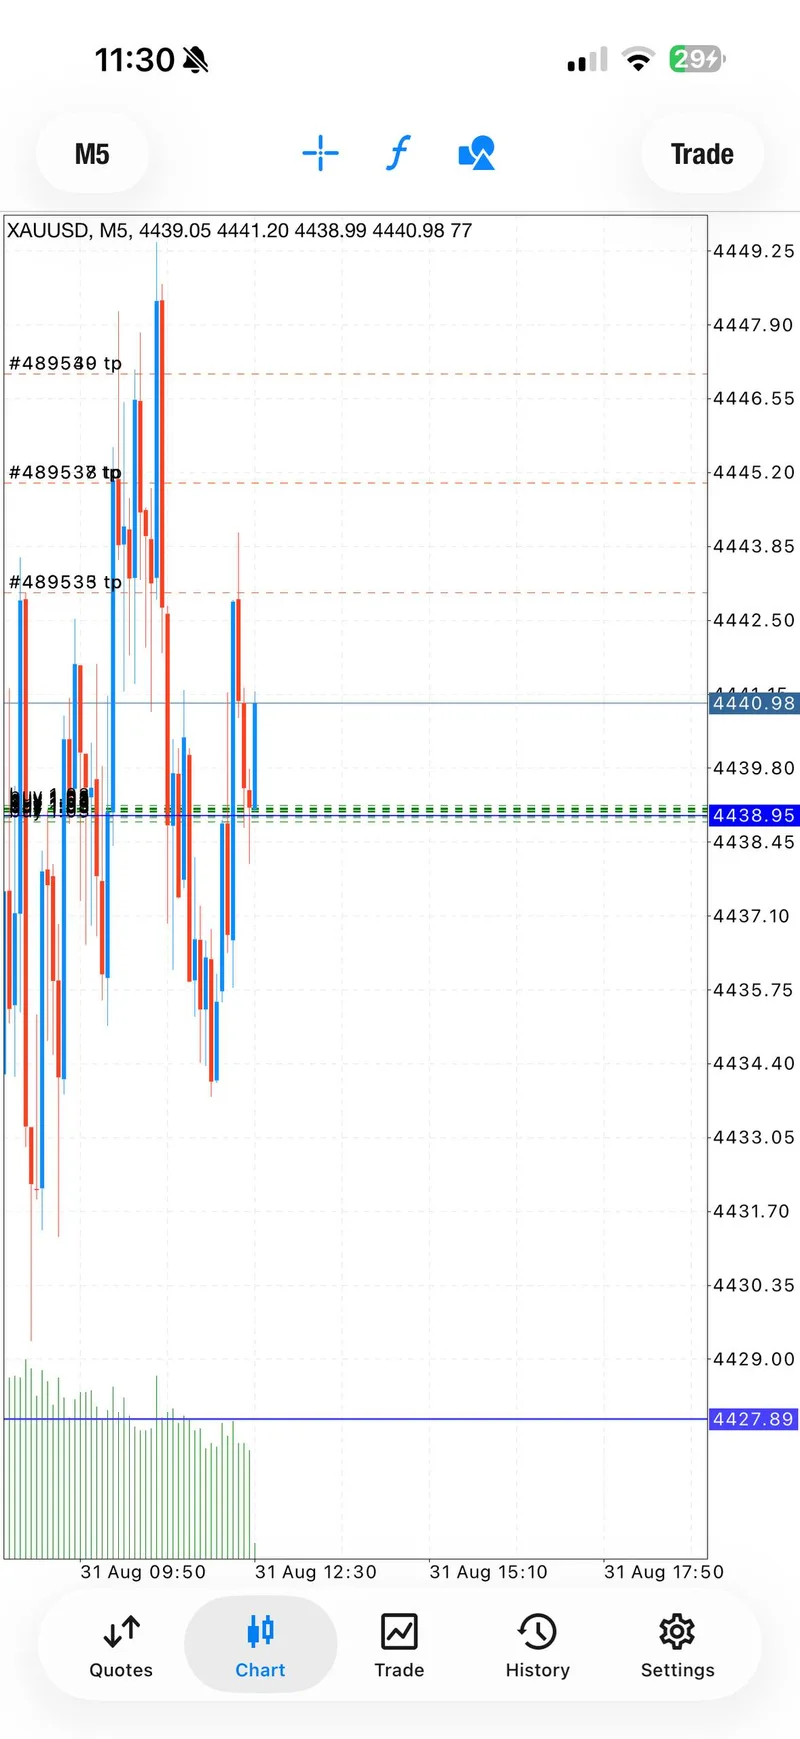
Monday opened with two BUY setups. The first was posted around 4438.8–4434 and the public record later marked all four fixed targets reached. The second arrived around 4454–4450 and was reported through three of four fixed targets, with breakeven instructions used to protect the remaining exposure.
The important part was not simply that price moved up. The management sequence was visible: take progress, reduce the chance that a winning idea becomes a full-risk trade again, and separate the result of one setup from the next. That is how a desk builds confidence without becoming careless.
The August 31 daily report preserves the two setups and the $19,000+ session label. The selected weekly image is evidence from the session, while individual account screenshots remain individual displays rather than proof of universal performance.
Tuesday: Sell the Market You Have, Not the Market You Want#
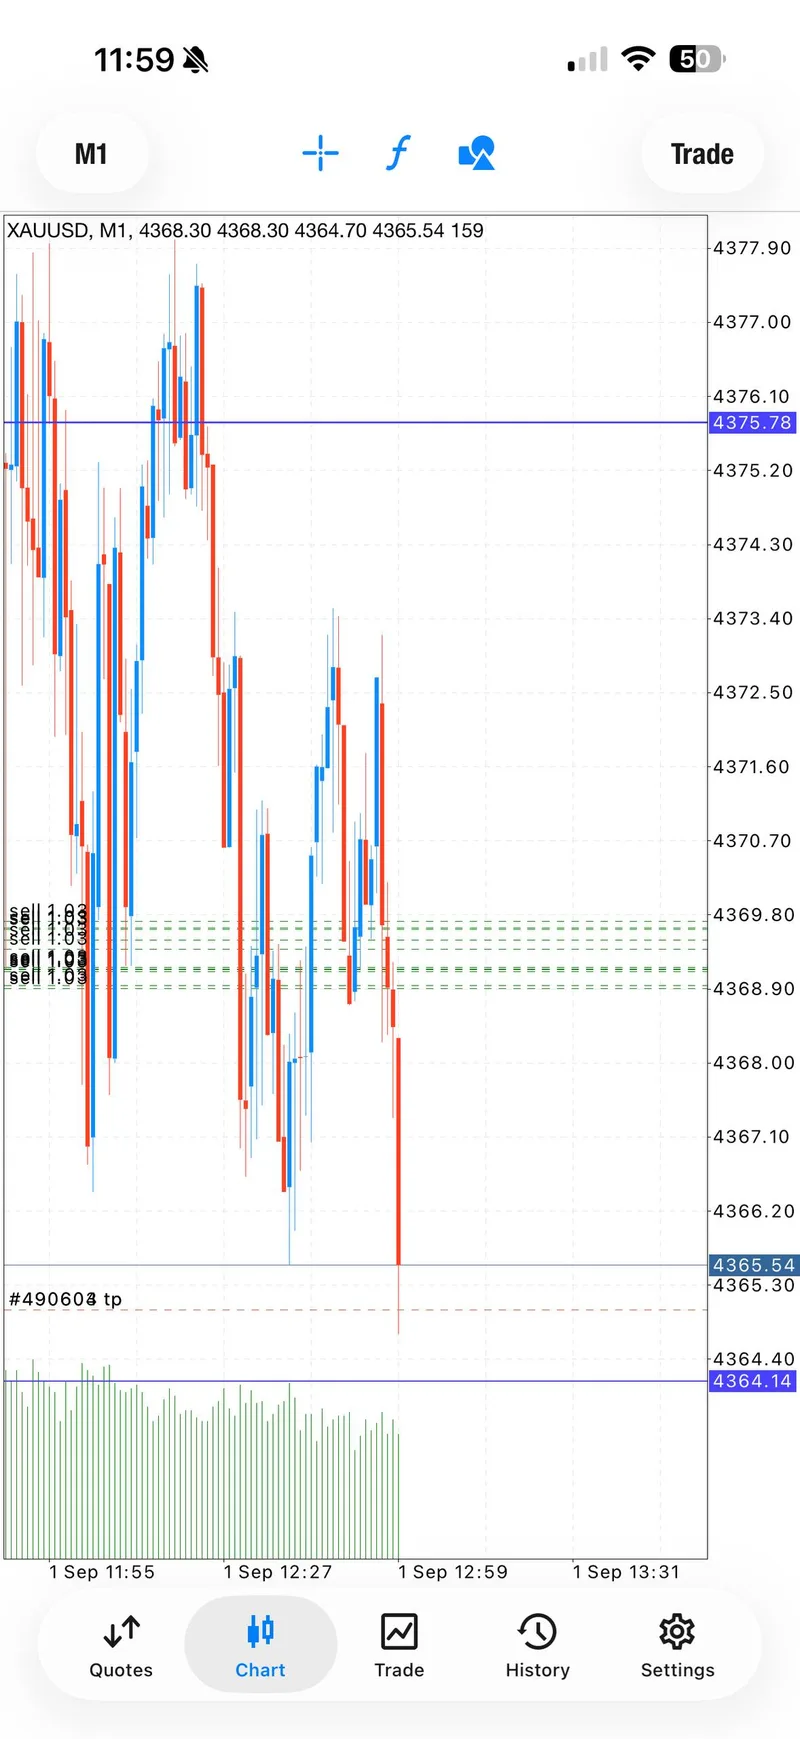
Tuesday required a full change of posture. Three SELL setups were documented as gold rejected higher prices and moved through staged targets. The final sequence was reported through all four published targets, followed by a clear instruction not to chase after the move had already extended.
That no-chase instruction matters. A strong move can tempt traders to enter precisely when the reward-to-risk has deteriorated. MO’s response showed the difference between identifying direction and forcing late exposure: the desk used the move, then stopped treating yesterday’s BUY logic as sacred.
The September 1 daily report documents the three plans, eight target milestones across the session, and the protection-first follow-through.
Wednesday: Two Failed Sells, Then a Real Recovery#
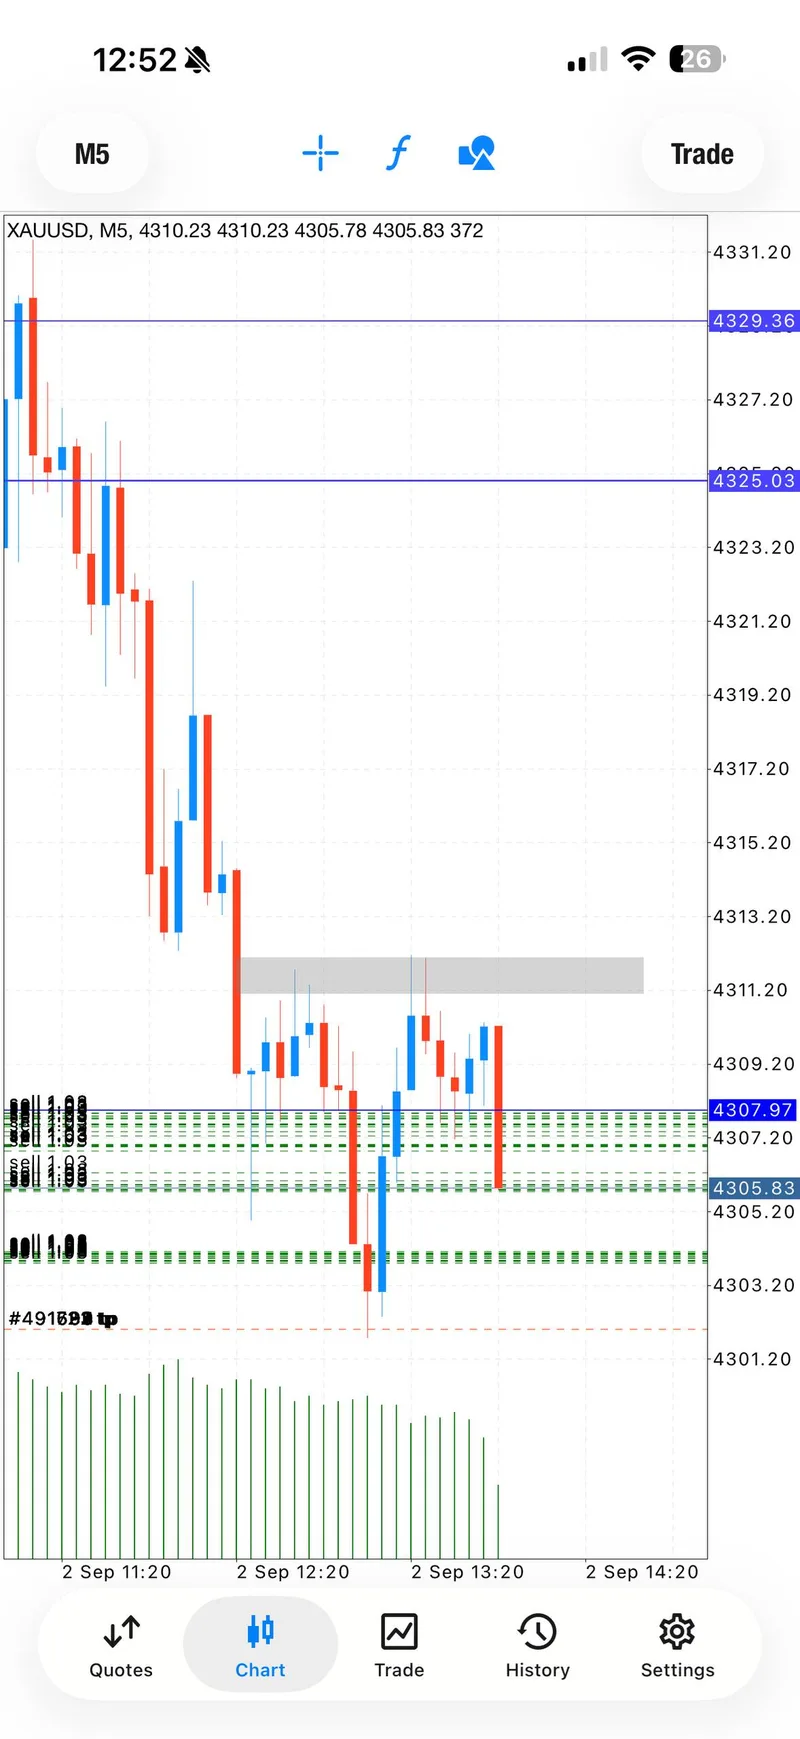
Wednesday was the hardest test of the week’s discipline. The source archive contained five signal-like items, but one was market commentary and one BUY message was the short form of the later fully parameterized BUY. The defensible public count is therefore three plans, not five.
The first two were SELL attempts that failed or were cut when the structure did not continue. That is uncomfortable but useful evidence. A professional recap should show the losing side of the decision process, because recovery only means something when the earlier pressure is visible.
The later BUY was the reset. It reached TP1 through TP4 before risk was moved to breakeven. MO did not recover by doubling down on the original bias; the desk recovered by accepting that the sell thesis had failed and taking the opposite setup only after a new structure appeared.
This was the week’s pivot: being wrong twice did not require being wrong a third time.
Thursday: Recovery Is a Process, Not a Slogan#
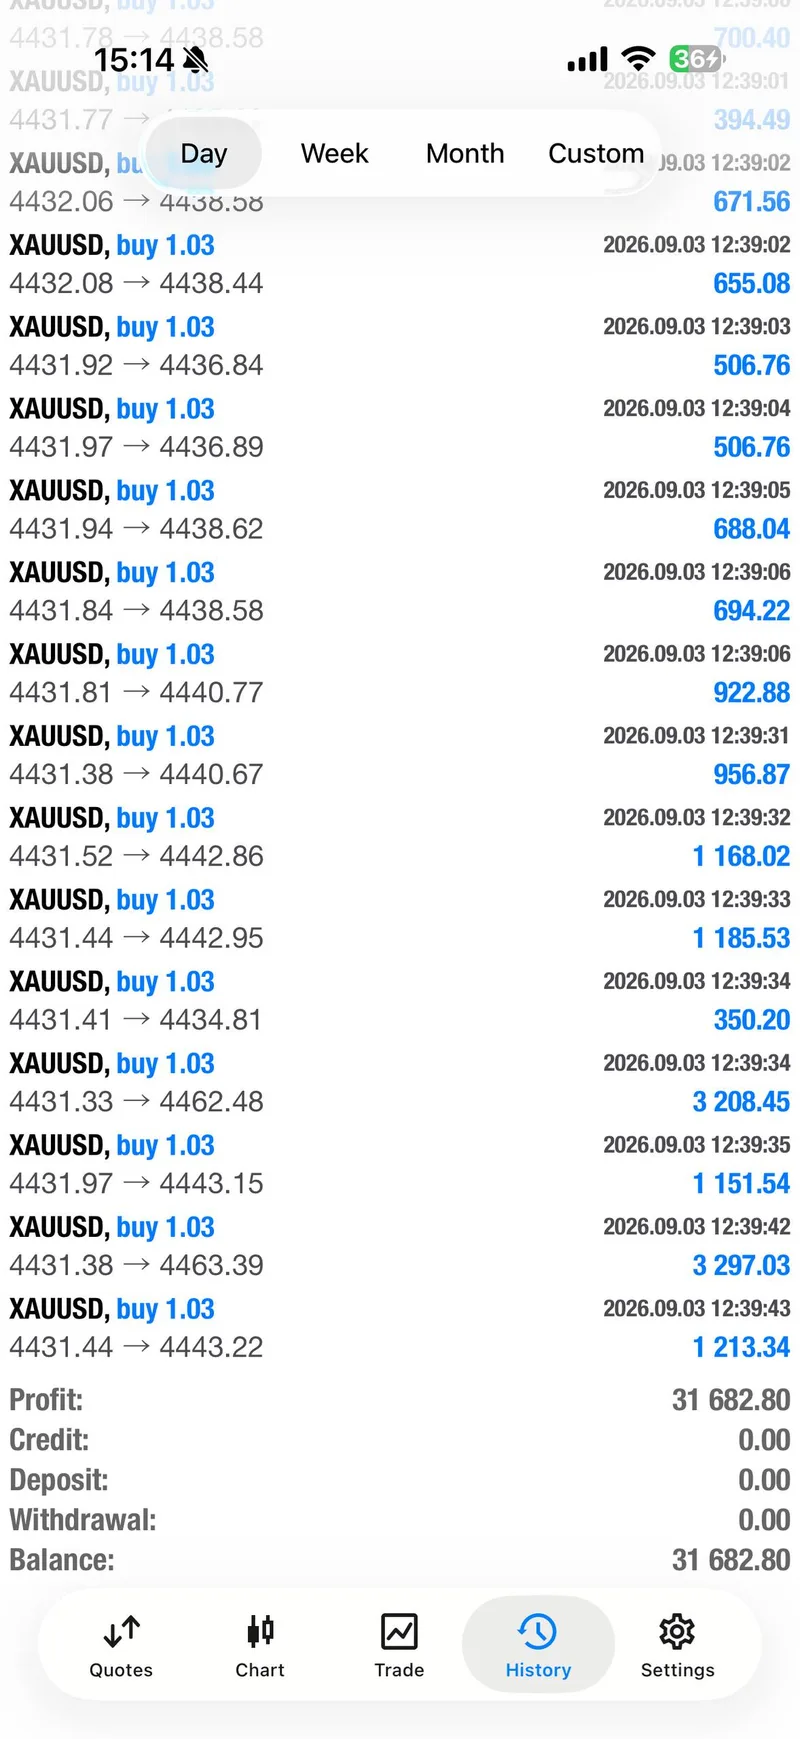
Thursday’s verified daily record documents two BUY plans and a publicly shared $31,000+ session archive label. The selected proof images support the session story, while the claim remains bounded to that daily record.
The trading value is still clear without inflating the number. Thursday showed what happens when recovery management carries forward: the desk did not erase Wednesday’s failed sells from the story, and it did not turn one account or channel label into a result for every reader. It showed the next sequence, the visible execution checkpoints, and the community response around them.
That distinction protects trust. Proof should make the trading process easier to inspect, not make the claim larger than the evidence.
Friday: The Win Was Knowing When to Stop#
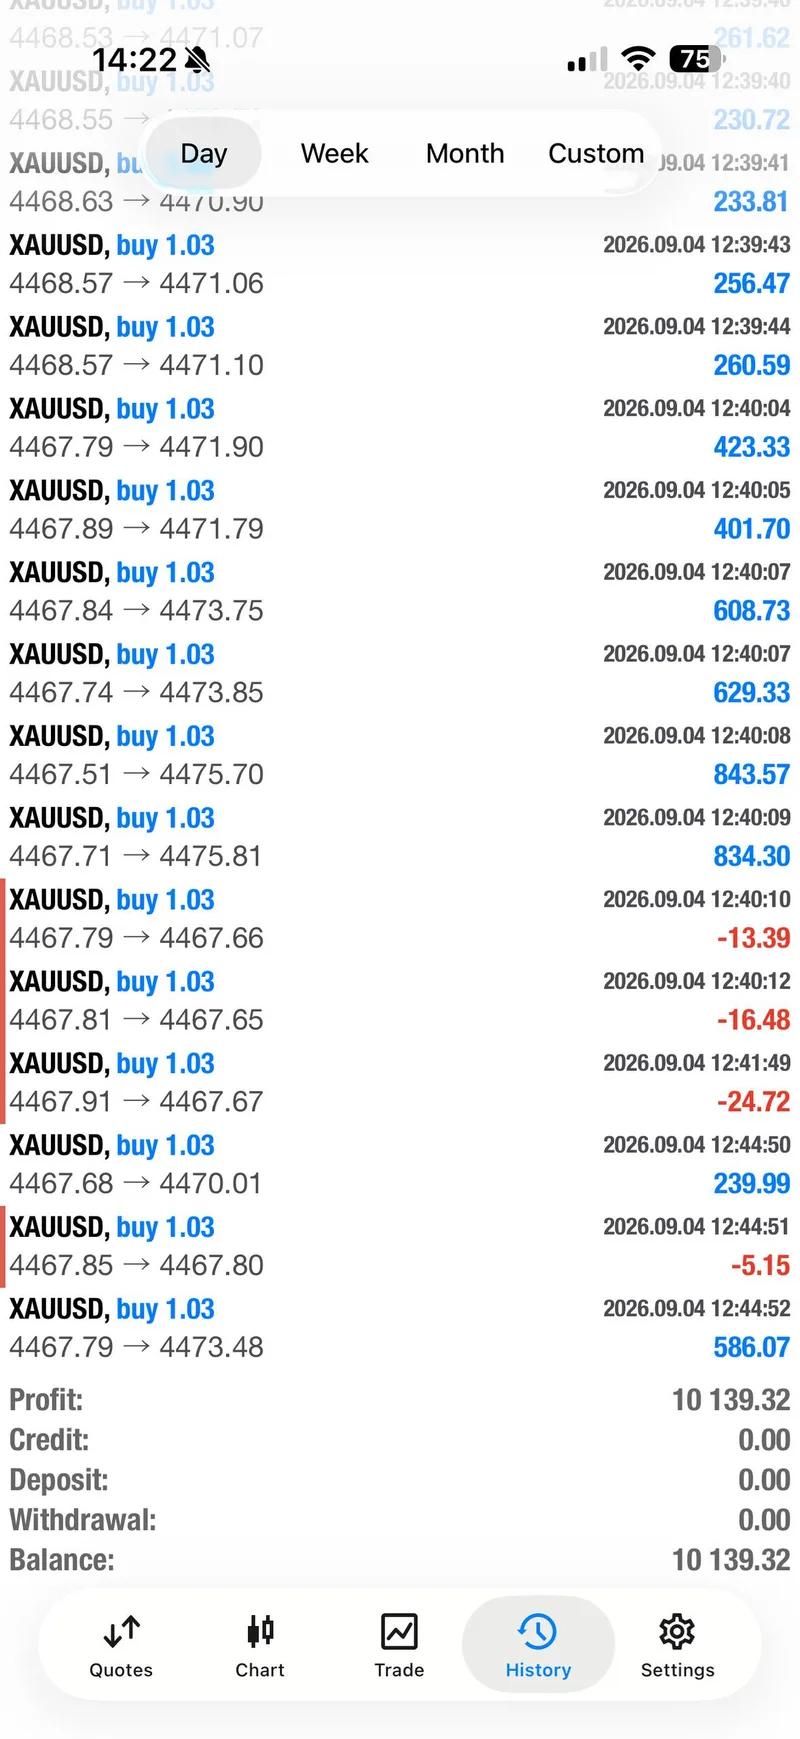
Friday brought two BUY entries in the public record, active management through TP1, TP2, and TP3, and repeated instructions to move to breakeven, avoid a late re-entry, and reduce exposure. The public channel later reported $10,000+ for the day.
Then MO stepped back. The desk explicitly recognized that NFP could drive violent movement, noted the conflict between a broadly bullish recent candle structure and a dangerous short-term bearish look, and chose not to keep trading without conviction.
That was not fear. It was professional risk selection.
Many traders judge discipline only by where they entered. Experienced traders also judge it by what they refused to trade. Friday’s strongest proof was the boundary: after a strong week and a protected result, MO did not need the next candle to validate the week.
The September 4 daily report records the recovery path and the event-risk backdrop. Its $10K label remains a session-level channel claim, and the larger weekly claim shared in the channel is deliberately not used as an audited total here.
What the Proof Actually Shows#
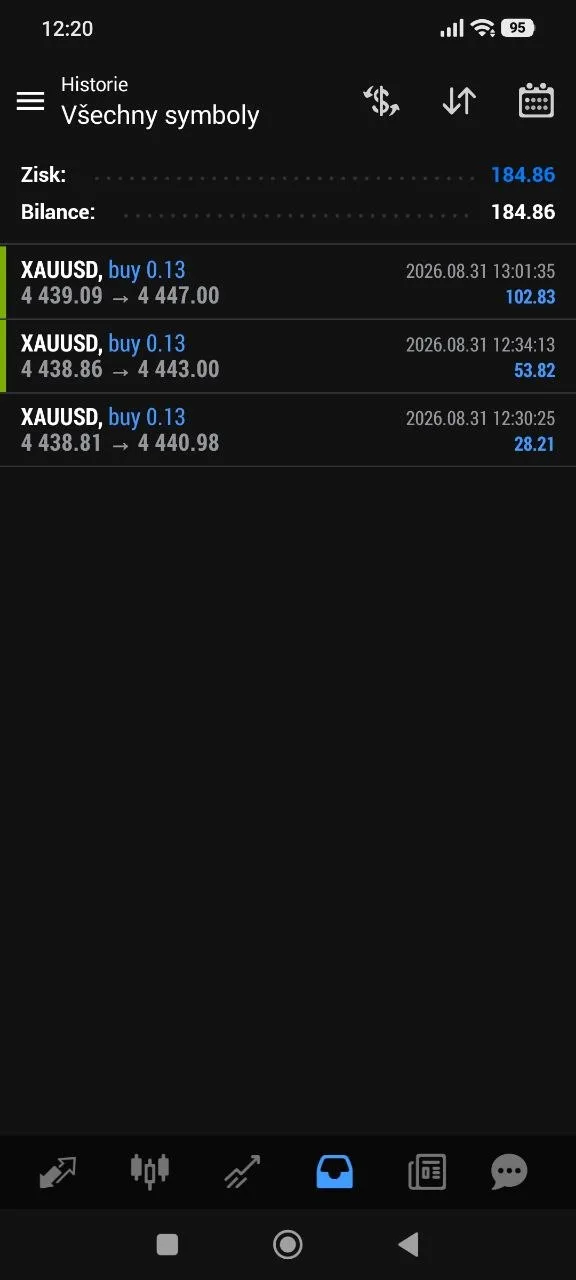
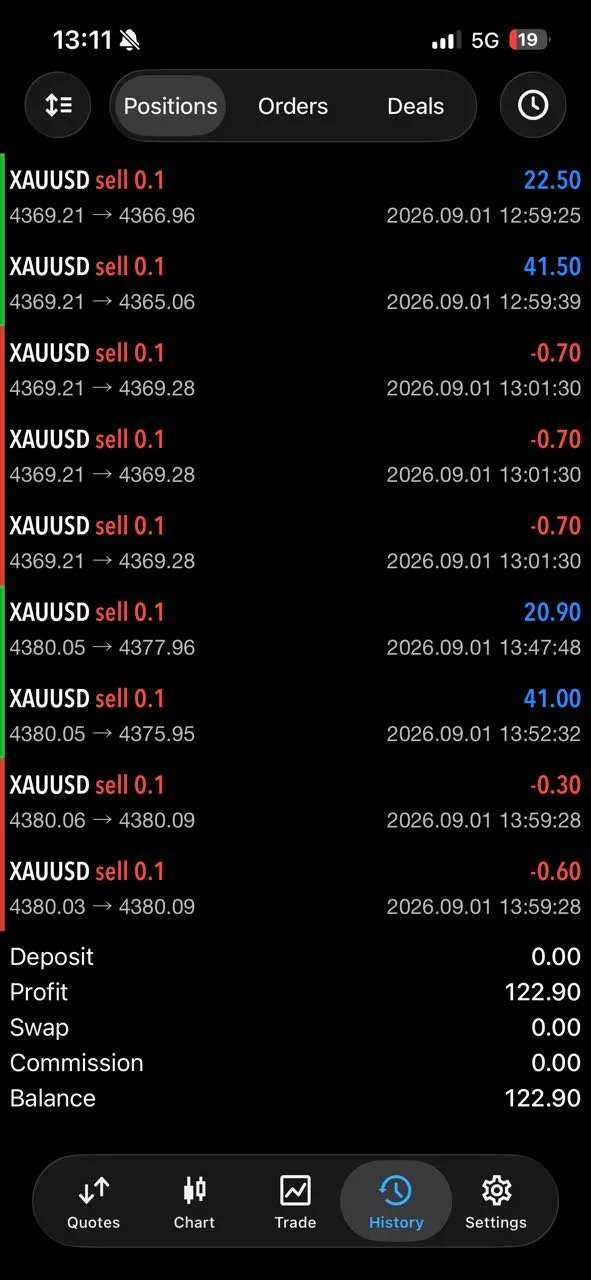
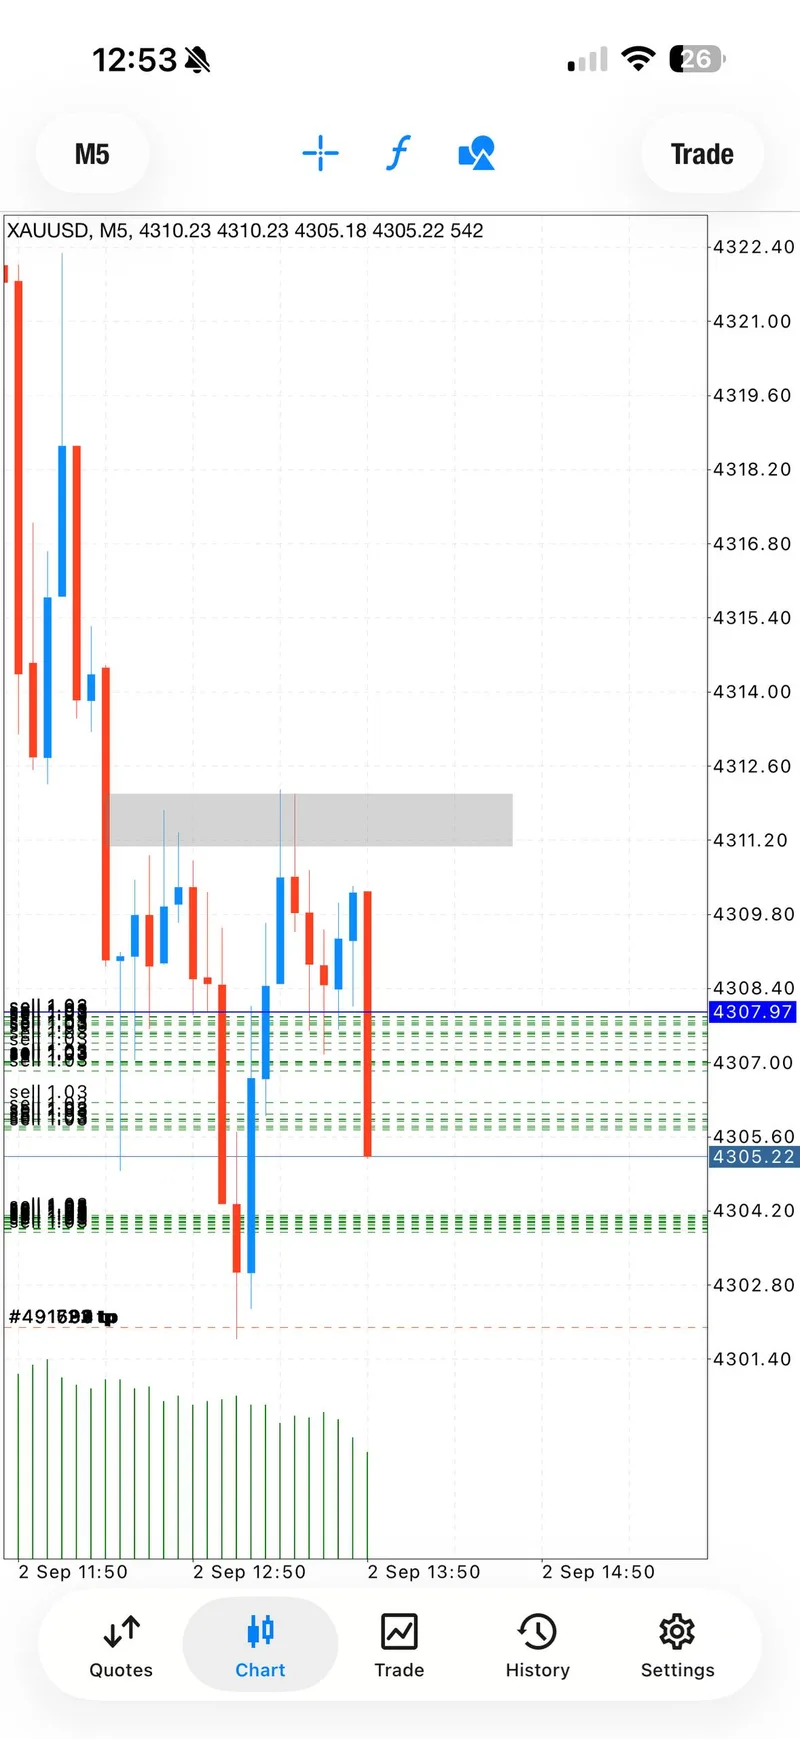
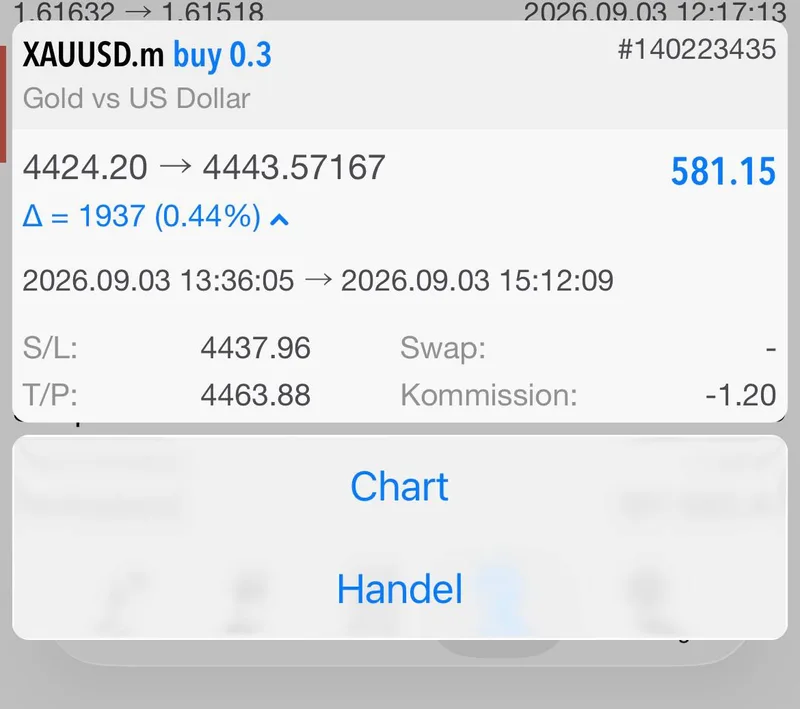
The selected weekly package contains five trade-proof screenshots and four community-proof screenshots. It is not a scoreboard for every message or every member. It is a curated evidence trail for the decisions that shaped the week:
- Monday shows BUY progression and protection.
- Tuesday shows SELL follow-through after the bias changed.
- Wednesday shows the pressure around the failed-sell-to-BUY recovery.
- Thursday shows the recovery archive and individual account context.
- Friday shows the protected result before the desk stopped for NFP risk.
Community screenshots add context, but each remains an individual outcome. They are not audited aggregate PnL, a typical result, or a forecast. That boundary makes the proof more credible, not less useful.
What Worked, What Failed, and Why#
The week rewarded four habits that matter beyond any single gold setup.
First, change direction when the market invalidates the original idea. Monday’s BUY logic did not prevent Tuesday’s SELLs. Wednesday’s failed SELLs did not prevent the later BUY recovery.
Second, make protection visible. Breakeven and partial-profit instructions appeared throughout the week. They reduced the need for every position to reach the final target before the trade could be considered well managed.
Third, consolidate the record honestly. Commentary and duplicate short-form entries are not extra trades. The public number is 12 documented plans, while the source archive contained 14 signal-like items.
Fourth, stop when the information quality falls. NFP was not the moment to force certainty from a mixed chart. The desk protected the result and waited for a cleaner next opportunity.
Key Levels and Scenarios for Next Week#
Friday’s available market record placed the nearest observed support around 4,380, with 4,282 as a deeper earlier-week reference. Resistance was framed around 4,500, then the 4,526 analytical area. These are scenario markers, not automatic entries.
If price can reclaim 4,500 and hold it after the payroll repricing, the next week may offer a cleaner recovery continuation toward the higher resistance area. The desk should still demand confirmation rather than assume Friday’s volatility has fully cleared.
If 4,380 fails quickly, the market may reopen the deeper 4,282 reference and produce another headline-sensitive tape. In that case, smaller exposure, faster protection, and fewer attempts would fit the lesson of this week better than trying to win every swing.
If price remains trapped between 4,380 and 4,500, patience is the setup. The week just demonstrated that forcing a permanent bias inside a changing market creates avoidable pressure.
For the forward-looking event map and conditional price paths, continue with the September 7–11 weekly gold forecast. You can also browse all weekly summaries to compare how execution decisions evolved across different market regimes.
FAQ#
Did GTMO make $91,000 this week?#
The channel shared a $91,000+ weekly claim on Friday, but this recap does not present it as an audited weekly total. The article uses only session-level labels with clear attribution and does not sum screenshots or account displays into a universal performance claim.
Why are there 12 plans instead of 14 signals?#
The daily source collection contained 14 signal-like detections. Wednesday included one market-commentary item and one short BUY message that belonged to the later parameterized BUY plan. Consolidating those items produces 12 documented plans across the five sessions.
What was MO’s best decision this week?#
The most transferable decision was to stop before NFP after protecting Friday’s result. It showed that risk control includes declining a trade when conviction and event conditions do not justify the exposure.
Follow the Next Decision, Not Just the Last Result#
This week was not professional because every idea worked. It was professional because the desk showed the full sequence: attack when structure was clear, protect when price paid, admit when a thesis failed, recover from the other side, and stop when the next risk was no longer worth taking.
For the next gold setup and to ask about free VIP access, message support @GTMOBest. Review the proof, understand the risk plan, and never treat a past result as a guarantee of the next one.
Risk disclaimer: trading involves risk, capital can be lost, and individual screenshots or past performance do not predict future results.