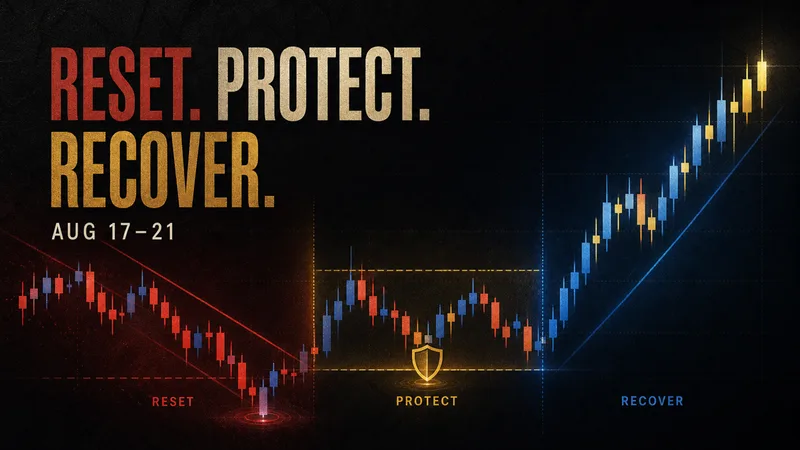
Weekly Market Overview#
Gold did not offer a clean, comfortable story from August 17–21. It forced the desk to reset after failed reads, protect progress when momentum became uncertain, and earn the right to press again when structure improved. That is the real story of this week: not perfection, but professional recovery under pressure. If you want to see how MO handles this kind of tape from inside the community, message @GTMOBest early and ask support about free VIP access.
Across five active trading days, the verified daily records contain 15 complete trade plans with entries, stops and targets. The public archive does not hide the difficult moments. Monday opened with a BUY that failed before later lower-zone sequences recovered the rhythm. Thursday again recorded a failed BUY before a SELL recovery and a final BUY managed to breakeven. Friday finished the week with four documented BUY setups, one failed read and three public 4/4 target reports. That progression—reset, protect, recover—is more useful than a win-only highlight reel because it shows where judgment actually mattered.
The market observations also require discipline. Monday's context used an approximate spot-style intraday snapshot around 4,396, while Friday's 4,638 observation was a delayed GC00 futures quote rather than a final New York settlement. Those are not equivalent closing feeds, so this recap does not invent a weekly percentage move from them. The defensible conclusion is qualitative: gold moved through sharp two-way pressure, then ended the observed week with stronger upside follow-through and an unsettled but bullish intraday backdrop.
| Verified weekly record | What it shows |
|---|---|
| Active trading days | 5 |
| Complete trade plans | 15 |
| Selected weekly package | 5 trade-proof images + 4 community-proof images |
| Dominant execution lesson | Reset quickly, protect progress, press only after confirmation |
| Late-week structure | Stronger upside follow-through, still sensitive to rates and dollar repricing |
What Drove Gold This Week#
The week's market context was not one tidy macro headline. Early sessions were dominated by narrow, unstable intraday zones. Monday's same-day reference sat around 4,392–4,405, and Tuesday remained volatile around the 4,385–4,403 area. By Wednesday, coverage described gold rebounding as the dollar weakened and bond yields eased while traders focused on the July FOMC minutes. Thursday brought another sharp rebound during a softer-dollar, lower-yield window, but New York trading was still open when the observation was captured.
Friday's backdrop was stronger but still unsettled. The same-day market context showed a delayed gold-futures observation above the prior settlement, the dollar near 98.79 and the US 10-year yield near 4.72%. Same-day commentary connected the move to rates, FX repricing and Treasury-liquidity headlines. These figures are context, not a promise that the next session will repeat the move.
That changing backdrop explains why one fixed bias would have been dangerous. The desk had to read whether pressure was structural or temporary, decide when a failed idea deserved closure, and distinguish a genuine recovery from a brief bounce. Readers can compare the completed week with the Weekly Gold Forecast August 24–28, 2026 and browse earlier Weekly Summaries for continuity.
Weekly Performance Snapshot#
The strongest number is not a grand total. It is 15 complete trade plans across the five daily records. Monday contributed four BUY plans. Tuesday documented two, a BUY recovery and later SELL follow-through. Wednesday recorded two defined BUY plans. Thursday documented three setups. Friday recorded four BUY plans.
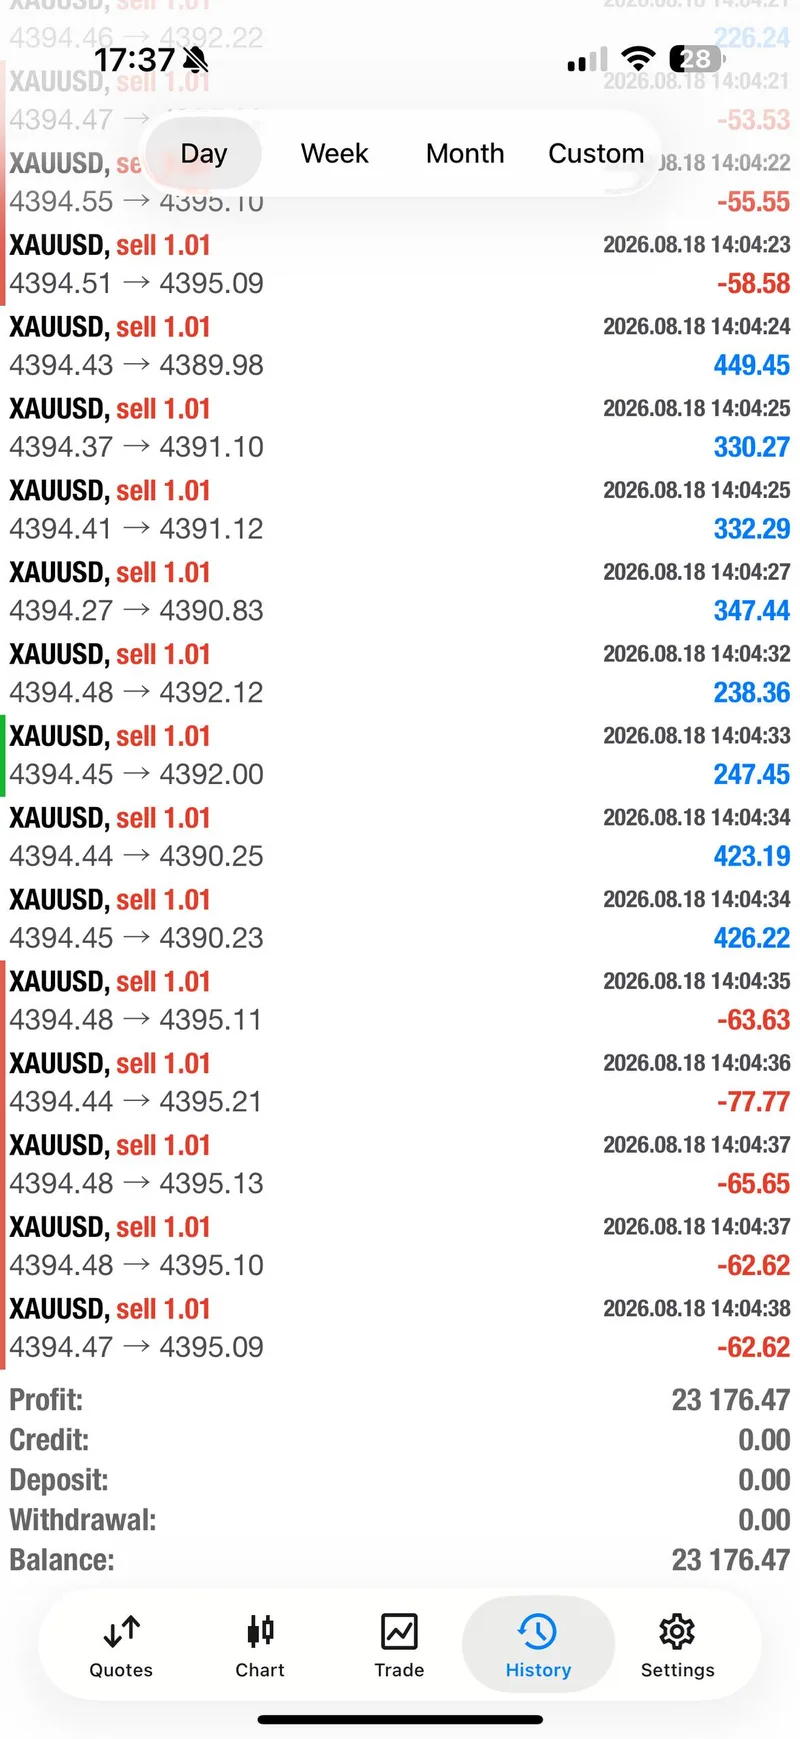
The selected weekly package contains five trade-proof images and four community-proof images. It is a curated evidence set, not the entire daily archive. Several daily pages contain more screenshots, including account-history views. An unaudited public screenshot from Tuesday displays $23,176.47; two unaudited public screenshots from Wednesday display $11,040.31 and $10,143.43. The amounts and account ownership were not independently verified. They are not typical results, are not added into a weekly profit total, and do not promise what another trader will achieve.
Best Trades and Recovery Moments#
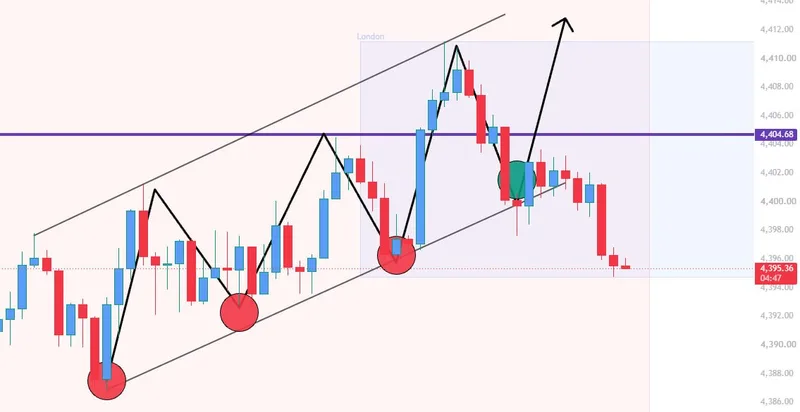
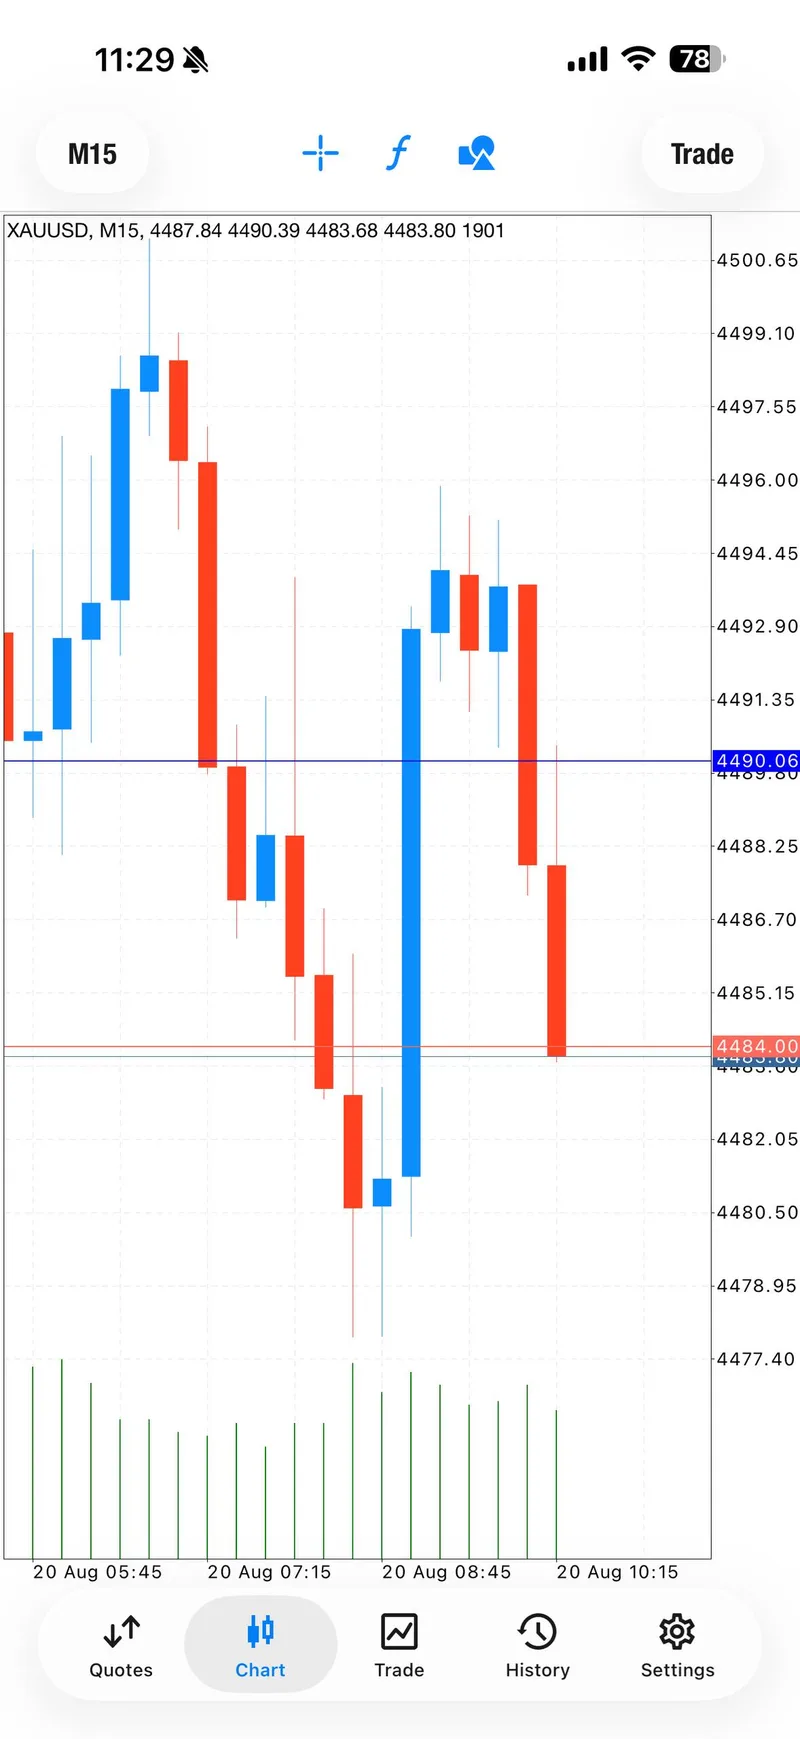
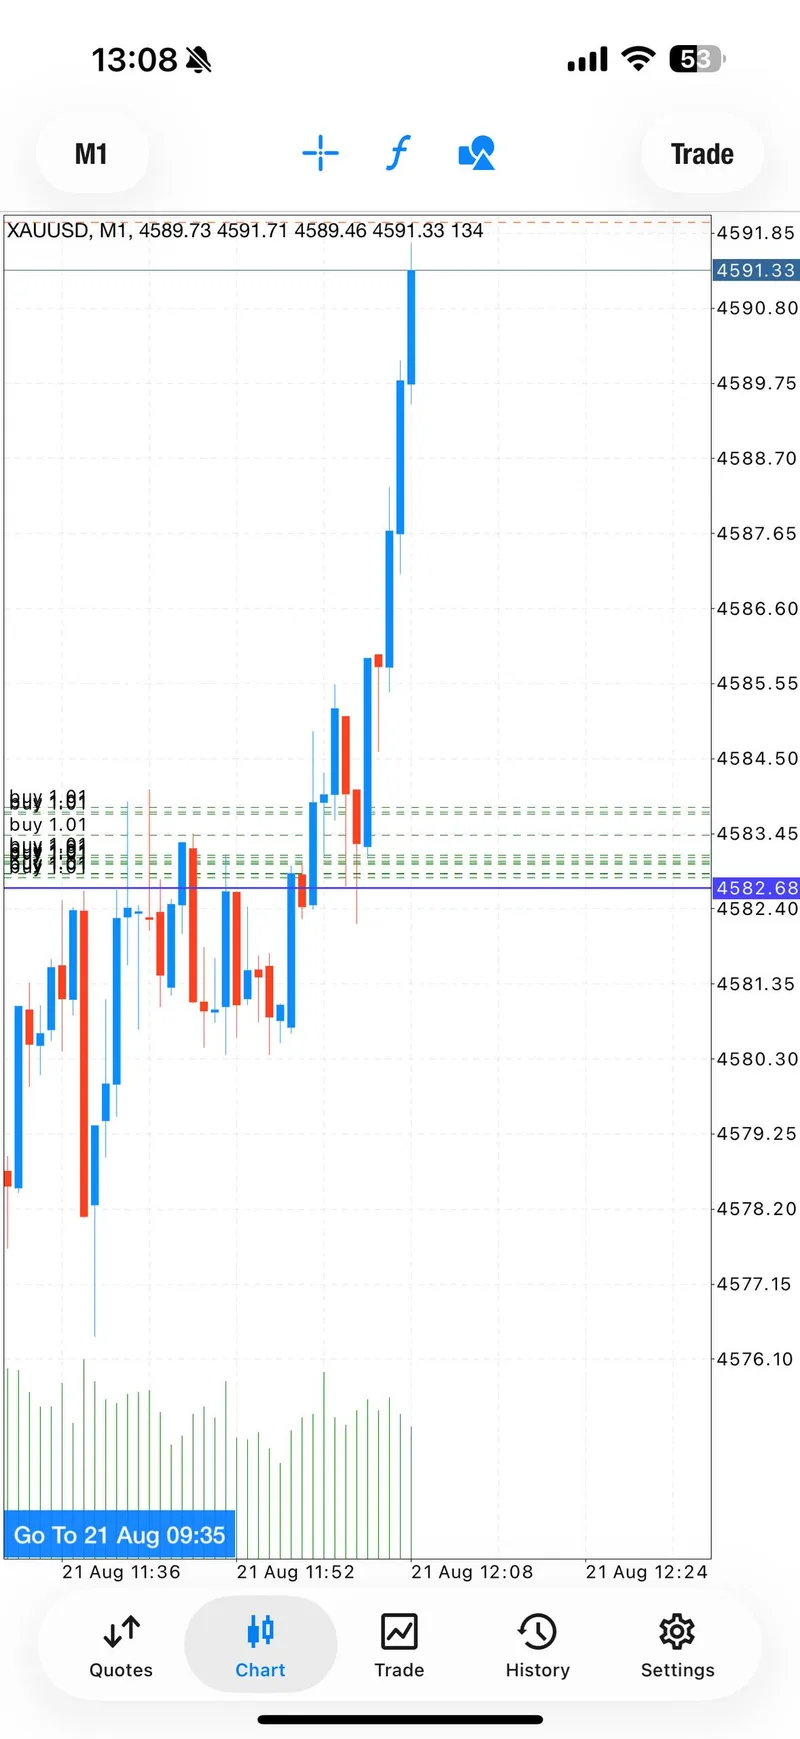
Monday established the week's character. The first defined BUY at 4405.4–4402 failed and was publicly closed. Instead of rewriting that loss out of the story, the desk reset lower. The next sequences produced staged target updates, repeated breakeven instructions and, later, a public report that all five posted target milestones had been reached. The professional moment was not the final celebratory line. It was the decision to acknowledge failure, move to a new zone and protect the recovery instead of chasing the original thesis.
Tuesday added a different test. A BUY recovery moved from the 4390.9–4388 area toward staged targets, while the later SELL from 4394.5–4398 reached reported downside progress before protection was secured. That was a two-direction session where adaptation mattered more than loyalty to one side.
Wednesday's two BUY setups again showed staged management: defined entry zones, stop levels, target ladders and lower-risk guidance. Thursday was the cleanest risk-management lesson of the week. The first BUY failed, the recovery SELL reached its reported first target, and the final BUY reached two reported targets before breakeven protection. Friday then delivered the clearest follow-through: four documented BUY setups, one failed read kept visible, and three public 4/4 target reports.
Day-by-Day Trading Narrative#
Monday — failure stayed visible, then the desk rebuilt#
The August 17 daily recap documents four complete BUY plans. The first failed. The later entries moved to lower zones, reported staged target progress and repeatedly returned to protection. That honest sequence is the foundation of the whole weekly story.
Tuesday — direction changed, risk discipline did not#
Two defined setups carried the day: a BUY recovery and a later SELL follow-through. One of 13 daily gallery screenshots is an unaudited public account-history view displaying $23,176.47. The amount and account ownership were not independently verified; the desk lesson is the willingness to change direction when the tape changed.
Wednesday — two defined BUYs, staged exits and account-specific proof#
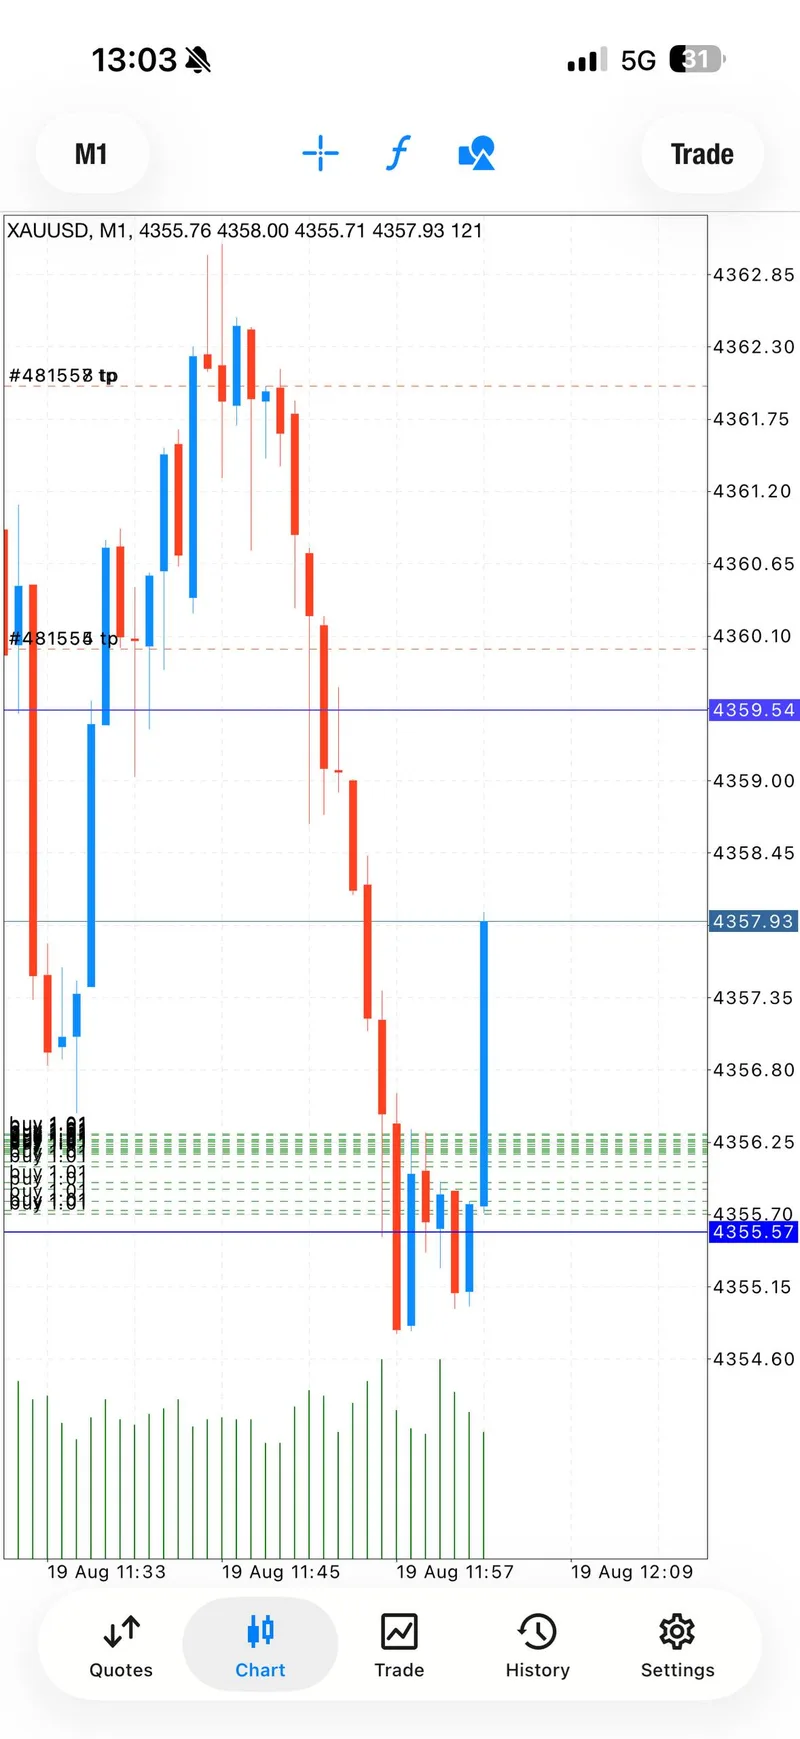
The August 19 daily recap records two fully defined BUY setups with target ladders and risk resets. Two unaudited public close screenshots display $11,040.31 and $10,143.43. Those amounts and account ownership were not independently verified, so they are not presented as typical or guaranteed outcomes.
Thursday — the purest reset-protect sequence#
The August 20 daily recap shows three setups: a failed BUY, a recovery SELL and a final BUY that reached reported TP1 and TP2 before moving to breakeven. This is what experienced execution looks like when the first read is wrong: invalidate, reprice, recover, then protect.
Friday — patience finally met cleaner follow-through#
The August 21 daily recap documents four parameterized BUY setups. One failed read remained in the record; three later setups received public 4/4 target reports. Friday did not erase the week's pressure. It showed what can happen when risk survives long enough to meet a cleaner structure.
What Worked, What Failed, and Why#
What worked was fast acceptance. On both Monday and Thursday, the record clearly states that a BUY idea failed. Closing the argument with the market created room for a better decision. Defined zones also worked: the strongest sequences had explicit entries, stops, target ladders and protection updates. Finally, staged management worked. Breakeven was not an afterthought; it appeared repeatedly when open progress needed defending.
What failed was forcing continuity where none existed. The market rotated too aggressively for a permanent BUY or SELL narrative. Short entry alerts only became part of this weekly record when the full plan—entry, stop and targets—was clear. And account screenshots would fail the trust test if they were turned into a combined weekly-profit headline. They remain individual evidence, separated from the desk-wide setup count.
The lesson is simple but difficult to execute: experience is visible in what the desk refuses to do. MO did not hide invalidation, did not treat every bounce as confirmation, and did not allow one strong account screenshot to become a promise. That restraint is part of the edge.
Community Proof and Trader Confidence#
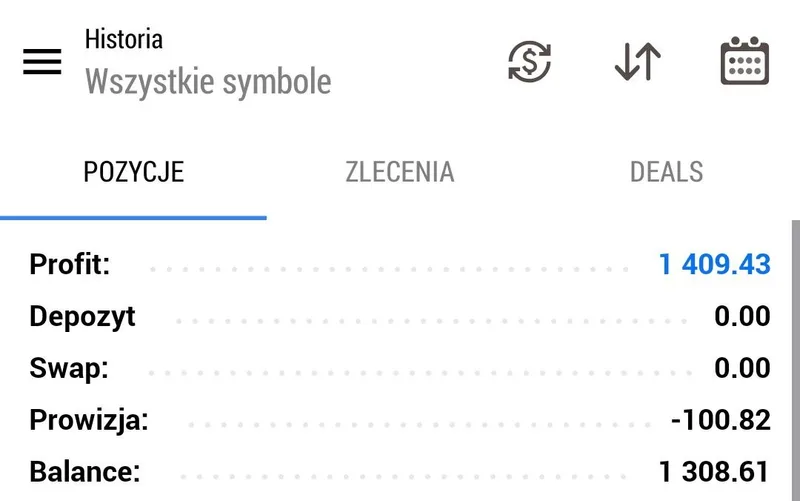
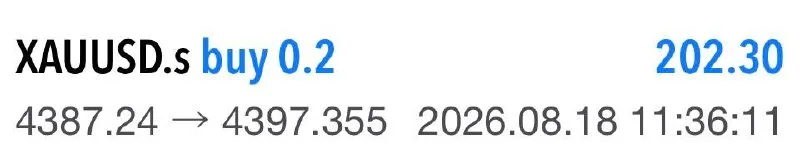
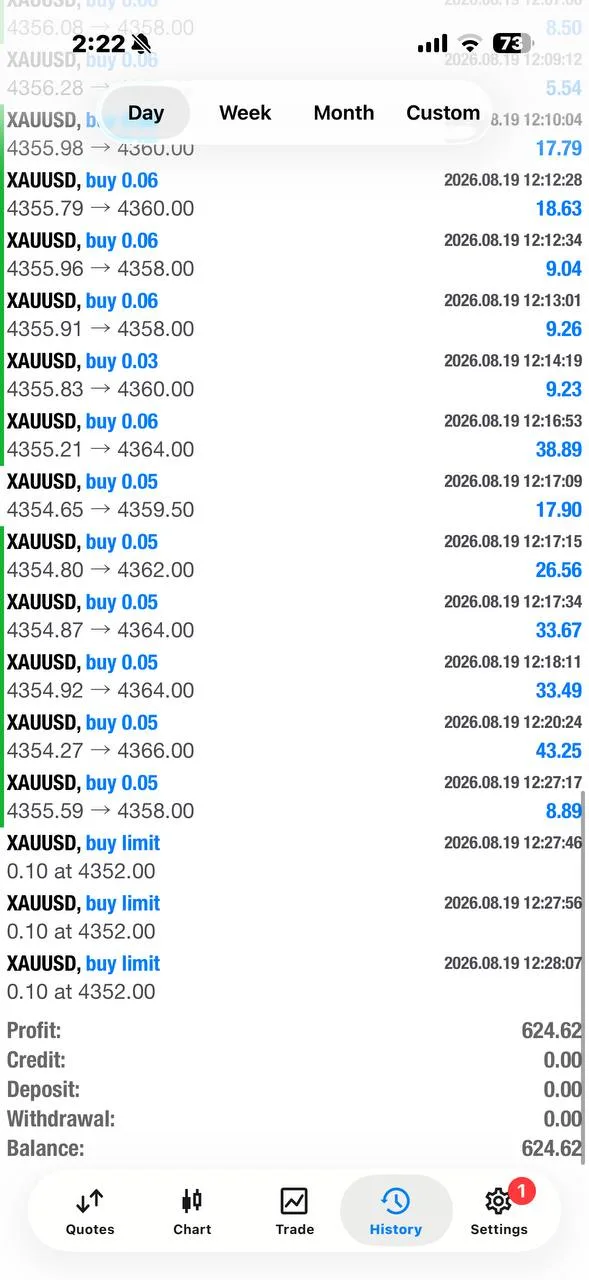
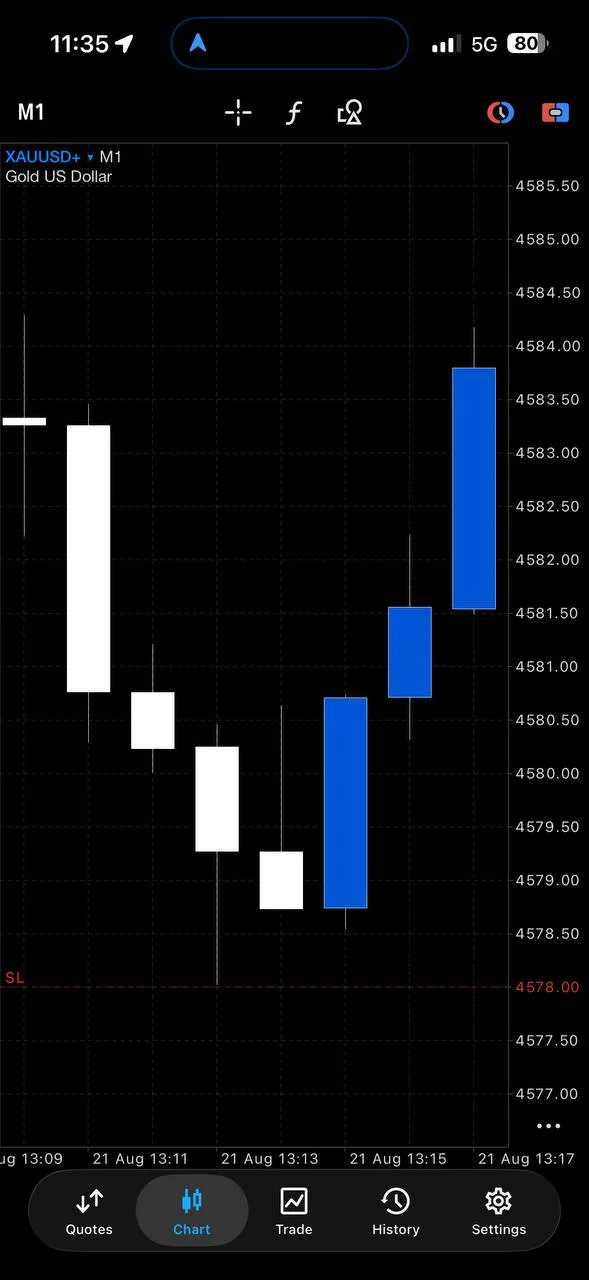
Community response stayed active through the pressure and recovery phases. The selected weekly package includes four community-proof images alongside five trade-proof images. These are representative selections from larger daily galleries, not a claim that every reader had the same result.
The useful trust signal is not excitement alone. It is that members could see the failed reads, protection calls and later recoveries in sequence. A community becomes more credible when the difficult part is preserved beside the successful part. That is why the gallery sits next to the execution story instead of replacing it.
Key Levels and Scenarios for Next Week#
Friday's market context placed approximate support around 4,545, then 4,500–4,514, with resistance near 4,600 and 4,620–4,640. These are scenario references from August 21, not live instructions. Check current price and conditions before acting.
If support around 4,545 holds and price can accept above the 4,600 area, the late-week recovery may develop into cleaner continuation. In that case, the desk can prioritize confirmed structure and protect progress beneath the new acceptance zone rather than chasing the first spike.
If 4,545 fails quickly, the move risks becoming another headline-sensitive reset. The 4,500–4,514 area then becomes the next reference zone, but a touch alone is not confirmation. A failure there would invalidate the clean-recovery thesis and reopen a much noisier two-way tape.
If resistance at 4,620–4,640 rejects price while yields or the dollar reprice higher, the correct response is not to defend Friday's narrative at all costs. It is to reduce exposure, wait for a fresh structure and let the market prove which side deserves risk. For the forward scenario map, read the August 24–28 XAUUSD outlook.
FAQ#
Did MO win every setup this week?#
No. The record includes failed BUY setups on Monday, Thursday and Friday. The value of the week is in how those failures were closed, repriced and followed by more disciplined sequences.
Does the $23,176.47 screenshot represent the whole week?#
No. It is an account-specific screenshot from Tuesday's evidence. It is not a weekly total, a typical result or a guarantee.
What makes a setup part of the weekly count?#
A setup enters the weekly count when the daily record contains a complete plan with entry, stop and target levels. Short opener or re-entry alerts are not counted again when they belong to that same plan.
How can I ask about free VIP access?#
Message @GTMOBest. Support can explain the current free VIP access path and where to follow the latest gold context.
Connect with Gold Trader Mo#
The week proved that trust is built in the reset, not only in the result. If you want to follow how an experienced gold desk manages pressure, protection and recovery in real time, visit Gold Trader Mo and message @GTMOBest to ask support about free VIP access.
Trading involves risk. Results vary, capital can be lost, and past performance does not guarantee future outcomes. This recap is historical education and commentary, not financial advice or a live trade instruction.