
Weekly Gold Forecast Snapshot#
Gold enters August 24-28 with a late-week thrust that now has to prove it can hold. The first test is not a dramatic prediction; it is whether the $4,620-$4,640 area can turn from resistance into accepted trade. If it cannot, $4,545 is the first support that matters, followed by the $4,500-$4,514 defense band. Message @GTMOBest early if you want MO's live context around the Wednesday data cluster and Friday's Fed Chair keynote; this is the week where waiting for the right confirmation can matter more than chasing the first candle.
The MO thesis is simple: Wednesday brings a concentrated growth-and-inflation read, while Friday brings the official Kevin Warsh keynote at Jackson Hole. Those are two separate verdicts on the same question: can gold extend the recovery while the dollar and Treasury yields remain a constraint? The latest available Friday reference was a delayed GC00 futures quote near $4,638 at 09:05 ET, not a universal spot close or final settlement. DXY was observed near 98.79 and the U.S. 10-year yield near 4.72%, both approximate context rather than precision claims.
For readers searching for a weekly gold forecast or XAUUSD weekly outlook, the useful answer is a decision map. MO's editorial weights are 45% base-case rotation, 35% bullish continuation, and 20% bearish rejection. These are conditional planning weights, not a promise, signal, or statistical certainty.
Where Gold Stands As The Trading Week Gets Underway#
The late-week move improved the tone, but it did not remove the market's main tension. Gold is trying to press higher while yields remain elevated enough to challenge a non-yielding asset and the dollar remains strong enough to cap a fast extension. A clean breakout therefore needs cross-asset agreement. Price must hold the upper band, yields must avoid a fresh acceleration, and the dollar must stop acting like a one-way headwind.
That is why the opening sessions deserve patience. A quick push through $4,620-$4,640 can be a real expansion, but it can also be an event-positioning squeeze. The difference shows up in the retest: accepted strength holds the zone and builds above it; rejected strength falls back through the band and sends the market toward $4,545. MO is watching the quality of the hold, not just the size of the first move.
The broader backdrop is also deliberately labeled. The gold reference is delayed futures data with instrument and timestamp caveats. DXY and the 10-year are approximate observations. No single feed is promoted as a universal Friday close, and no target is presented as guaranteed. That keeps the forecast useful when the market opens with a different quote or when spot and futures diverge.
For continuity, compare this outlook with the previous weekly gold forecast, the daily reports, and the weekly summaries archive. The daily view gives the session detail; this forecast supplies the week-level decision framework.
The Main Drivers That Could Move Gold This Week#
The calendar is not overloaded with headline releases every day, but it is concentrated where it counts. Monday and Tuesday are positioning sessions around Treasury supply and housing. Wednesday at 08:30 ET is the information wall: GDP's second estimate, corporate profits, Personal Income and Outlays including the PCE price measures, and Advance Durable Goods all arrive in the same window. Thursday adds another growth checkpoint and the opening of Jackson Hole. Friday at 10:00 ET, or 21:00 GMT+7, brings the official Fed Chair keynote.
The market reaction matters more than the label. Strong growth paired with firmer yields and a stronger dollar would challenge gold's upper-band acceptance. A softer inflation interpretation paired with easing yields could remove the first obstacle, but gold still has to hold the breakout zone. A mixed release can produce a violent first move and then a range; that is why MO will read the second reaction and the next retest rather than announce a verdict from the first spike.
Treasury auctions are part of the rates channel rather than automatic gold catalysts. The official Q3 schedule places short bills on Monday and Tuesday, 2-year/5-year supply on Wednesday, and 7-year supply on Thursday. The schedule confirms the dates but not exact auction times, so no unsupported clock time is used here. The question is whether the yield curve absorbs supply calmly or forces a repricing that changes the dollar's direction.
The gold scalping strategy guide is useful for shorter execution context, but this week needs a wider lens. The key risk is not missing one number. It is confusing a headline reaction with a durable change in real-yield pressure.
Key Technical Levels and Decision Zones#
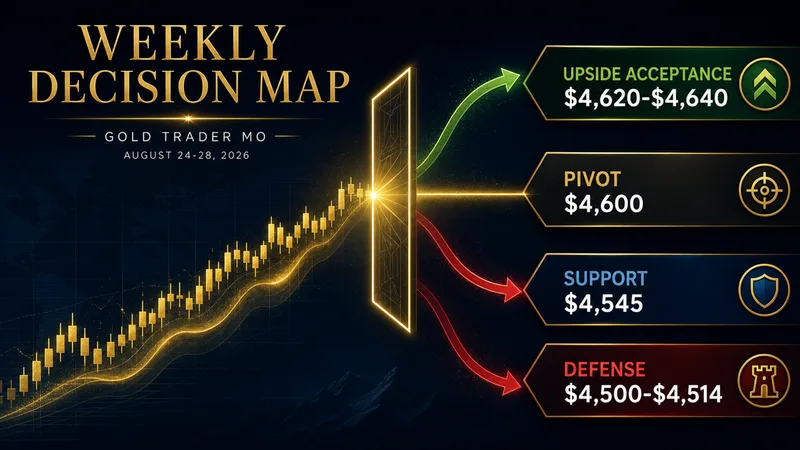
The decision map is intentionally compact:
- $4,620-$4,640: first upside acceptance band. A brief print above it is not enough; MO wants a hold, a retest, and evidence that the dollar/yield response is not immediately reversing the move.
- Around $4,600: psychological pivot inside the upper structure. Losing it after a failed breakout would make the move look more like rejection than continuation.
- Around $4,545: first support and the first place where dip demand has to show itself.
- $4,500-$4,514: deeper downside defense band. Sustained acceptance below it weakens the recovery thesis and reopens a more defensive path.
These are approximate editorial zones derived from the latest dated market-context references, not guaranteed fills, broker levels, or trade instructions. The technical rule is acceptance versus rejection. Above $4,640, the bullish case needs continuation quality. Below $4,545, the base case is under pressure. Below $4,500-$4,514, the bearish path has stronger evidence. The same zones let a non-technical reader understand the week immediately: gold either proves the upper band can become support, or it falls back into the defense map.
Bullish, Base, and Bearish Scenarios#
Bullish scenario#
MO assigns this path 35%. Gold holds above the $4,620-$4,640 band after a clean acceptance attempt, while DXY loses momentum or yields stop rising in tandem. The trigger is not a wick; it is sustained trade above the band followed by a successful retest. The path is extension and higher acceptance, with the next objective determined by actual follow-through rather than a pre-written number.
The bullish case is invalidated by a fast rejection back below $4,600, especially if the rejection arrives with a firmer dollar and higher Treasury yields. A softer Wednesday inflation interpretation can help, but it cannot substitute for price acceptance. If gold cannot hold the breakout after the macro cluster, MO demotes the bullish path even if the first headline reaction was positive.
Base scenario#
MO assigns this path 45%. Gold rotates between the $4,545 support area and the $4,620-$4,640 acceptance band while the market waits for the Wednesday data cluster and Friday policy communication to align. This is not a lazy middle ground. It is the most defensible plan when the rates and dollar channels are still capable of interrupting a strong chart.
The base case is triggered when price holds above $4,545 but cannot secure acceptance over $4,640, with macro data producing mixed or short-lived cross-asset reactions. It is invalidated by sustained acceptance above the upper band or by a decisive loss of the $4,500-$4,514 defense area. In this scenario, patience is an edge: the market needs to show which side is willing to defend its level after the headline has passed.
Bearish scenario#
MO assigns this path 20%. Gold rejects the upper band, loses $4,545, and then cannot recover the $4,500-$4,514 defense area while the dollar and yields strengthen together. The bearish path is not triggered by one red candle. It needs accepted downside and a macro response that explains why dip buyers are no longer able to repair the move.
The bearish case is invalidated if price quickly reclaims $4,600 and then retakes the upper band with calmer yields. A stronger growth release alone is not enough to make the bearish path durable if the dollar fails to follow and gold recovers its level. This is the practical risk frame: watch the cross-asset confirmation, not the headline emotion.
Economic Calendar and Market Risks#

Here is the week in GMT+7, with U.S. Eastern Time retained for clarity:
- Monday, August 24: U.S. Treasury 13-week and 26-week bill auctions. The official schedule confirms the session, but does not provide an auction time.
- Tuesday, August 25, 21:00: New Residential Sales for July. Treasury 6-week bill and 2-year note auctions are also scheduled in the U.S. session; no unsupported auction time is promoted.
- Wednesday, August 26, 19:30: GDP second estimate and corporate profits for Q2, Personal Income and Outlays including PCE price data for July, and Advance Durable Goods for July. This is the week's main data cluster.
- Thursday, August 27, 19:30: Advance Economic Indicators for July. The Jackson Hole Economic Policy Symposium also runs August 27-29. Treasury 7-year note supply is scheduled in the U.S. session.
- Friday, August 28, 21:00: Federal Reserve Chairman Kevin Warsh's keynote remarks at Jackson Hole, according to the official Federal Reserve calendar.
The Wednesday cluster can move yields and the dollar before the chart has time to settle. Friday's keynote can then extend or reverse that repricing. That sequence creates reasonable urgency without hype: there are two decision points, and a reader who wants MO's live interpretation should message @GTMOBest before the market is forced to choose.
Geopolitical risk remains a separate override. It is not inserted into the base case without evidence, but a sudden shock can change safe-haven demand, oil sensitivity, and dollar behavior faster than the scheduled calendar. Keep the scenario map flexible if an external event changes the cross-asset tape.
What Traders Should Watch Day by Day#
Monday and Tuesday are about the opening range. Does gold defend $4,545 on pullbacks? Does it approach $4,620-$4,640 and hold, or does every rally get sold? Those sessions are useful for identifying whether the market is building a base or merely waiting for Wednesday. They are not a reason to force a weekly direction before the main evidence arrives.
Wednesday is the first real verdict. Read GDP, PCE-related price data, income and spending, and durable goods as one cluster. Watch the 2-year and 10-year yields and DXY alongside price. A bullish gold reaction that cannot hold after the first thirty minutes is weaker than a slower move that survives the full U.S. session.
Thursday is a confirmation day. The Advance Economic Indicators release is secondary, while Jackson Hole risk begins to build. If gold is above the upper band, the question is whether it can stay there with policy communication approaching. If gold is below $4,545, the question is whether sellers can keep the breakdown orderly rather than allowing a fast recovery.
Friday is the second verdict. The 10:00 ET keynote is a volatility event, not a promised direction. MO will care about whether the actual message changes yields and DXY, then whether gold accepts the move. The late-week close matters more than the first headline spike because it shows whether the market has adopted a new path.
How To Think About Positioning This Week#
The cleanest approach is to let the market earn conviction. In the base case, respect the edges of the map and avoid turning a temporary headline move into a permanent thesis. In the bullish case, require the upper band to become support. In the bearish case, require accepted trade below the deeper defense band. This is risk framing, not a promise of profit.
The most important invalidation is behavioral: if your thesis needs a level to hold but you keep explaining away repeated failures, the thesis is already weakening. Conversely, if gold holds a level through Wednesday and Friday risk while the dollar and yields stop pressing, the market is giving the bullish case more evidence. Keep the size of any decision proportional to the evidence available, and remember that trading involves risk and capital can be lost.
Readers who want more continuity can follow Gold Trader Mo, the market-analysis archive, and the previous weekly forecast. The weekly map tells you what matters; the daily reports show how the evidence changes.
FAQ#
What is the main catalyst for gold this week?#
The main catalyst window is Wednesday, August 26 at 19:30 GMT+7, when GDP's second estimate, corporate profits, Personal Income and Outlays including PCE price data, and Advance Durable Goods arrive together. Friday's 21:00 GMT+7 Fed Chair keynote at Jackson Hole is the second major decision point.
What is the key upside level for gold this week?#
The first upside acceptance band is $4,620-$4,640. A print above it is not enough; the bullish case improves only if gold holds the band on a retest while the dollar and Treasury yields do not reassert control.
What invalidates the recovery thesis?#
The first warning is a sustained loss of $4,545. The deeper invalidation is accepted trade below $4,500-$4,514, especially if DXY and Treasury yields strengthen together.
Connect with Gold Trader Mo#
This forecast is for education and market commentary, not individualized financial advice. For MO's live desk context around the two decision points, message @GTMOBest to ask about free channel access. The earlier you have the map, the easier it is to judge the reaction without chasing it.
Disclaimer#
This weekly forecast is for education and commentary only. Trading involves risk, capital can be lost, and past performance never guarantees the next session will look the same.