
Weekly Gold Forecast Snapshot#
Gold’s rebound has reached its first real test: can buyers hold the recovery through a new inflation reading, or does it fade back into the range? For October 12–16, 2026, the main checkpoints are Wednesday’s US CPI, Thursday’s PPI, and the $4,170–$4,240 decision area. A move above $4,240 that survives a retest would strengthen the recovery; acceptance below $4,170 would weaken it.
Our planning weights are 45% base case, 30% bullish, and 25% bearish. These are editorial judgments for organizing risk, not statistically calibrated forecasts or a promise of returns. The trigger matters more than the percentage.
Want help following the week without mistaking a headline spike for confirmation? Message @GTMOBest for free access and setup support. Use the forecast as educational context, not an instruction to enter a trade.
Where Gold Stands Before Monday#
As of our October 10 preparation, Trading Economics lists gold at $4,193.87 per troy ounce for October 9, up 1.47% on its daily reference. This is an OTC/CFD market reference, not an official gold fixing or a COMEX futures settlement. No exact final spot-close timestamp is established here.
That distinction explains why another report can show a different number without proving a contradiction. FXStreet’s October 9 analysis, published at 10:09:51 GMT, described a European-session push just above $4,200 and a subsequent move back toward $4,183. It was an intraday observation, not the same venue-and-time measurement as the daily reference.
The rates backdrop still deserves respect. FRED’s DGS10 series shows 5.22% for October 8, updated on October 9. That is a lagged nominal Treasury-yield observation, not an October 9 closing yield and not a real-yield measure. Friday commentary from FXStreet described easing yield pressure, but a relief move does not establish a lasting fall in borrowing costs.
The October 9 Trading Economics dollar commentary also described intraday softness while noting broader recent dollar gains. We are not treating that as a confirmed weak-dollar trend. The useful question next week is whether the dollar and yields reinforce gold’s first reaction to inflation, or reverse it.
The Main Drivers That Could Move Gold This Week#
Inflation is the scheduled test, not a predetermined direction. A cooler reading can ease rate expectations and help gold, but the market’s response depends on what was already expected. A hotter print can increase rate pressure; it can also attract inflation-hedging demand. Watch the resulting dollar and yield move rather than assume the headline alone answers the gold question.
Recent commentary has not removed the tightening risk. FXStreet’s October 9 report attributed hawkish remarks to St. Louis Fed President Alberto Musalem even as Treasury yields pulled back. We therefore do not equate Friday’s rebound with a confirmed policy pivot.
Growth and labor can complicate the inflation story. Trading Economics’ October 9 week-ahead preview lists Thursday retail sales and initial jobless claims. Those are additional checks on demand and employment; their outcomes are not yet known. Friday industrial production adds an official scheduled growth checkpoint. Weak activity does not guarantee a gold rally if investors simultaneously seek dollars or sell assets for liquidity.
Energy and unexpected geopolitical news remain risks to every scenario. Treat a sudden headline as a reason to reassess, not evidence that one path was certain all along. No escalation or de-escalation is forecast here.
Key Technical Levels and Decision Zones#
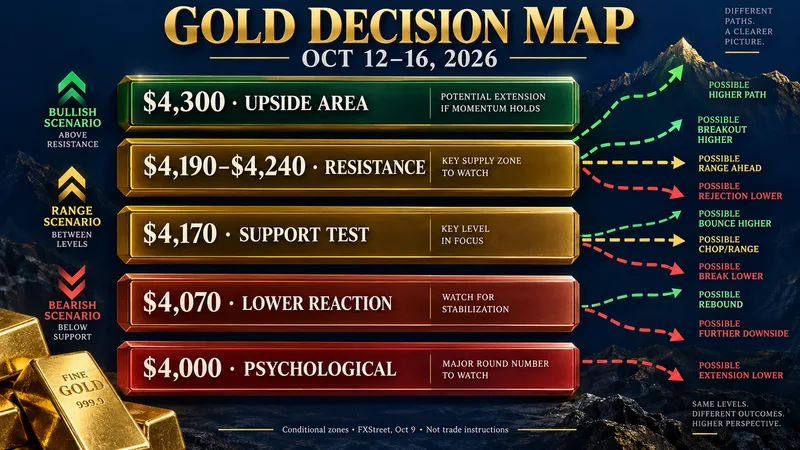
The reaction map below is adapted from FXStreet’s dated October 9 analysis, not from a new GTMO signal or an audited exchange-price history. Its technical section is disclosed by the publisher as AI-assisted. These are monitoring areas, not exact execution prices, and your venue may differ.
| Area, USD per troy ounce | What it would tell us |
|---|---|
| $4,190–$4,240 | First resistance band: the rebound still needs to clear its upper edge |
| $4,300 | Next upside area to monitor if $4,240 is accepted |
| $4,170 | First support and the recovery’s near-term test |
| $4,070 | Next lower reaction area if $4,170 fails |
| $4,000 | Psychological area if selling extends below $4,070 |
For this forecast, confirmation means a four-hour close beyond a boundary followed by a retest that holds. That is our editorial monitoring rule, not a claim that FXStreet uses the same confirmation method. A brief overshoot during a release is insufficient.
Bullish, Base, and Bearish Scenarios#
Base scenario#
45% planning weight: recovery remains a range.
Trigger: $4,170 holds, but buyers cannot sustain a move above $4,240; the inflation response leaves yields and the dollar mixed rather than moving persistently together.
Path: repeated rotation inside $4,170–$4,240, with the $4,190–$4,240 band still limiting progress. Patience at the edges matters more than chasing the middle.
Invalidation: a confirmed break and successful retest above $4,240, or a confirmed breakdown and failed reclaim of $4,170. Either would require a different weekly bias.
Bullish scenario#
30% planning weight: the rebound survives inflation.
Trigger: CPI/PPI are followed by easing Treasury-yield pressure and a dollar that fails to regain momentum, alongside a four-hour close above $4,240 and a retest that holds.
Path: monitor a move toward $4,300. That is a conditional reaction area, not a guaranteed destination or a recommendation to buy.
Invalidation: failure of the breakout retest. A return below $4,190 weakens the move; acceptance below $4,170 invalidates the recovery setup.
Bearish scenario#
25% planning weight: rate pressure defeats the rebound.
Trigger: inflation is followed by sustained yield and dollar strength, and a four-hour close below $4,170 is followed by a failed reclaim.
Path: monitor $4,070 first. Only if that area also fails does the $4,000 psychological area become the next downside checkpoint.
Invalidation: a durable reclaim of $4,170 defeats breakdown confirmation; acceptance above $4,240 overturns the bearish setup.
These weights total 100%, but they are not fixed odds. A Monday gap, an unscheduled shock, or a failed trigger can make the original allocation obsolete before the headline release arrives.
Economic Calendar and Market Risks#
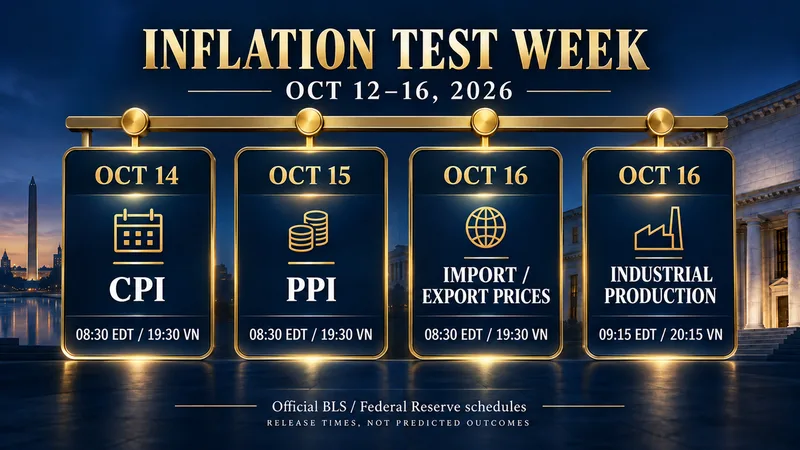
The core times below come from the official BLS 2026 calendar and the Federal Reserve G.17 release schedule. Eastern Time is EDT during this target week; Vietnam is 11 hours ahead.
| Date | Release | US Eastern | Vietnam (+07:00) |
|---|---|---|---|
| Wednesday, October 14 | September CPI; real earnings also released | 08:30 | 19:30 |
| Thursday, October 15 | September PPI | 08:30 | 19:30 |
| Friday, October 16 | September import and export prices | 08:30 | 19:30 |
| Friday, October 16 | Industrial production and capacity utilization | 09:15 | 20:15 |
Monday, October 12 is Columbus Day on the BLS calendar. Do not assume all gold venues are closed; check your broker’s hours and liquidity conditions. Tuesday is a useful pre-CPI checkpoint, not a forecast of a quiet session.
Thursday retail sales and jobless claims remain supplementary watchpoints from the dated Trading Economics calendar. We do not assign an exact retail-sales time here because its displayed rows disagree and the Census schedule was not accessible during preparation. Confirm the current issuer schedule before relying on that timing. No consensus numbers or future actual results are asserted.
What Traders Should Watch Day by Day#
Monday–Tuesday: establish whether the opening market still respects $4,170 and the upper resistance band. If a gap places price beyond either boundary, reassess rather than force the old range onto a new market.
Wednesday: separate the CPI headline from the response. Does gold keep its move after the first spike, and do yields and the dollar support it? A failed retest is more useful information than an impressive first candle.
Thursday: see whether PPI and the demand/labor checks reinforce Wednesday or reverse it. A recovery that keeps needing new headlines to hold support is not yet a durable breakout.
Friday: use import/export prices and industrial production as follow-through tests. Judge the scenario by its trigger and invalidation, not by whether the final price happens to look close to an illustrative target.
How To Think About Positioning This Week#
The practical lesson is to keep a change-of-mind rule beside every directional view. This forecast does not turn prior-week trade labels or community feedback into probabilities. It asks readers to distinguish a reported price, an analyst reaction zone, and a future condition that has not happened yet.
For session-level context, read the October 9 daily report, the October 7 daily report, and the gold scalping strategy guide. They serve different purposes: a daily record explains execution and reported outcomes; a weekly forecast maps what could change next.
Release volatility can widen spreads, cause slippage, and push fills beyond intended stop levels. Reduce exposure when the available risk budget cannot absorb that uncertainty; sitting out a release is a valid choice. An invalidation rule is not a guarantee that an order can exit at the stated price.
FAQ#
What is the main gold catalyst for October 12–16?#
Wednesday’s September CPI is the first core inflation checkpoint, followed by Thursday PPI. The more important decision is whether the resulting dollar, yield, and gold moves persist after the initial reaction.
Does $4,193.87 represent an official Friday gold close?#
No. It is Trading Economics’ October 9 OTC/CFD daily reference, expressed in US dollars per troy ounce. It is not identified here as an official fixing, a broker’s final daily candle, or a futures settlement.
What would change the balanced view?#
A confirmed break above $4,240 and successful retest strengthens the bullish path. A confirmed break below $4,170 and failed reclaim strengthens the bearish path. Neither is an instruction to trade.
Connect with Gold Trader Mo#
Follow Gold Trader Mo for the scenario map and the daily record as the week develops. Contact @GTMOBest for free access and setup support if you want help finding the relevant material. Access does not guarantee performance.
Disclaimer#
This article is educational market commentary, not personalized investment advice or a trade recommendation. Trading involves risk; leveraged products can cause substantial losses, capital can be lost, and past performance does not guarantee future results.