
Weekly Market Overview#
Gold spent September 28 to October 2 proving why survival and adaptation matter more than a fixed bias. Monday opened the story with a violent selloff. Tuesday punished two attempts to stay short. Wednesday offered a cleaner buy recovery, but only after risk was tightened and profits were taken in stages. Thursday returned to selling pressure. Friday then delivered the hardest test of the week: an early sell failed, the loss was acknowledged, direction changed, and the desk worked through a later recovery instead of rewriting the first mistake.
That sequence is the real result of the week. MO did not need five perfect days to look professional. He needed to show the entry logic, protect when the tape changed, admit when a setup failed, and keep the public record readable after the pressure arrived. Readers who want to follow the next dated setup can message @GTMOBest now to ask for free VIP access. No outcome is promised, and every future trade still carries risk.
| Weekly reference | What the record supports |
|---|---|
| Trading window | September 28 to October 2, 2026 |
| Active trading days | 5 |
| Documented trade plans | 12 after consolidating repeated alerts and updates |
| Monday daily close reference | 4,127.38 |
| Friday spot close reference | 4,203.20 |
| Monday-to-Friday close-reference change | +75.82, or about +1.84% |
| Selected weekly proof | 5 trade images and 1 community image |
The close-reference change is market context, not a trading return. It compares Monday's daily close with Friday's spot close. It does not claim that MO captured the entire move, and it does not turn individual screenshots into a combined weekly profit.
What Drove Gold This Week#
The week began under heavy pressure. Gold's September 28 daily row showed a fall from a 4,277.90 open to a 4,127.38 close, with a 4,110.95 low. A firm dollar, elevated Treasury yields, expensive oil and higher volatility all helped explain why the downside accelerated. The public Monday sell was therefore aligned with the broad pressure, but the useful proof is the management sequence: the trade moved through five targets, exposure was reduced, and the remaining risk was reset rather than left open to hope.
Tuesday showed why macro alignment is never enough on its own. The New York session was still active when that day's report was prepared, and available spot feeds disagreed materially. Higher-for-longer rate expectations still argued for pressure on gold, yet easing oil and geopolitical headlines supported a rebound. The first sell failed, a second sell was attempted around a fresh zone, and the day was eventually called a loss. MO's experienced decision was not to force a third story onto a market that had already rejected two.
Wednesday's inflation backdrop briefly helped gold before the dollar and yields took control again. The public buy from 4,199 to 4,195 was not presented as effortless. Protection moved, partial profits were taken, and a public update reported $10,000 secured at breakeven. That is the only dollar result label carried into this weekly recap, and it remains a same-day public message, not independently audited net PnL and not a weekly total.
Thursday retained a bearish-correction tone as the dollar and the US 10-year yield stayed firm. Spot-feed differences are preserved rather than hidden, so this recap does not pretend one universal close existed across every OTC venue. Friday then produced a wide 4,134.05 to 4,227.70 spot range and a close near 4,203.20. The US jobs release helped turn an early liquidation into a short-covering rally, which is why the day demanded a genuine change of plan instead of loyalty to the failed sell.
For the setup map published before the week began, compare this outcome with the September 28 to October 2 weekly gold forecast. The value of that comparison is not whether every path was predicted. It is whether support, resistance and invalidation gave the desk a disciplined way to respond when the actual path changed.
Weekly Performance Snapshot#
The five daily records contained 14 signal-like items before reconciliation. Two repeated adjustments on September 29 belonged to the same evolving ideas, so the reader-facing count is 12 documented trade plans: one on Monday, two on Tuesday, one on Wednesday, three on Thursday and five on Friday.
The count says how many plans were documented. It does not say that all 12 won. Tuesday was explicitly a losing day. Friday began with a failed sell and a loss before the desk changed direction. Wednesday carried the strongest public result label, the $10,000 secured-at-breakeven message, but even that is kept separate from audited account performance. No combined weekly profit is claimed.
That restraint is part of the conversion story. A trader deciding whether to follow MO should be able to see both sides of the week:
- Monday showed one clean sell progressing through five targets with protection tightened.
- Tuesday showed two sell attempts failing and the desk choosing to stop.
- Wednesday showed one buy sequence managed through staged profit-taking and a breakeven reset.
- Thursday documented three sell plans, but no daily article is live, so this recap attaches no public result label to the day.
- Friday showed five transitions across a failed sell, an admitted loss, a direction change and a later recovery sequence.
This is not the neatest possible scorecard. It is a more useful record of professional behavior under pressure.
Best Trades and Recovery Moments#
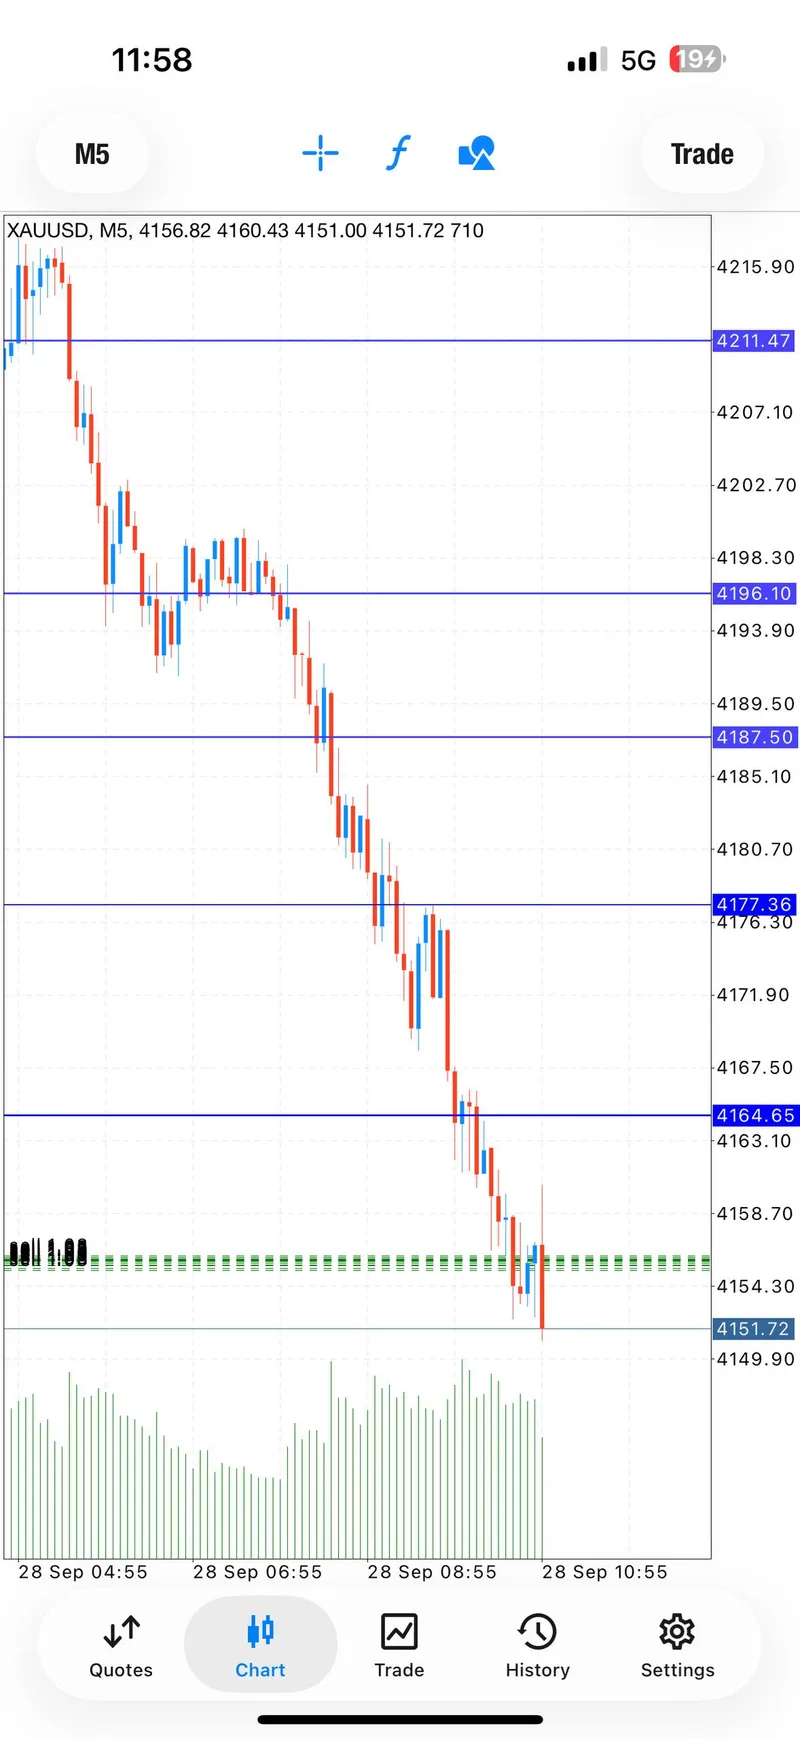
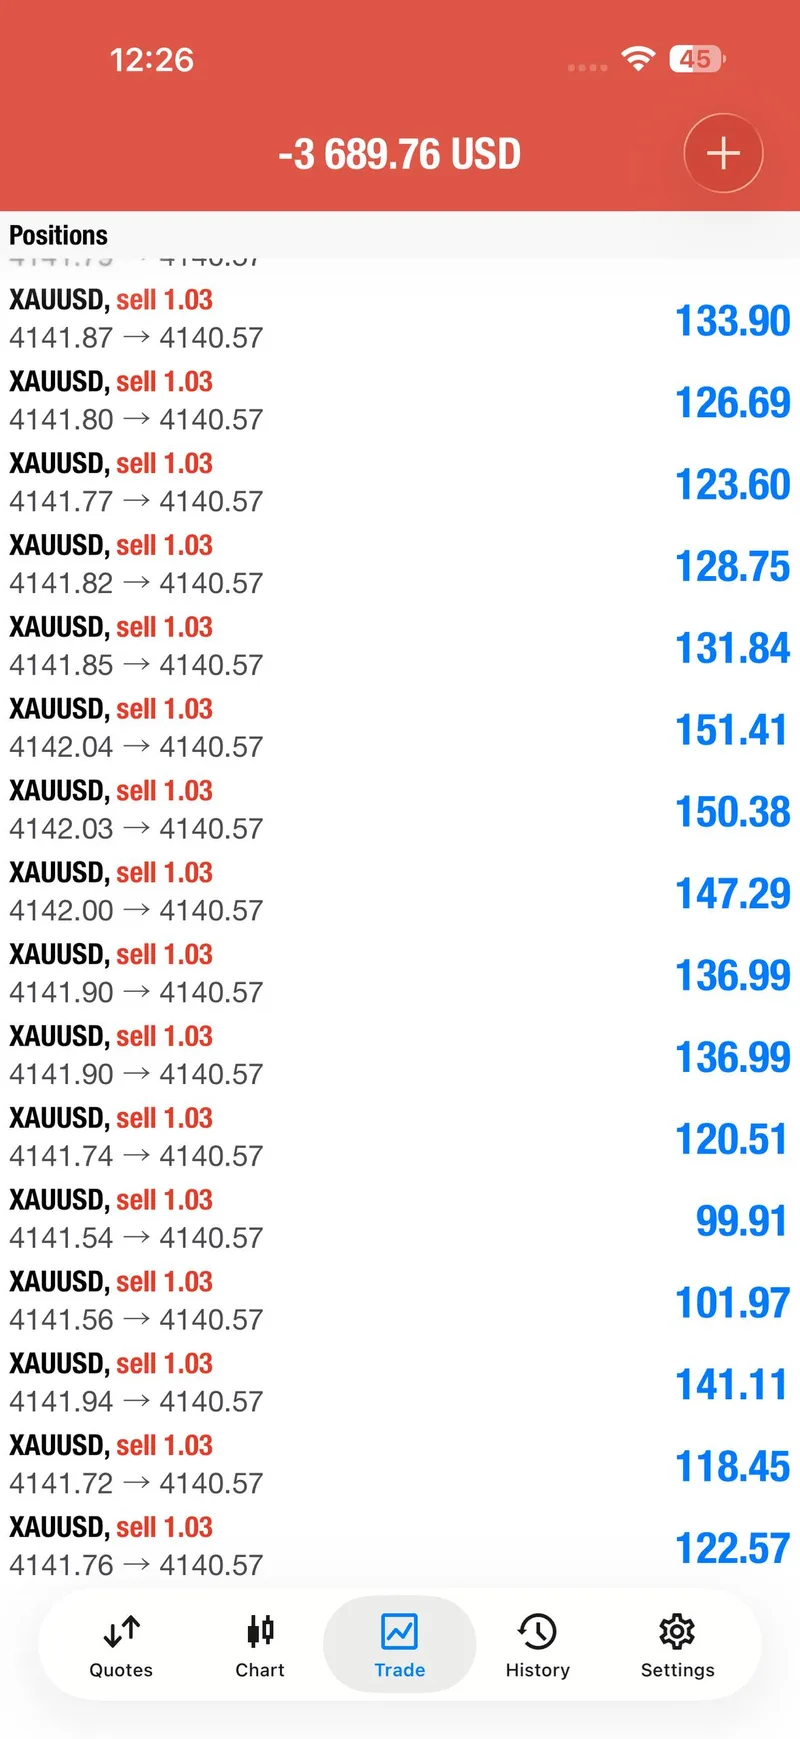
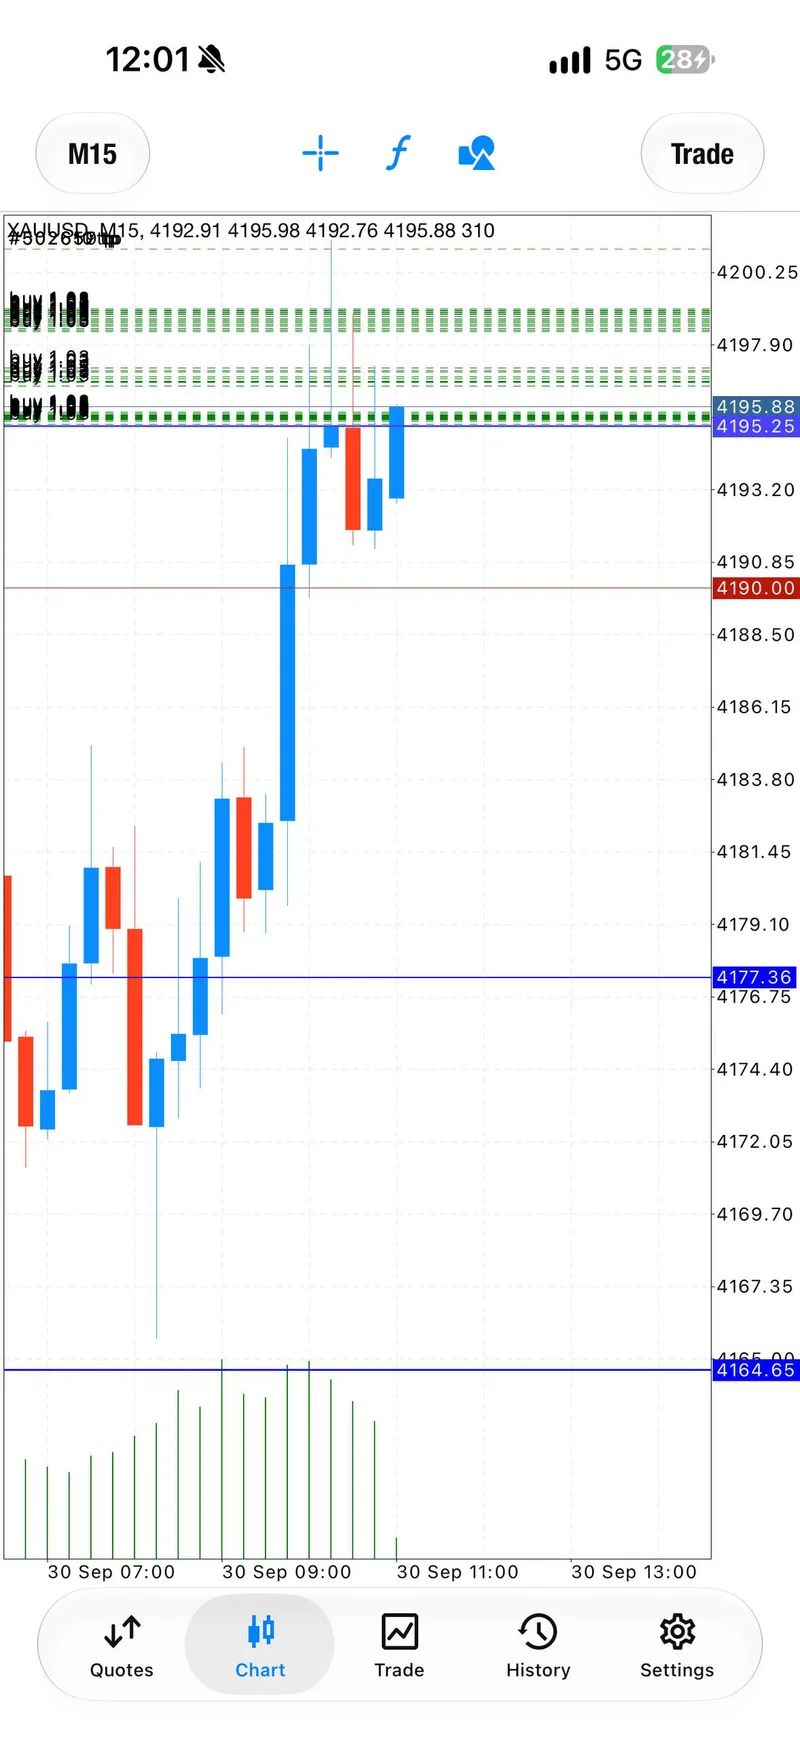
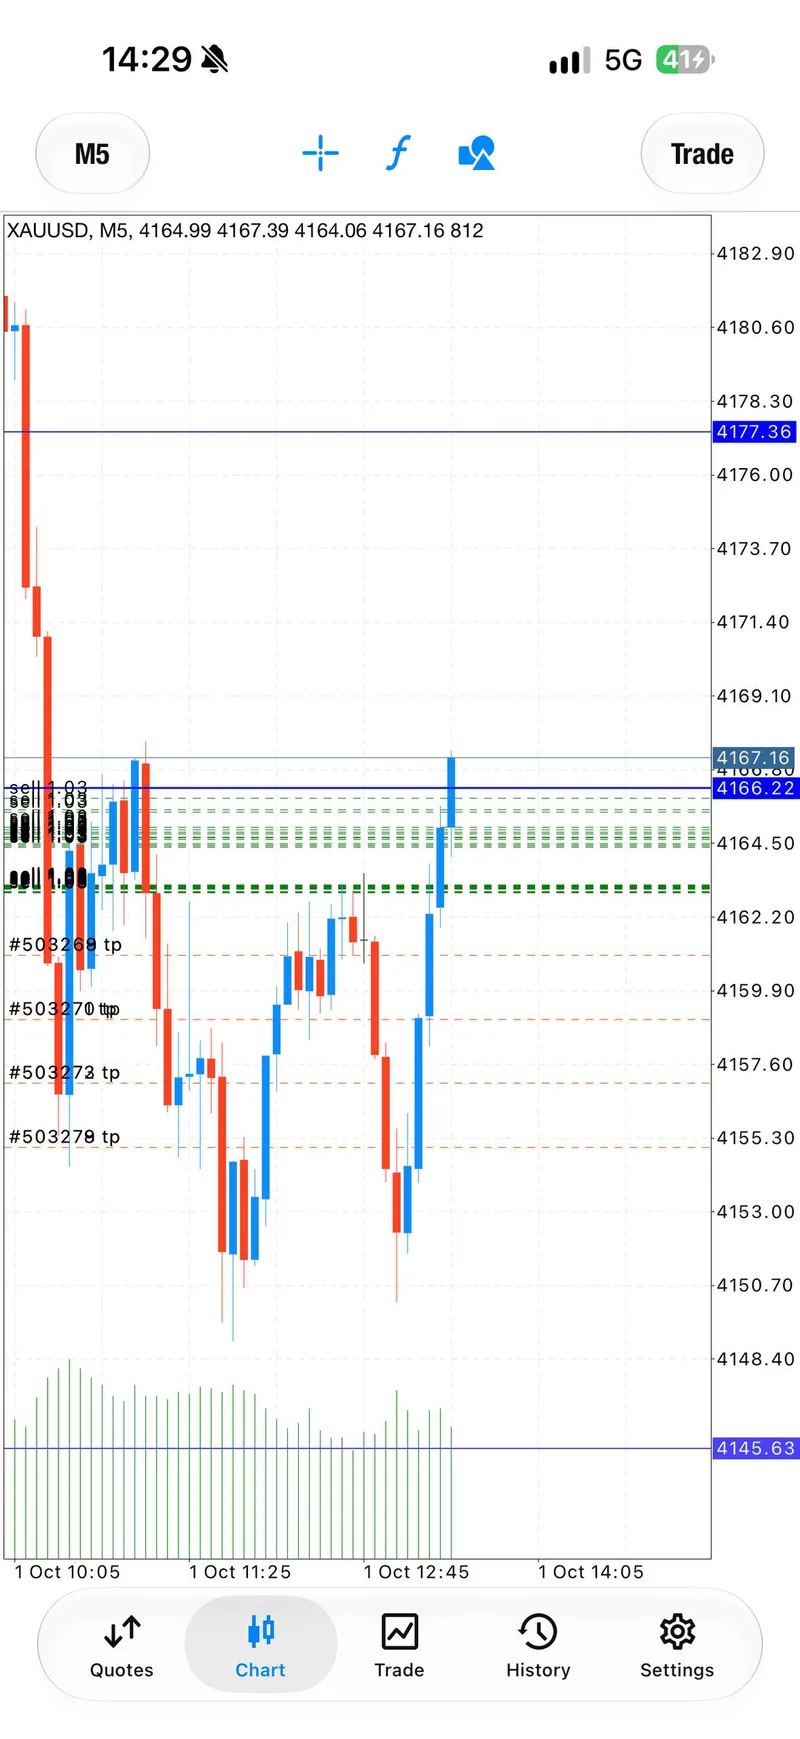
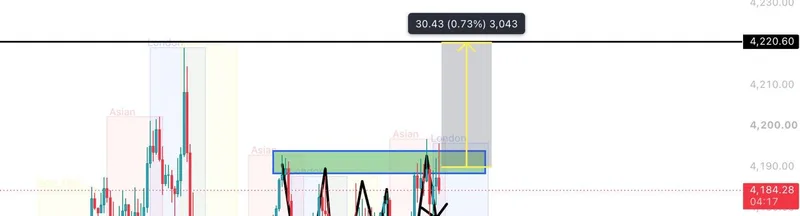
Monday provided the week's cleanest directional execution. The September 28 daily report records one sell zone, a defined stop and five target levels. The public sequence then showed the zone filled, early targets reached, a partial close, a breakeven reset and continued follow-through. The lesson is not to reuse those old levels. It is to see how a plan becomes safer as the market proves it.
Wednesday provided the clearest risk-reset example. The September 30 gold report records a buy from 4,199 to 4,195, protection changes and staged profit-taking. When the public message reported $10,000 secured at breakeven, the important phrase was not only the amount. The important part was that open risk had been reduced while the market was still resisting the next push.
Friday provided the strongest trust moment. The October 2 transparent recovery report does not hide that the first idea failed. MO said he was taking the loss, acknowledged that volume and emotion had affected the decision, changed direction, and then managed the later buy sequence step by step. Recovery never erased the earlier loss. It showed what happened after responsibility replaced ego.
Day-by-Day Trading Narrative#
Monday: One sell, five targets#
The week opened with a 4,156 to 4,160 sell zone and a 4,163 stop. Price moved through the target ladder while the desk reduced exposure and protected the remainder. One documented plan was enough because the market delivered continuation. The public proof screenshots show the chart path; they do not promise the same path will repeat.
Tuesday: Discipline meant stopping#
The September 29 discipline report records two distinct sell sequences. The first setup failed. A second sell was attempted around a new zone, but that recovery attempt also failed. The desk called the day a loss rather than turning momentary account-state screenshots into a winning headline. In a volatile week, refusing to chase a third trade was a professional decision.
Wednesday: Reset risk before celebrating#
Wednesday's single buy sequence worked better, but the market still required protection. Stops were adjusted, some profit was taken, and the position moved toward breakeven. The public $10,000 message belongs to this day only. It is not added to another screenshot, not multiplied across accounts, and not used to imply a guaranteed result.
Thursday: Three sells, no invented outcome#
Thursday's evidence contains three documented sell plans and one selected chart image. There is no published daily article for readers to inspect, so the weekly recap does not link to a missing page and does not attach a dollar label to the session. The day remains part of the 12-plan count because it was an active trading session, but its claim boundary stays tighter than the four published days.
Friday: Admit the loss, then rebuild#
Friday's five-plan sequence was the most complex. The first sell direction failed. The record then moved through another sell, an explicit loss note, a buy direction change, a structured buy zone and later management. The market's jobs-driven reversal forced the desk to separate the failed thesis from the next valid setup. That is what recovery looks like when it is documented honestly.
What Worked, What Failed, and Why#
What worked was reducing risk when price earned protection. Monday's sell improved as targets printed, so the desk could take exposure off and protect the remainder. Wednesday's buy improved only after the protection line moved and profit was taken in stages. Friday improved only after the early sell was abandoned and the recovery was treated as a new sequence.
What failed was treating a plausible macro view as permission to stay stubborn. Tuesday's rate-and-dollar backdrop supported the sell idea, but price did not. Friday's first sell had a defined zone and stop, but the market reversed after the jobs release. In both cases, the chart overruled the narrative.
The deeper lesson is that recovery quality depends on separation. A new setup cannot be used to pretend the old loss never happened. A screenshot cannot be used as a net ledger. A public result label from one day cannot become a weekly total. MO's experience was most visible when those boundaries stayed intact, especially when the week became uncomfortable.
Community Proof and Trader Confidence#
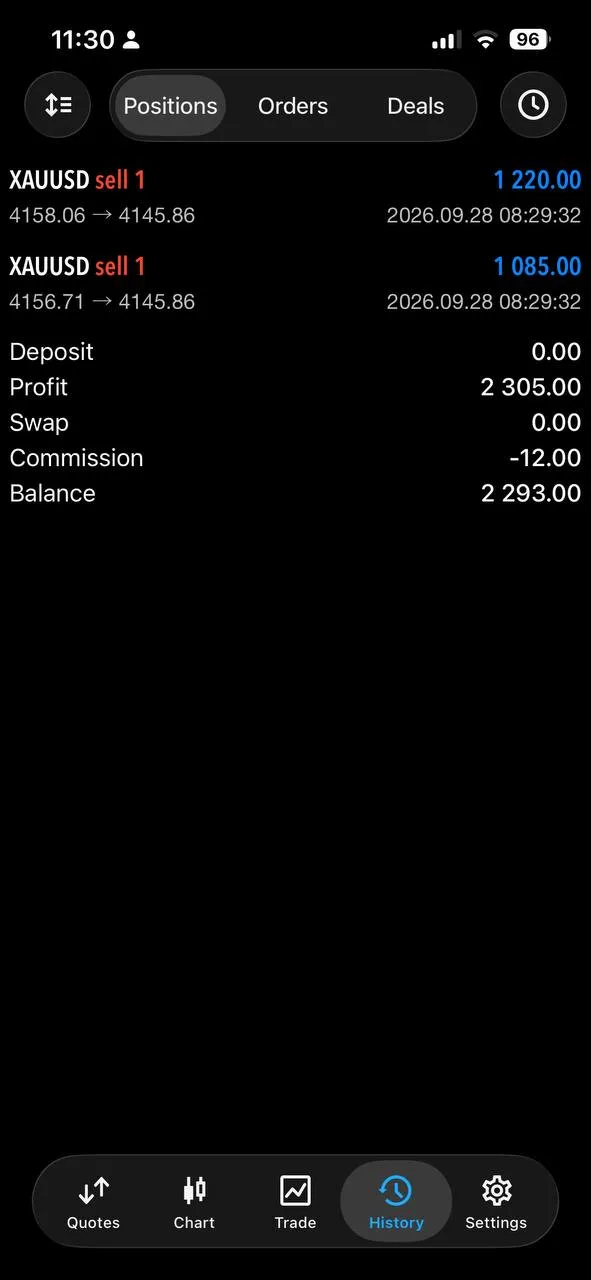
The selected weekly package contains five trade-proof images, one from each active day, plus one community-proof image from Monday. The trade images show chart structure and execution checkpoints. The community image shows a member reaction around the first trade of the week. None of the six images is an audited statement of strategy-wide performance.
That distinction protects trust. Traders can inspect the direction changes, the risk resets and the public tone without being asked to believe an inflated total. The strongest reason to contact MO is not a promise of what the next trade will make. It is the chance to follow a desk that keeps the difficult parts visible and explains why the plan changed.
Key Levels and Scenarios for Next Week#
Friday left the clearest closing map. The first support area is 4,134.05, the session low, followed by a deeper structural reference near 4,110.87. On the upside, 4,227.70 is the Friday spot high. The separate 4,212.40 reference belongs to December futures, not spot, so it should not be treated as a spot settlement.
If support holds above the 4,134 to 4,111 area and buyers continue to defend pullbacks, the late-week recovery can remain intact. The desk can then wait for clean acceptance through the Friday high instead of chasing the first bounce. If support fails quickly, the recovery thesis is invalidated and the week can return to the pressure seen on Monday. In that case, capital protection and smaller exposure matter more than trying to predict the exact low.
Resistance also needs confirmation. A push above 4,227.70 without sustained acceptance can become another whipsaw. A hold above it would improve the continuation case, but it would still require a newly dated setup with its own risk. Use the weekly gold forecast archive for scenario planning, then wait for the public @GTMO record rather than recycling levels from this completed week.
FAQ#
Did MO claim a weekly profit total?#
No. This recap does not add daily labels, screenshots or account-state figures into a weekly profit number. The $10,000 secured-at-breakeven message belongs only to September 30 and is described as a public message, not audited net PnL.
Why are there 12 plans when the source count was 14?#
The initial material contained 14 signal-like items. Repeated alerts and risk updates on September 29 described two evolving trade ideas, not four separate completed plans. The reconciled weekly count is therefore 12.
Was every trading day profitable?#
No. Tuesday was described as a losing day. Friday opened with a failed sell and an admitted loss before the later recovery. Thursday has no published daily article, so no result label is claimed for it.
What proof can readers inspect?#
The article carries a selected weekly gallery of five trade images and one community image. Four published daily reports are linked above. Each screenshot is historical evidence from the week, not a promise of future results.
How can readers ask about free VIP access?#
Message @GTMOBest. Support can explain how to follow the free signal lane and ask about free VIP access. Trading remains risky, and no access tier can guarantee profit.
Connect with Gold Trader Mo#
Pressure exposed the weak ideas. Risk resets protected the ideas that still had a chance. Transparent recovery showed what the desk did after a mistake. That is the weekly story worth carrying forward.
Review more Gold Trader Mo weekly summaries, compare the linked daily records, and message @GTMOBest for free signals and to ask about free VIP access.
This weekly summary is historical education and commentary, not financial advice. Trading involves risk, capital can be lost, and past performance never guarantees a future result.