Market Snapshot#
September 2, 2026 was a recovery-and-repricing session, but the recovery did not begin with a clean win. The public @GTMO channel record starts with two bearish SELL attempts that met invalidation, then turns sharply bullish late in the session. By the 21:00 GMT+7 evidence cutoff, the later BUY sequence had printed TP1 through TP4 and moved protection to breakeven. That sequence is the headline: adaptation mattered more than a perfect first call.
At the intraday check used for this report, Investing.com UK showed XAU/USD spot at 4,385.87, up 57.51 or 1.33%, with a displayed day range of 4,282.67 to 4,386.44 and an open of 4,328.36. The page displayed a quote time of 15:05:13, so this is a live intraday observation, not a final daily settlement. A dated Yahoo Finance report published on September 2 listed December gold futures opening at 4,377.20 and later showing 4,357.50 at 6:31 a.m. ET. Spot and futures are not interchangeable, and no official New York close is claimed here.
For readers, that distinction matters because a GMT+7 calendar day spans multiple OTC trading sessions. This report combines a bounded market snapshot with the public execution sequence instead of forcing a single closing number into a still-moving market. For free updates and a route into the VIP conversation, message @GTMOBest.
Why The Tone Changed So Fast#
A dated Yahoo Finance market report connected the volatile backdrop with renewed U.S.-Iran attacks and retaliation, higher oil prices, and increased expectations of a Fed rate increase. Those are reported context, not a claim that one headline mechanically caused every candle. The day's behavior was consistent with a market repricing risk quickly: early bearish continuation stalled, the second sell was cut as bullish pressure strengthened, and the channel then shifted to watching bullish momentum and retracement opportunities.
The public record also shows why the tone changed inside GTMO itself. The first sell was managed through drawdown language and then marked as a failed trade when the stop was hit. After the second sell was cut, the message said the strategy had not worked and that trading could be skipped to protect capital. Later, once momentum was described as strongly bullish, the desk waited for a retracement and moved to a buy plan. That is not a contradiction to hide; it is the session's actual change of state.
This gives the recap a more useful angle than a generic bullish or bearish label. A directional bias can be valid for part of a session and still require a hard stop when structure stops confirming it. The key change was not a slogan. It was moving from pressing a bearish read to protecting capital, then defining risk before taking the next directional opportunity.
Technical Outlook#
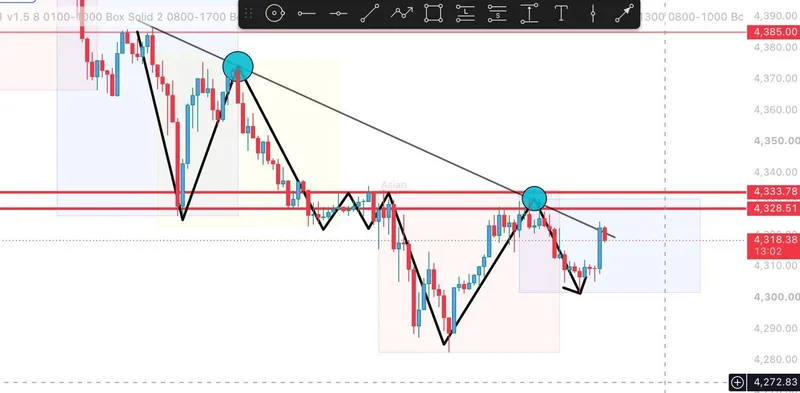
The clearest public technical reference is the observed intraday boundary: 4,282.67 low and 4,386.44 high on spot at the market-data check. These are session boundaries, not forecast levels. A chart shared earlier in the session showed a descending trendline and levels around 4,333 and 4,328; later, the channel noted that gold had failed to break a lower low and chose to wait. The failure of that lower-low continuation was the technical reason to demote the bearish script.
The historical execution map was more specific than a broad support-and-resistance label:
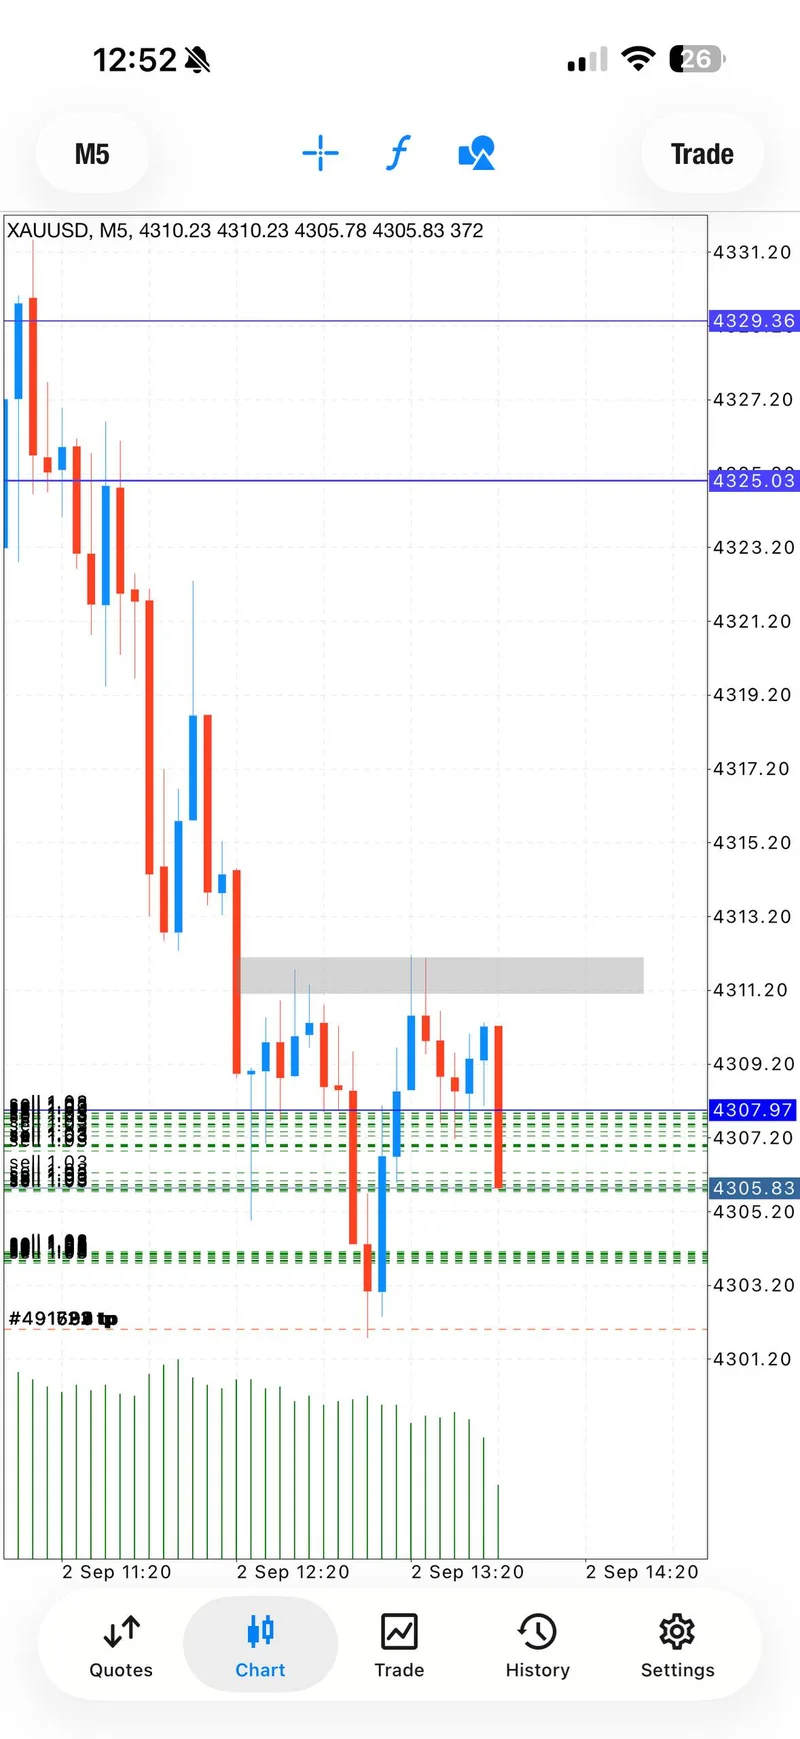
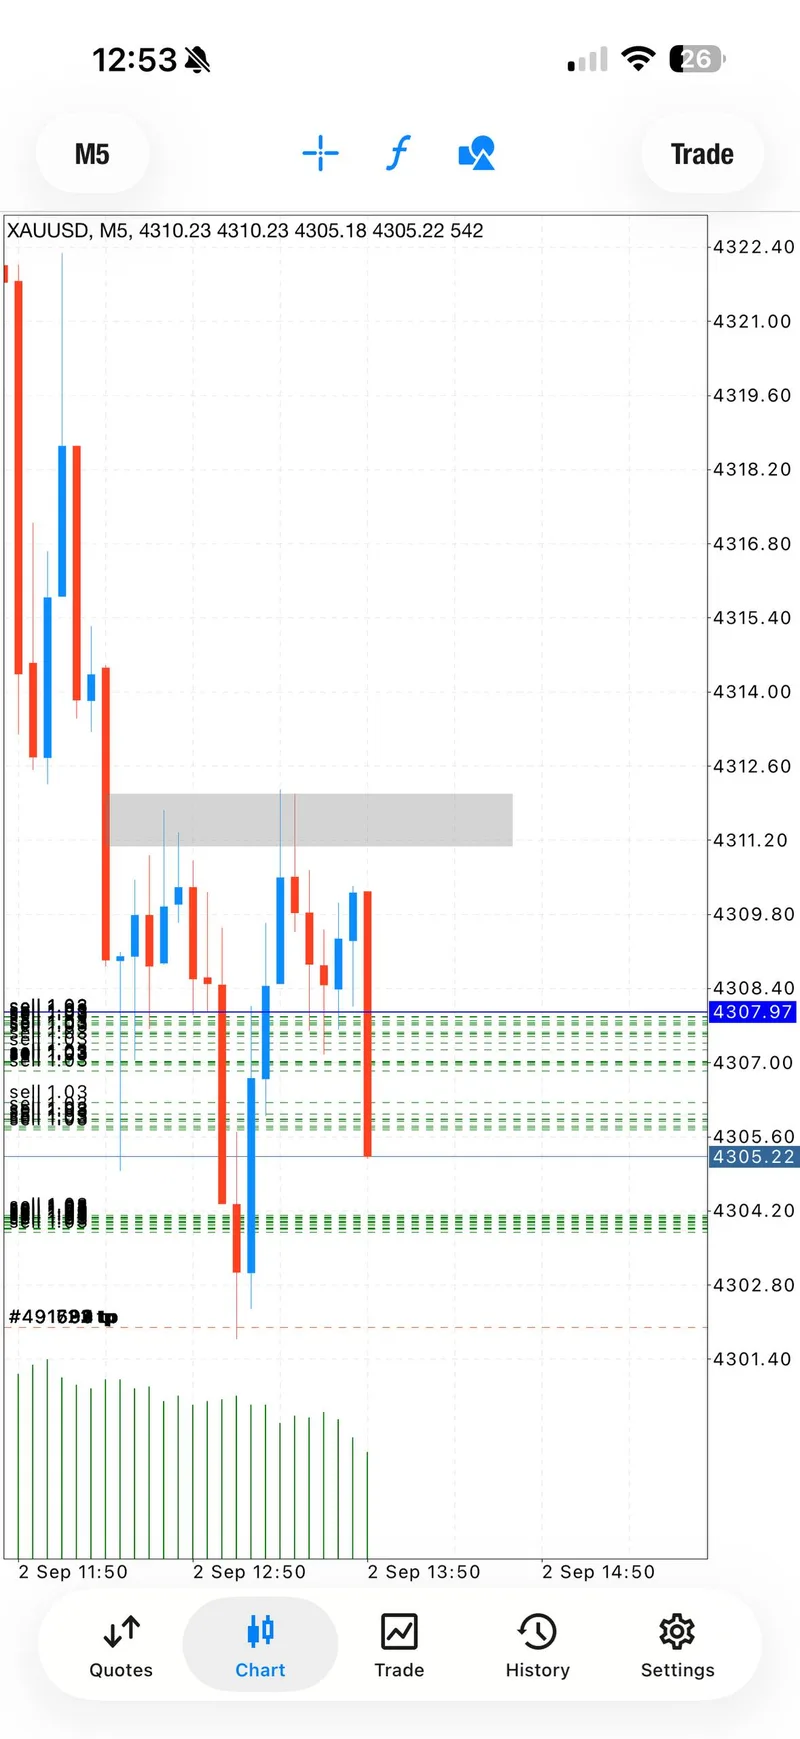
- First SELL zone: 4,304–4,308, with an initial stop at 4,312, later adjusted to 4,314. Planned targets were 4,302, 4,300, 4,298, 4,296, and open.
- Second SELL zone: 4,325.2–4,329, with protection moved from 4,333 to 4,335 and then 4,336.5 before the loss was cut.
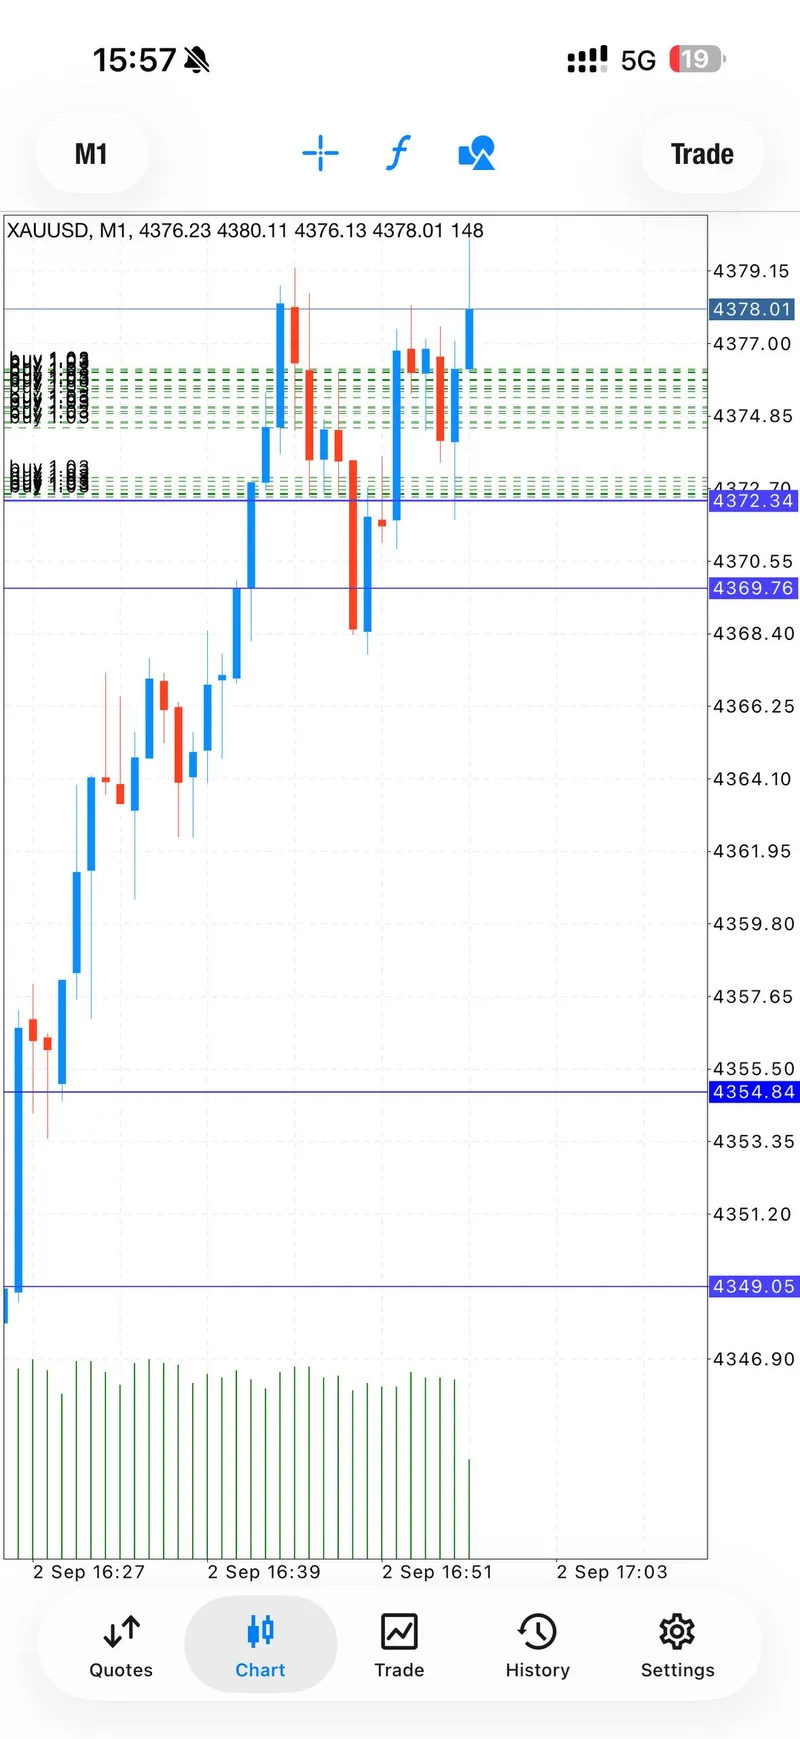
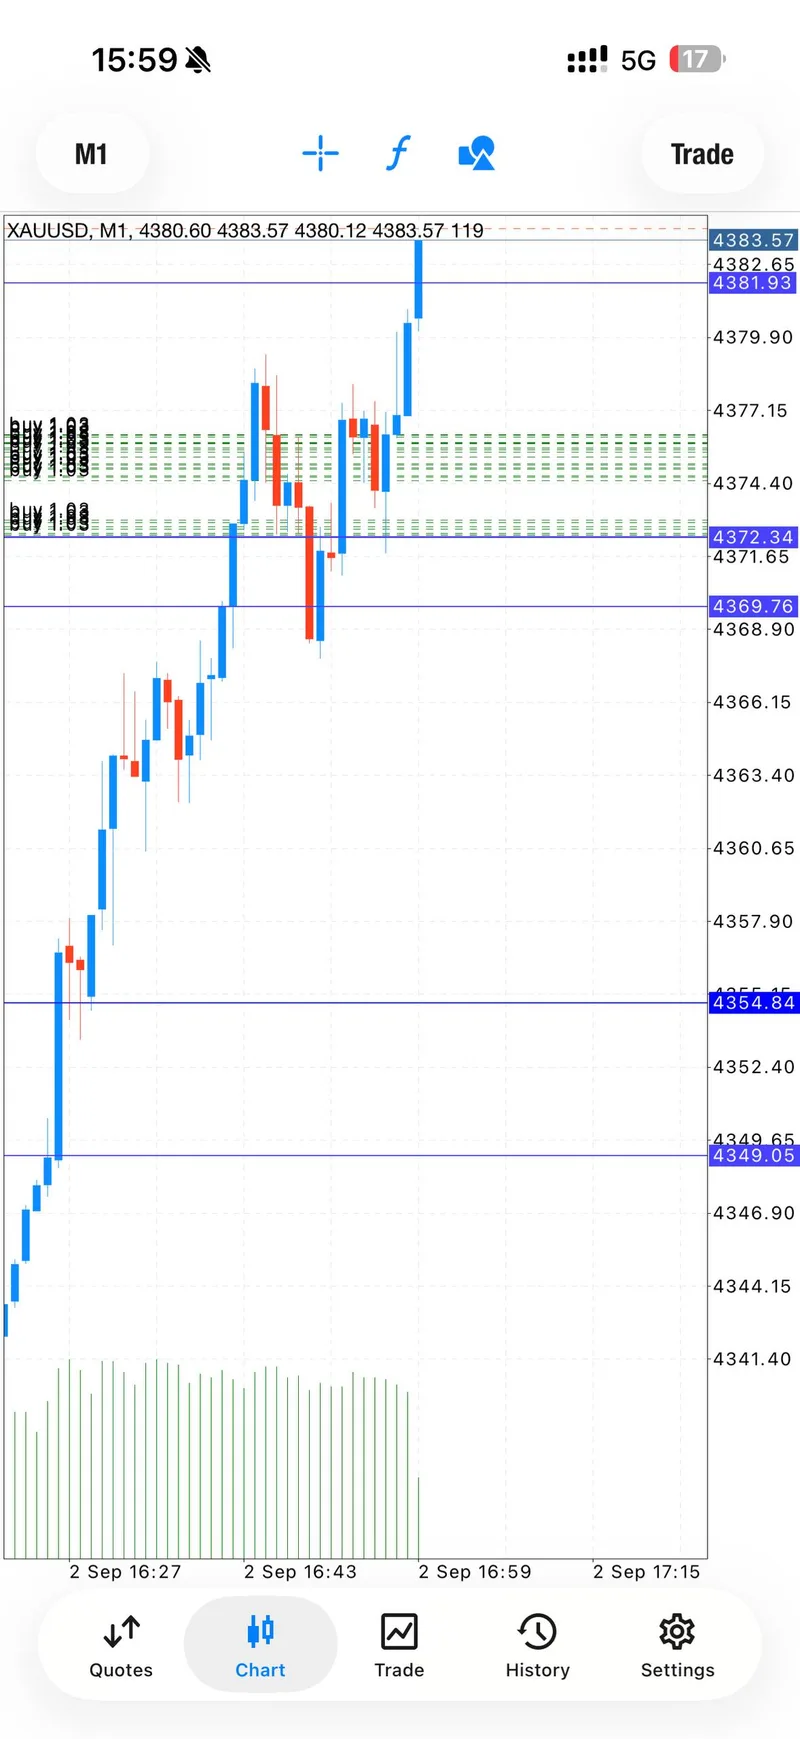
- BUY zone: 4,375.8–4,372, with a stop at 4,366 and staged targets at 4,378, 4,380, 4,382, 4,384, 4,386, and open.
Those are historical levels reported in the public record, not current calls. A trader evaluating future XAUUSD should interpret stop and target distances through their own broker's quote format and execution conditions; these values should not be converted into universal pip promises. A range boundary is useful context, but confirmation, invalidation, and position sizing still decide whether a level is tradable.
Trading Signals#
The session contained three parameterized setups. Mirrored Free and VIP copies, bare directional lead-ins, target checks, and protection updates are follow-up evidence rather than extra trades.
Setup 1: SELL 4,304–4,308#
The first public setup used the 4,304–4,308 sell zone with a 4,312 stop and downside targets at 4,302, 4,300, 4,298, and 4,296, followed by an open target. The stop was later adjusted to 4,314 as price moved against the idea. By 18:11 GMT+7, the channel record stated that the stop had been hit and the trade had failed.
The important evidence is not an implied recovery from this setup. It is that the invalidation was eventually acknowledged. The chart and the drawdown screenshot in the proof gallery show the difficult part of the sequence without turning an account-specific image into a universal result.
Setup 2: SELL 4,325.2–4,329#
The second sell was shared after the rebound, with a 4,333 stop and downside targets at 4,323, 4,321, 4,319, 4,317, and 4,315, followed by open. Protection was adjusted to 4,335 and finally to 4,336.5 as the U.S. session volume increased. At 19:05 GMT+7, the public update cut the loss and described the bulls as too strong.
This setup is why the day should not be summarized as a clean bearish trend. The execution record shows a thesis that stopped working, followed by a direct decision to stop pressing it. No target completion is claimed for this sell.
Setup 3: BUY 4,375.8–4,372#
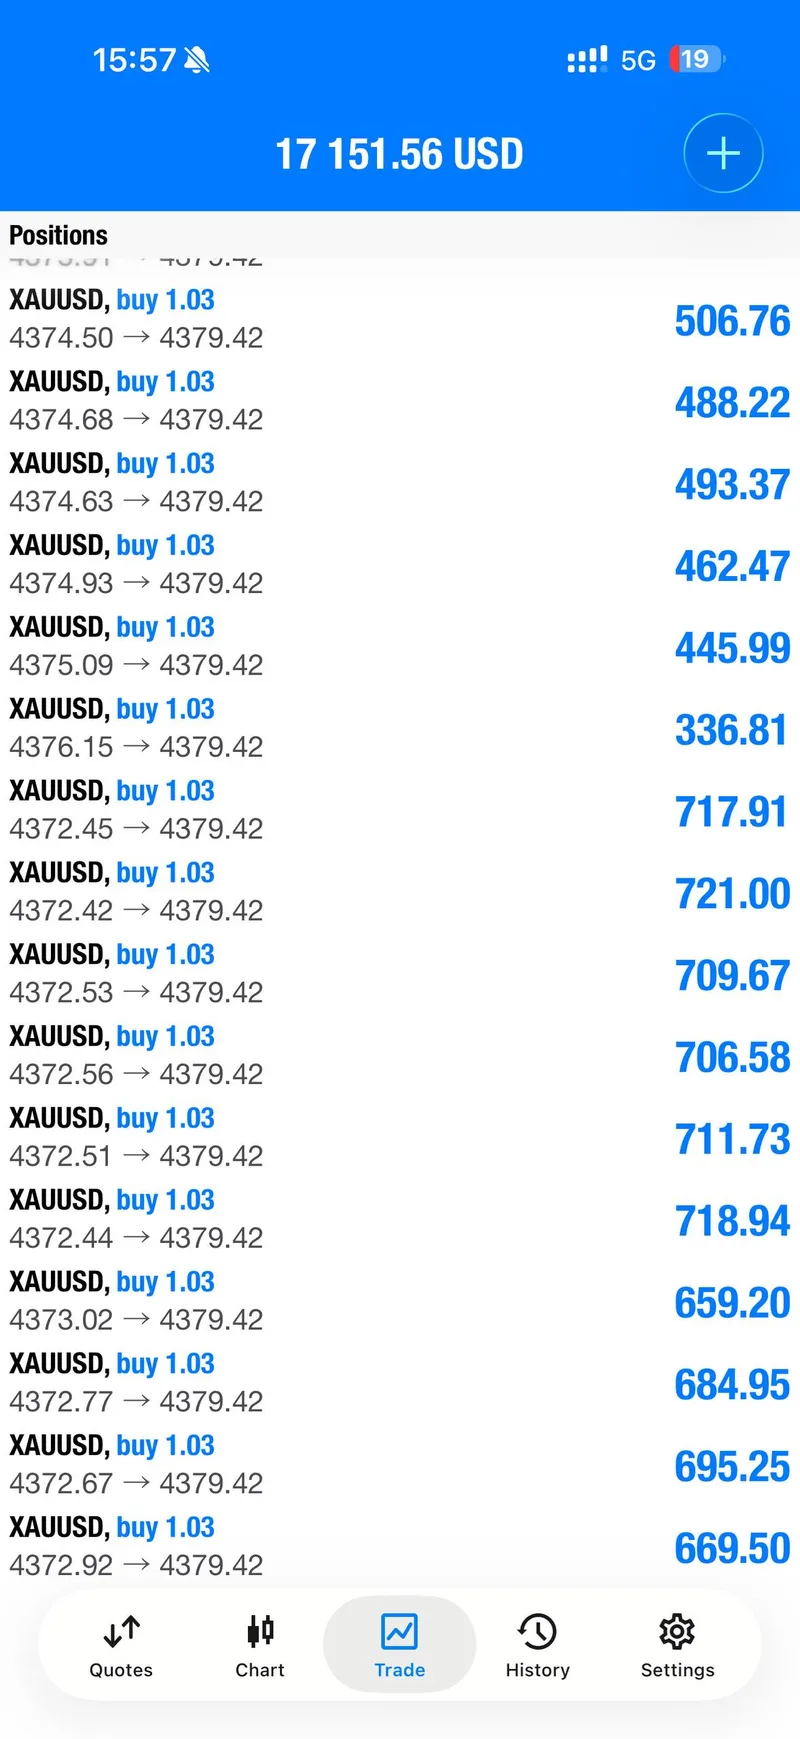
The later buy was the session's repricing leg. The public plan gave the 4,375.8–4,372 zone, a 4,366 stop, and targets at 4,378, 4,380, 4,382, 4,384, 4,386, and open. The first and second targets were checked at 20:58 GMT+7. The TP3 update at 20:59 also instructed the channel to set breakeven for zero risk. TP4 was checked moments later, and the next update described TP5 as incoming before the evidence cutoff.
The boundary matters: TP1 through TP4 are directly supported by the public sequence and matching chart screenshots. TP5 was not confirmed as reached by 21:00 GMT+7, so this report does not promote it as completed. By the cutoff, the useful state was staged progress with protection reset to breakeven, not a claim of a finished final outcome.
Signal Performance Breakdown#
The performance breakdown is therefore a sequence, not a scoreboard. Two bearish setups were stopped or cut, while the later buy produced public TP1, TP2, TP3, and TP4 updates before risk was moved to breakeven. The record does not publish a final session PnL, and the account screenshots are individual examples rather than proof that every reader received the same return.
For this report, the count is deliberately narrow: 3 parameterized setups. The collection also contained mirrored Free and VIP copies plus commentary-only messages, so counting every status line as a new trade would overstate the session.
The full collection contained 0 member-feedback messages. That means the article makes no member-profit, testimonial, or community-outcome claim. The six-image gallery is limited to public trading charts and account-specific screenshots that illuminate the sequence: the early sell, the pause after the failed lower-low break, and the later buy's target progression. The red and blue account views are shown as individual evidence, not as universal performance claims.
This boundary is consistent with the September 1 daily report, the August 31 two-BUY recap, and the August 27 risk-reset report: a useful report separates what the channel said, what the charts show, and what cannot be inferred from either.
Execution Lessons#
The first lesson is that a stop is part of the strategy, not an embarrassing footnote. The first sell had a defined invalidation; when the lower-low continuation failed, the public record eventually called the trade failed. The second sell followed the same bearish premise but was cut after protection was extended and bullish strength became clearer. Extending a stop is not automatically wrong, but it raises the burden of proof for the next decision. A risk plan should say what evidence would justify staying in and what evidence means the idea is over.
The second lesson is to separate bias from identity. The channel began the day looking for sells, then acknowledged that the market was not breaking lower, paused, and later looked for a buy after momentum changed. Changing direction is not a failure of analysis when the change is tied to invalidation and a new setup with a defined stop. Refusing to update is the more expensive habit.
The third lesson is staged exit management. The later buy did not wait for one perfect close. It documented TP1, TP2, TP3, and TP4, then moved protection to breakeven while TP5 remained unconfirmed. That sequence reduces the temptation to treat an open target as guaranteed. It also gives readers a more honest picture of what can be known during a fast move.
Finally, read every account image at the right level. A screenshot can corroborate timing, direction, and the existence of a trade state. It cannot establish a universal return, risk percentage, or repeatable outcome without position size, account context, fees, and execution records. Clear reporting protects the reader from both hype and false precision.
What The Day Means Going Forward#
Going forward, September 2 belongs in the recovery-and-reset category. The day began with a bearish premise, invalidated it twice, then captured a bullish repricing leg with staged targets and breakeven protection. The lasting takeaway is not that a late buy will always recover an early loss. It is that the quality of the next decision depends on whether the previous thesis has actually been released.
The market context reinforces that caution. The direct spot snapshot was still intraday, the futures observation covered a different instrument, and the dated macro report described a volatile geopolitical and rates backdrop. Future readers should watch whether price confirms continuation around the current structure, whether momentum fades into a retracement, and whether risk can be defined before entry. This historical report is a lens on process, not a live signal.
For the next report, the same standard applies: count only parameterized setups, label target updates by what was actually published, separate account-specific evidence from member outcomes, and identify the market-data timestamp before calling anything a close.
FAQ#
Was September 2 a winning session?#
The public record does not support a simple all-day win label. It shows two failed or cut SELL attempts, followed by a BUY sequence that reached TP4 and moved to breakeven by the 21:00 GMT+7 cutoff. The final status after that cutoff is not claimed.
How many trades are counted?#
This report counts 3 parameterized setups: two SELL zones and one BUY zone. Mirrored Free/VIP copies, bare buy or sell lead-ins, target checks, and risk-management updates are supporting evidence, not separate setups.
Was TP5 reached?#
It was described as incoming, but no later confirmation was available within the same-day evidence window. TP5 is therefore not counted as completed.
Why is there no member result or final PnL number?#
The collection contained 0 member-feedback messages, and no verified universal PnL was published. Some account screenshots show individual states, but they do not prove a common return. The report keeps that distinction visible so readers can evaluate the trading sequence without mistaking one account view for a promise.
Where can readers follow Gold Trader Mo?#
Follow the Gold Trader Mo daily archive and message @GTMOBest for free gold updates and information about VIP access.
Connect with Gold Trader Mo#
Readers who want broader context can browse the Gold Trader Mo daily reports, follow the free GTMO Telegram channel, and message @GTMOBest with questions about the free and VIP lanes. The useful promise is clear context: levels, timing, protection, and an honest boundary around what the evidence can prove.
What readers can expect:
- Historical recaps that separate planned levels from confirmed target updates.
- Public chart evidence with captions that explain what each image does and does not show.
- Risk-aware commentary for learning, not a guarantee of future returns.
This report is for education and market commentary only, not financial advice. Trading involves risk, capital can be lost, and past performance never guarantees the next session.