Market Snapshot#
September 8 was a two-direction XAUUSD session rather than a simple one-way win. The public @GTMO record shows a BUY sequence from 4402.3–4398 that moved through four upside targets before protection was tightened, followed later by a SELL sequence from 4405–4409 that reached four downside targets in a fast move. The same record reported $20,000 closed after one one-minute candle moved almost 100 pips. Those are historical channel claims and individual-account results, not an audited performance statement.
If you want to see future setups in context, message @GTMOBest for free signals and FREE VIP channel access. The point of this recap is to show the sequence, the risk decisions, and the evidence that was visible on the day—not to turn an old alert into a live instruction.
| Market measure | September 8 intraday snapshot |
|---|---|
| XAUUSD spot | 4403.12 at 19:05 GMT+7 |
| XAUUSD range captured | 4398.77–4443.06 |
| DXY | 98.95 |
| US 10-year yield | 4.81% |
| WTI crude | 93.71 |
| VIX | 15.46 |
The table is an intraday snapshot while Western markets were still open, so no final XAUUSD, DXY, Treasury, WTI, or VIX settlement is presented here. For a daily gold trading report, a live snapshot helps explain the mood, but it should not be dressed up as a final close. Gold was trading inside a wide, fast range, with 4400 acting as the first nearby support and 4465 as the overhead resistance to reclaim. The second support reference was 4305, far below the day’s action and therefore a broader invalidation zone rather than an immediate target.
The backdrop was mixed. Middle East escalation and a higher oil risk premium supported defensive demand, while higher yields, a firm dollar, and positioning ahead of US PPI on September 10 and CPI on September 11 limited the room for a clean gold breakout. That tension explains why the day rewarded quick protection and selective follow-through more than stubborn conviction.
Why The Tone Changed So Fast#
The tone changed because price moved faster than a normal checklist could. The first BUY was already in motion when the channel posted a target update, then a stop adjustment, then a breakeven instruction. A sharp one-minute candle later pushed the reported account result above $30,000 before the day-level recap settled on $20,000 closed. The later SELL moved even faster: the channel described the drop as straight, reached the second and third targets within minutes, and had the fourth target inbound before five minutes had passed.
That speed creates two very different experiences. A trader who is already positioned can reduce exposure into strength and protect the remaining entries. A trader who arrives after the move may only see a screenshot and assume the result was easy to copy. The public messages themselves show the gap: after the SELL alert, Mo asked whether members had caught it, and one member replied that they had. The recap therefore treats timing as part of the evidence, not as a footnote.
The shift also fits the wider cross-asset tape. Defensive headlines can pull gold higher, but a higher real-rate impulse or a stronger dollar can cap the follow-through. When both forces are active, a single candle can reverse the emotional read even if the larger range has not changed. That is why the September 8 record is more useful as a risk-reset story than as a promise that every alert will travel in a straight line.
For continuity, compare this session with the September 7 daily gold report, where one public SELL reached four target milestones, and the September 4 recovery report, where the lesson was also adaptation after a mixed move. The recurring theme is not a magic direction; it is how the desk reacts when the tape changes character.
Technical Outlook#
The practical map from the September 8 snapshot is straightforward:
- Resistance: 4465. A sustained reclaim would show that buyers can absorb the higher-yield headwind and extend the rebound.
- First support: 4400. Holding this area keeps the session’s rebound structure intact; losing it would put the lower edge of the captured range back in focus.
- Broader support: 4305. This is a wider reference for risk planning, not a claim that price must travel there next.
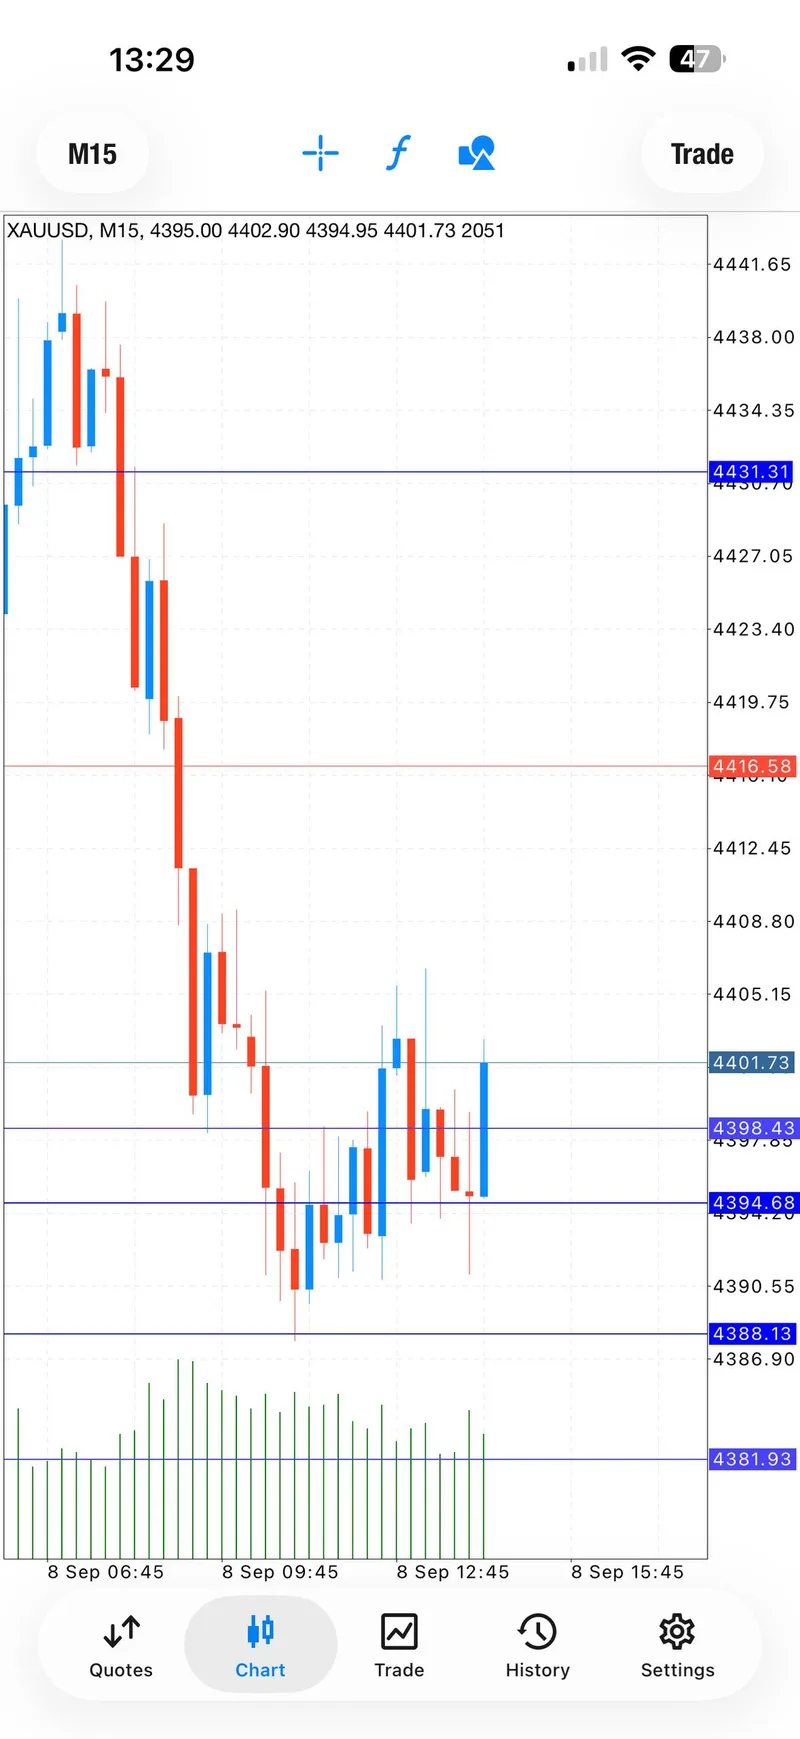
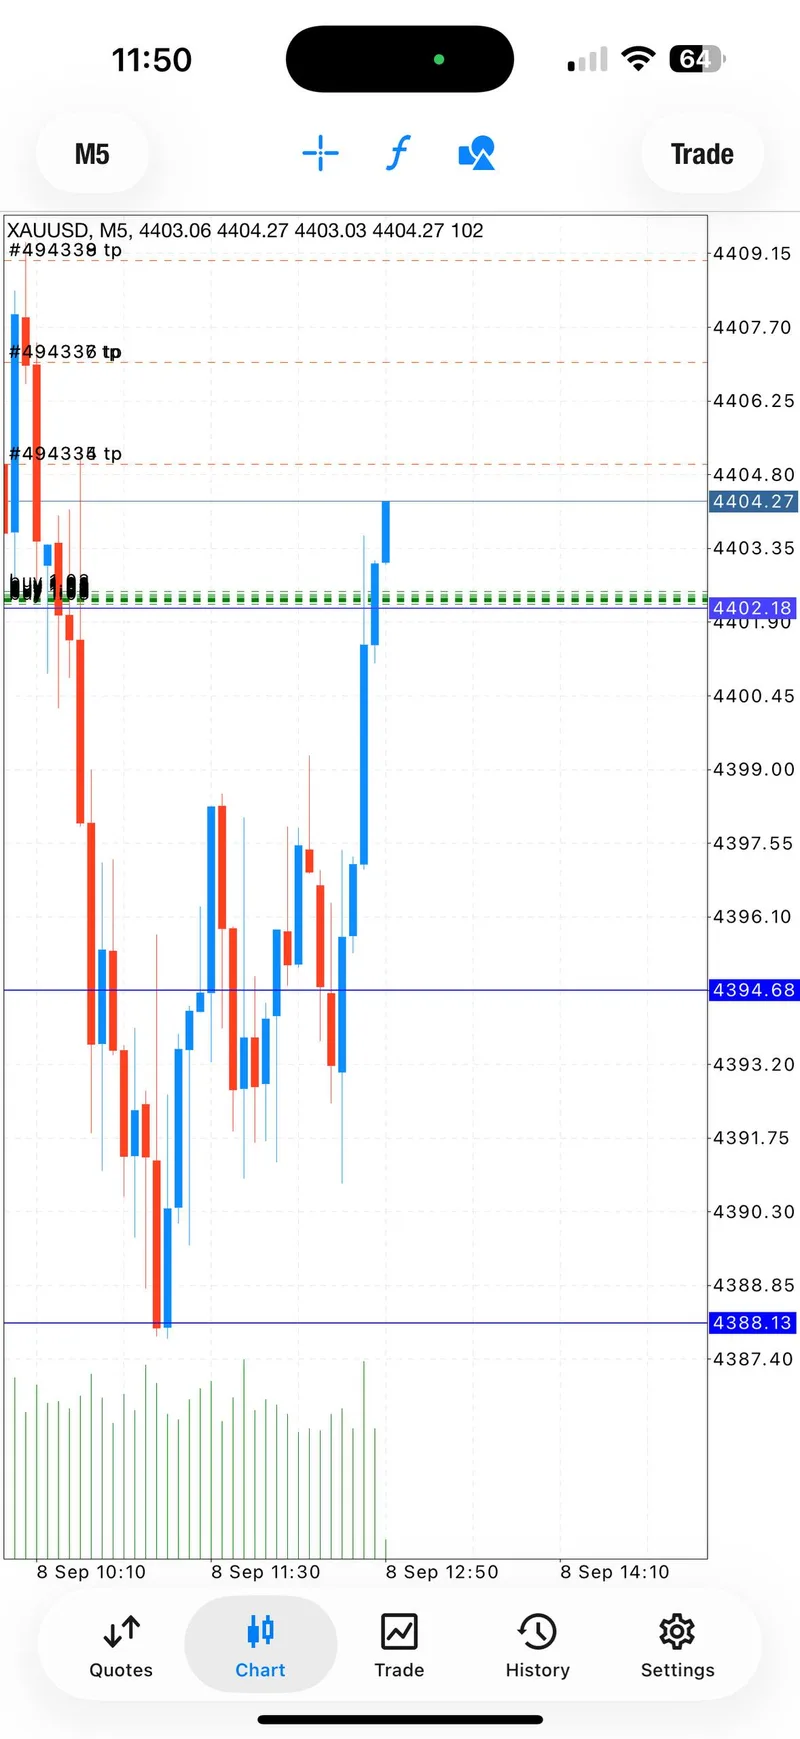
The day’s signal zones sat close to the first support and resistance references. The BUY zone at 4402.3–4398 overlapped the 4400 area, which helps explain why the lower-timeframe structure could turn bullish there. The later SELL zone at 4405–4409 was placed into the rebound rather than chased at the low. In both cases the level was only the starting point; the stop, target ladder, and response to speed decided whether the idea remained tradable.
Readers can use the September 2 report as a counter-example: that recap documented failed SELL attempts before a later BUY reached its fourth target. Together, the reports show why a technical level is a decision area, not a guarantee. If 4400 holds but 4465 rejects again, the market may continue to rotate. If both give way, the next move deserves a fresh plan rather than a recycled alert.
Trading Signals#
Signal 1 — BUY recovery sequence#
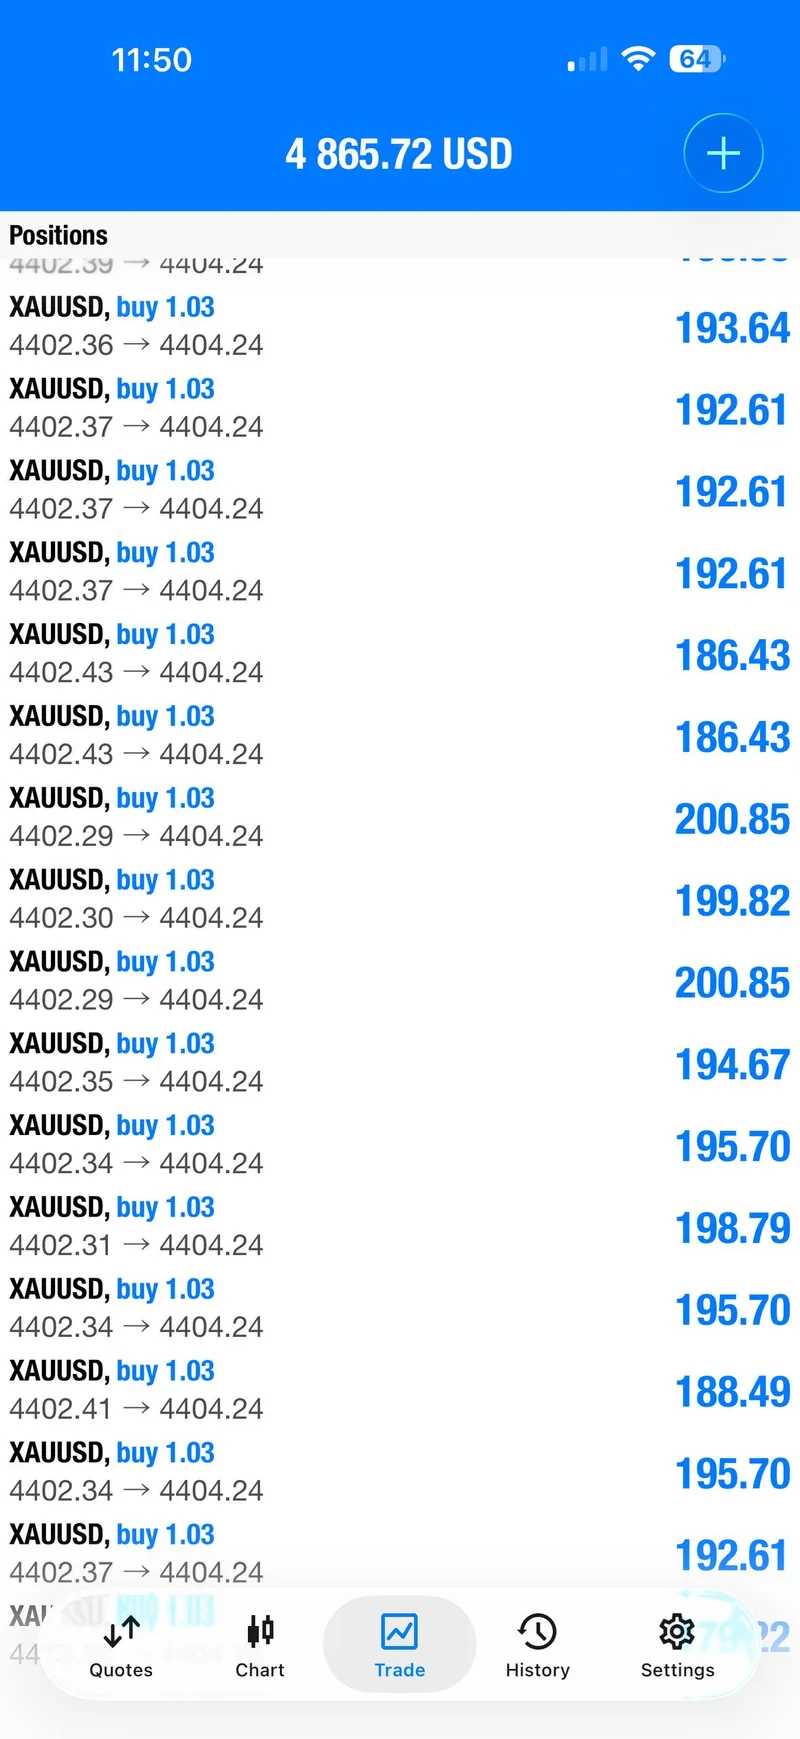
The public channel first posted a BUY around 4402.3–4398, with a 4395 stop and upside targets at 4405, 4407, 4409, and 4411, followed by an open target. The record then showed the first target, a reminder to use proper risk management while price floated in the zone, and a stop move to 4392. When the fast candle arrived, Mo posted that profits had been taken while the account was up more than $30,000, later describing $20,000 as closed profit. A breakeven instruction followed, and the channel eventually noted that entries had returned to breakeven and all positions were out.
This sequence is useful because it includes the uncomfortable middle. The entry was not presented as a perfect low; Mo explicitly said a later entry could have captured more of the move. The evidence shows staged exits and protection updates alongside the result, which is materially different from showing only the winning screenshot.
Signal 2 — SELL continuation sequence#
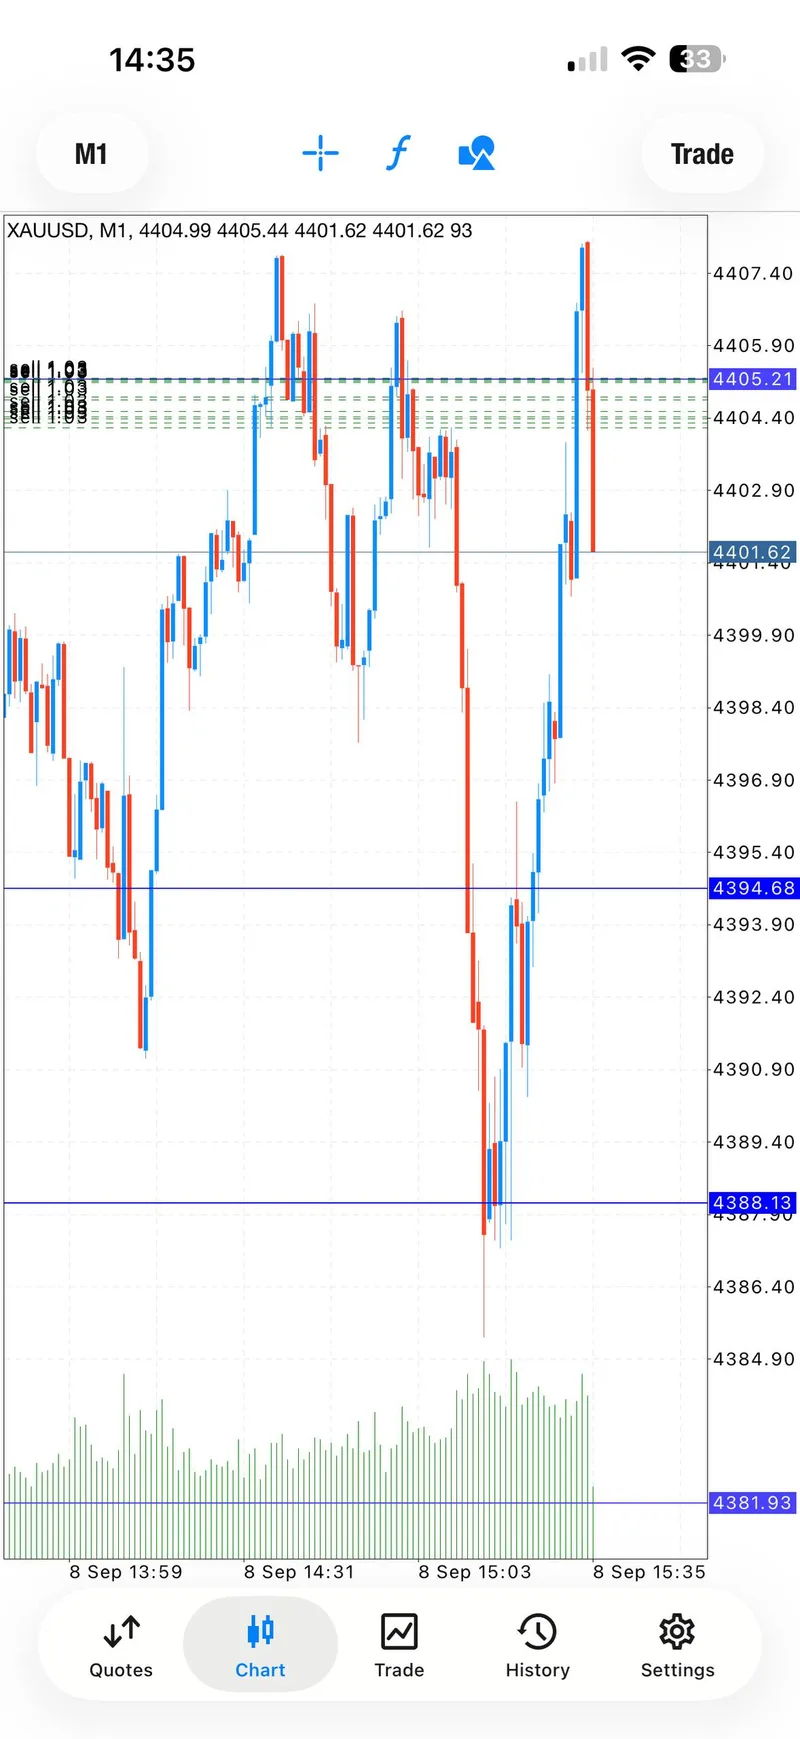
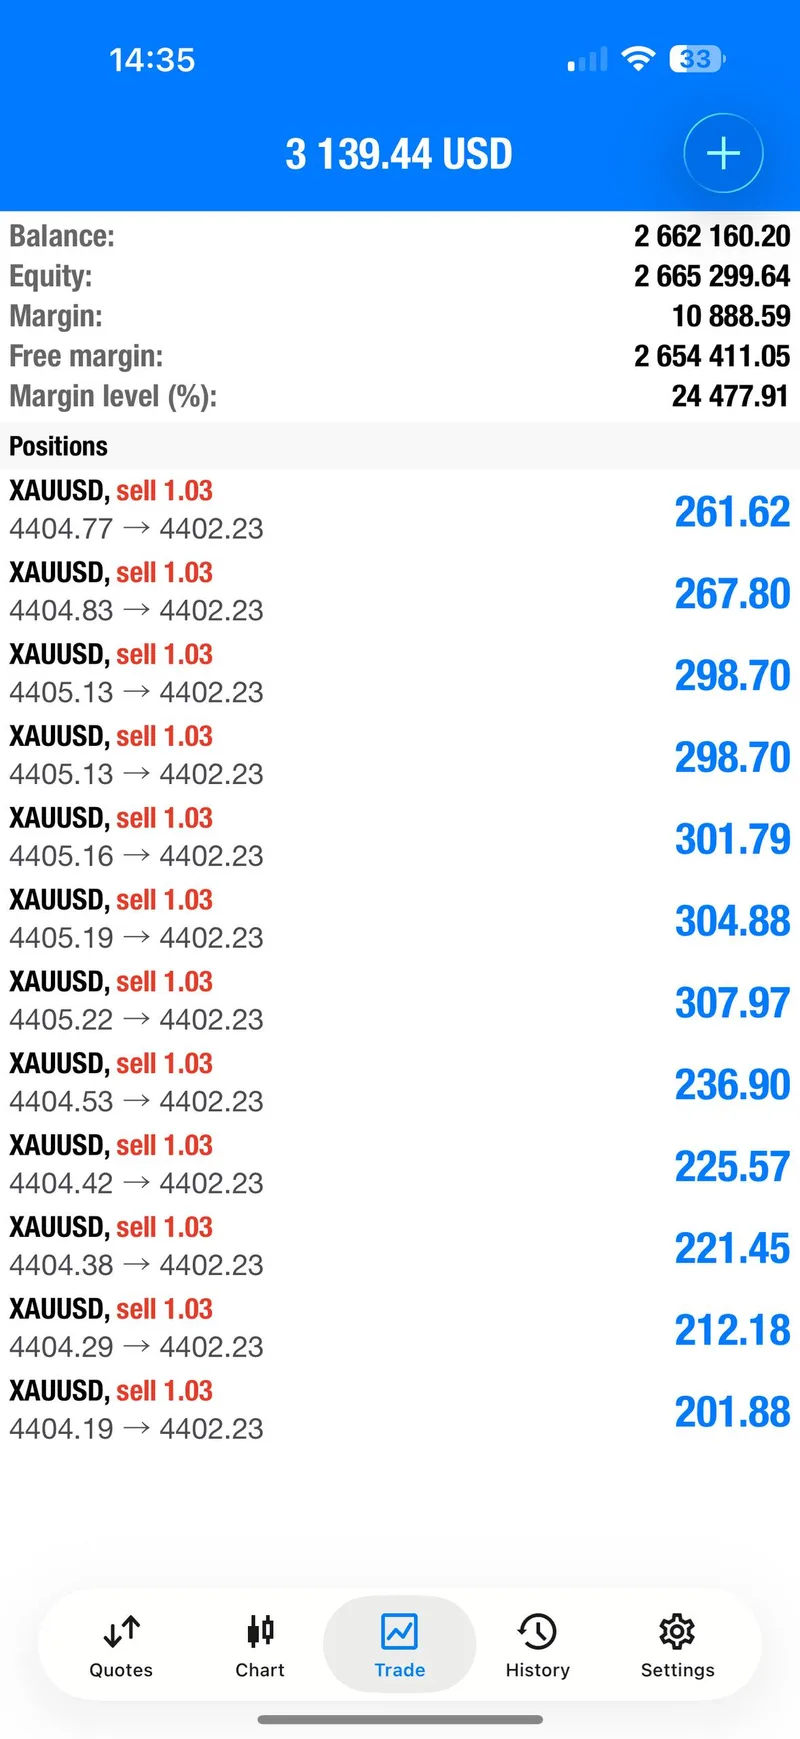
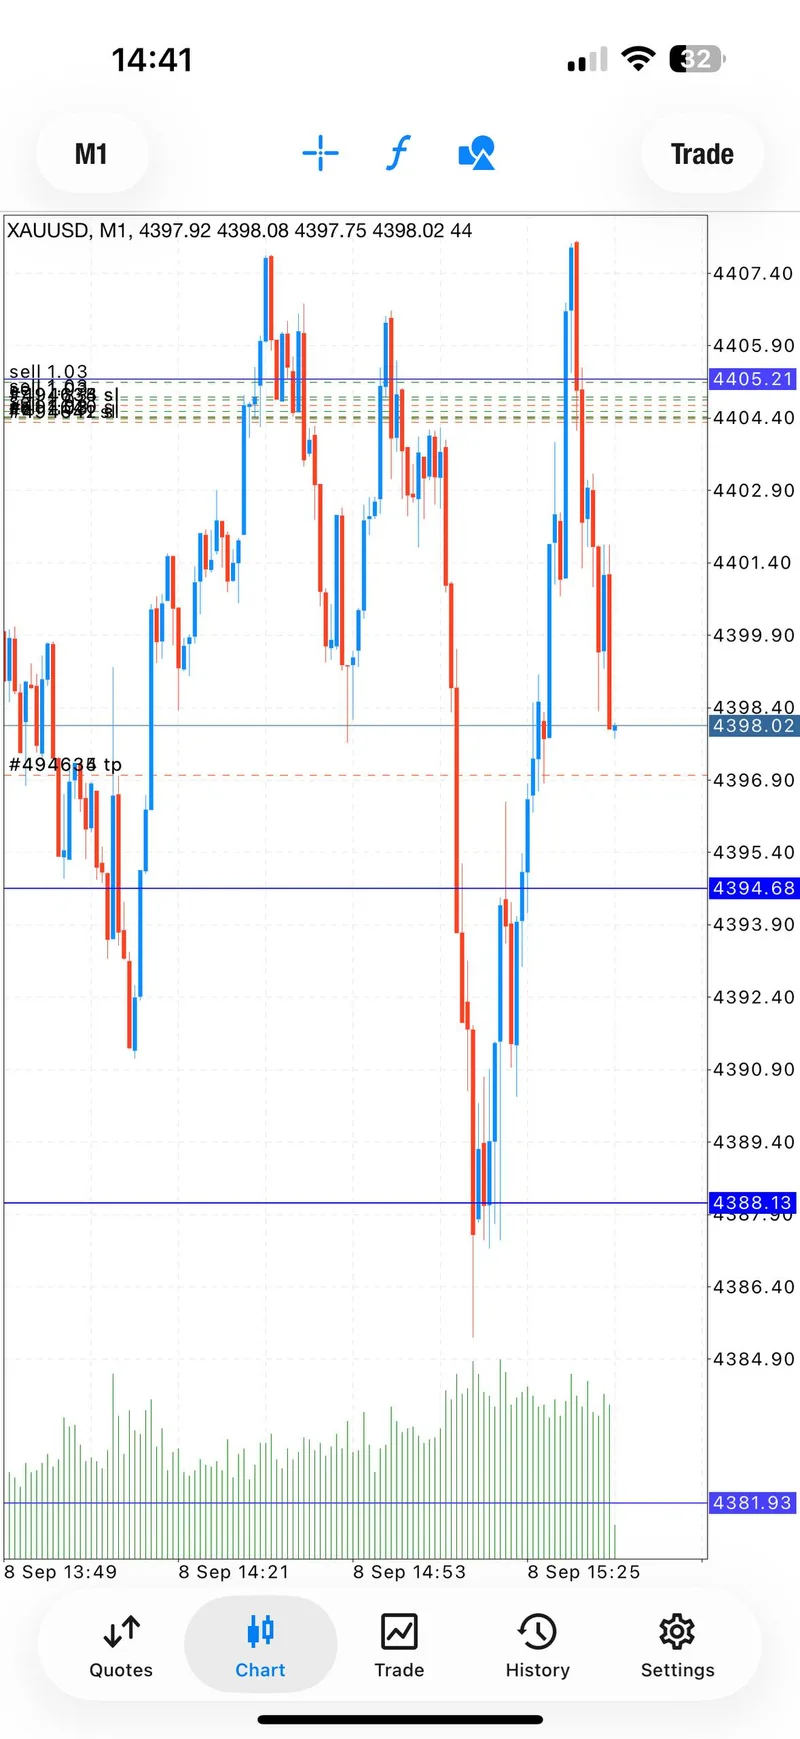
The later SELL was shared around 4405–4409 with a 4412 stop and downside targets at 4403, 4401, 4399, and 4397, followed by an open target. The channel posted immediate downside progress, then the second and third targets, a breakeven instruction, and a note that 60+ pips had been covered with the fourth target approaching. The public record then reported all four targets hit and two additional entries closed above 90 pips.
The SELL was fast enough that the channel asked whether members had managed to catch it. That is an important historical qualifier: a target run can be real and still be difficult to enter safely after the move has started. Nothing in this report should be read as a current SELL instruction.
Signal Performance Breakdown#
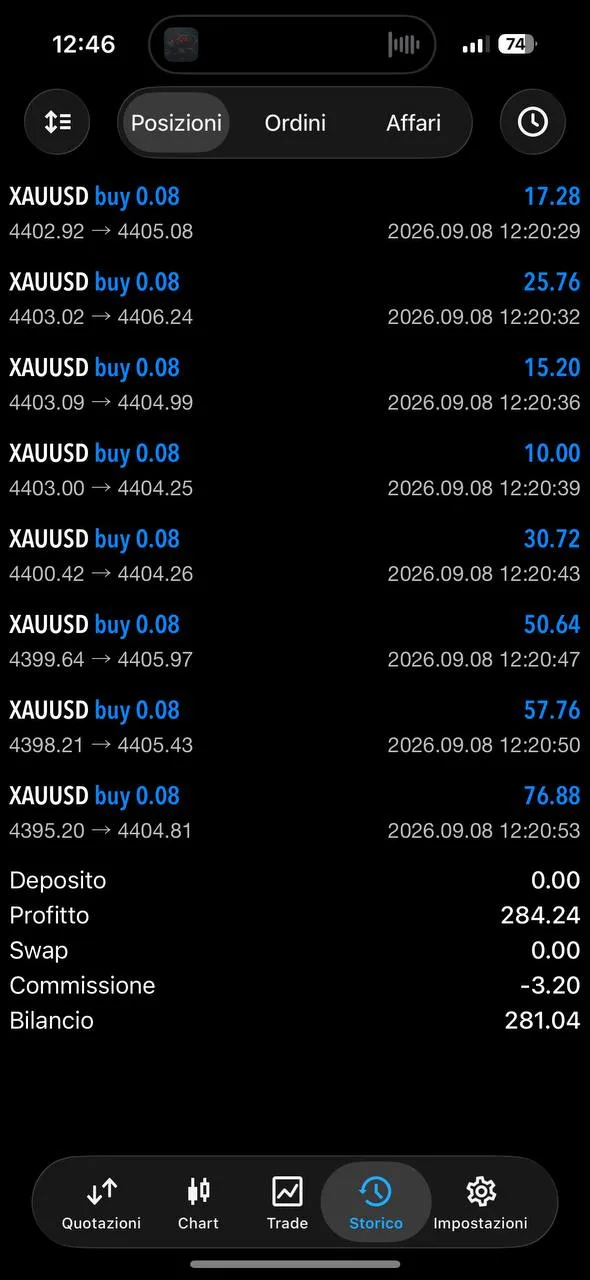
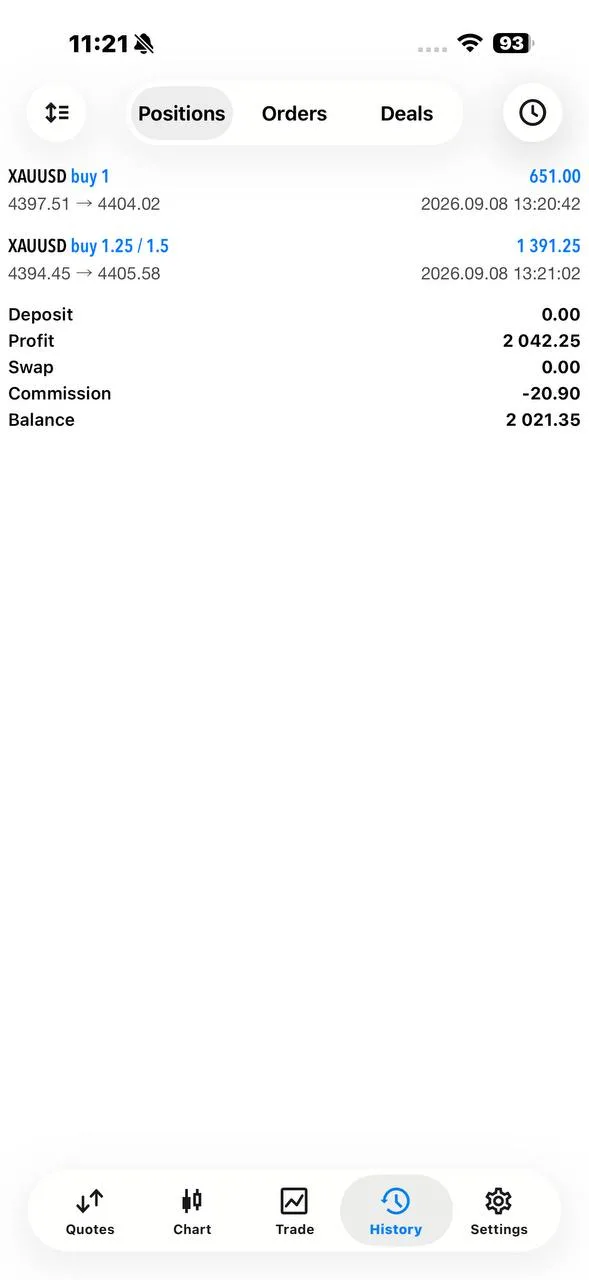
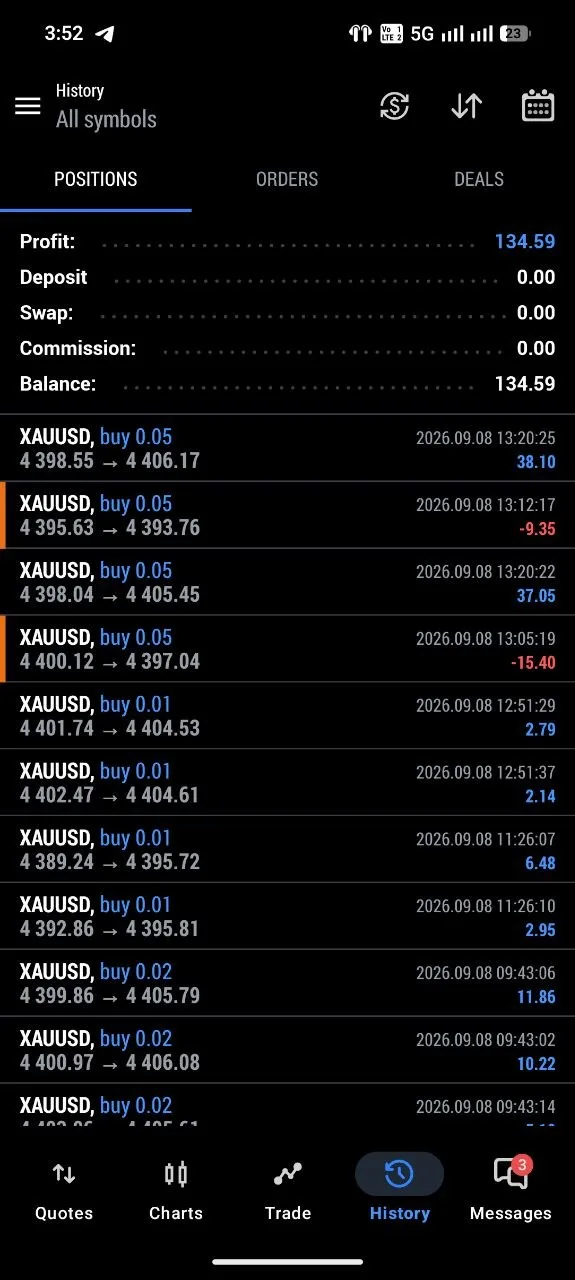
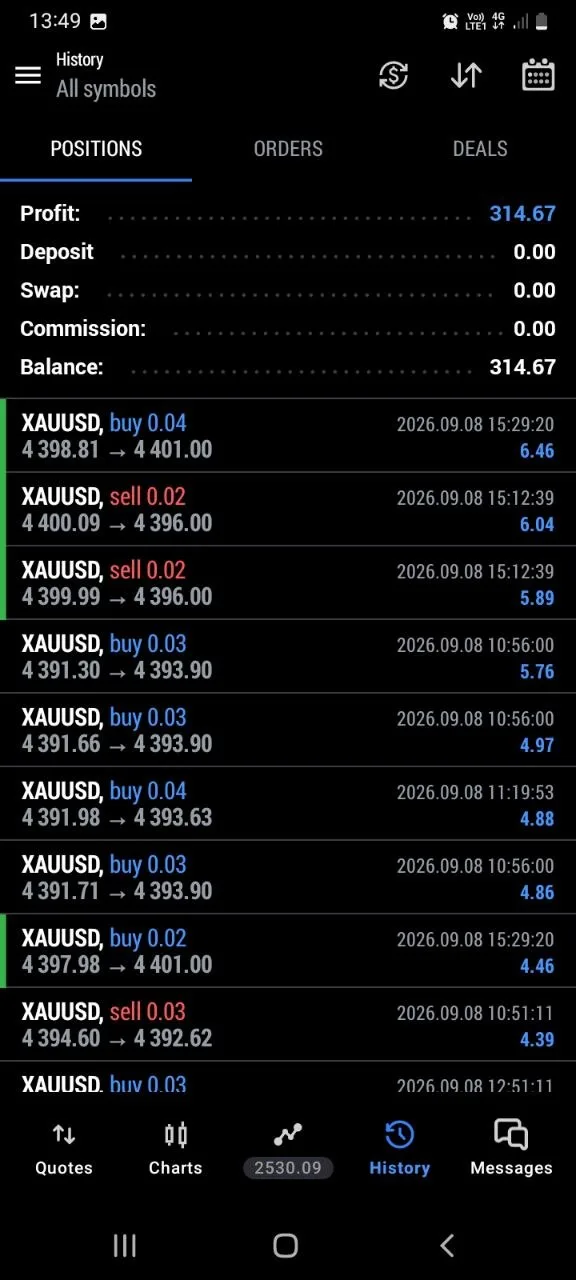
The cleanest way to read the day is as a sequence of decisions rather than a single scoreboard. The public record contains six selected trade-proof images for this article: charts, progress updates, and individual account screenshots tied to the BUY and SELL messages. The screenshots support the timeline, but they do not independently audit the reported dollar amounts.
| Sequence | What the record shows | Risk response | Reported outcome |
|---|---|---|---|
| BUY | 4402.3–4398 entry zone; 4395 stop; targets 4405/4407/4409/4411/open | Stop moved to 4392, profits taken into the burst, then breakeven | More than $30,000 up during the candle; $20,000 later described as closed |
| SELL | 4405–4409 entry zone; 4412 stop; targets 4403/4401/4399/4397/open | Breakeven after the third target as price accelerated | 60+ pips reported, all four targets hit, two entries above 90 pips |
One attached SELL screenshot also displayed an individual account balance of 2,662,160.20. That number belongs to one account and should never be read as a typical-member expectation. The same caution applies to the $20,000 and $30,000 figures: they are claims shared in the public channel on September 8, preserved here with their timing and caveats.
Member feedback from the same session#
The full public response contained 21 member feedback messages. Four community proof screenshots were selected because they were the clearest visual additions to the trade timeline; the other messages remain part of the total count and are not silently presented as four separate outcomes.
- Ludovico shared a screenshot described as profit from the last BUY trade.
- Ashish paired an account screenshot with the short reaction, “What a trade bro.”
- An anonymous member screenshot added another account result while keeping an initial-only sender private.
- Flavs shared an account screenshot from the same session without a text caption.
This is the useful balance for a reader: members did respond positively, and the screenshots add context, but a handful of account images cannot establish what every trader earned. The September 1 daily report uses the same separation between total feedback and selected proof, which makes day-to-day comparisons easier to trust.
Execution Lessons#
The first lesson is to define risk before the candle arrives. The BUY had a visible stop, a ladder of targets, and a later stop adjustment. Once the one-minute burst expanded, taking profit was a decision to bank a result, not an admission that the original idea had failed. Leaving some entries at breakeven reduced the cost of finding out whether the move could continue.
The second lesson is that speed changes the job. The SELL reached three targets almost immediately and had the fourth target inbound in under five minutes. Chasing that move after the fact would have changed the risk profile completely. Mo’s own question about who caught it is a reminder that a real result is not the same thing as universal access to the entry.
The third lesson is to let a missed trade stay missed. Earlier in the session the channel said it would not buy the trendline again and would watch instead. That restraint matters as much as the winning alerts. Professional execution includes skipping a familiar level when volume and positioning make the next attempt harder to control.
Finally, treat every screenshot as a piece of a timeline. A chart explains location, a progress post explains timing, and an account image shows one person’s result. Put together, they create a more honest recap than any one image can. Keep the claims historical, size positions for the account, and remember that a target ladder cannot remove market risk.
What The Day Means Going Forward#
September 8 leaves traders with a practical watchlist rather than a prediction. Around 4400, look for evidence that the rebound structure is holding before assuming another BUY will behave like the morning sequence. Near 4465, look for acceptance above resistance rather than a single spike. If both sides fail to produce follow-through, staying flat can be the more disciplined decision.
The next macro checkpoints are US PPI on September 10 and CPI on September 11. Higher yields or a firmer dollar could keep rallies under pressure; another geopolitical oil shock could revive defensive demand. Those forces can coexist, so the next report should start from fresh data instead of copying September 8’s levels.
For readers deciding whether the public channel is worth following, the strongest evidence is the complete sequence: a public BUY with protection, an honest note about taking profit and missing a better entry, a later SELL with a fast target run, and member screenshots that are clearly labeled as individual results. That is the kind of transparency to look for before contacting Gold Trader Mo through @GTMOBest.
FAQ#
Was the $20,000 result independently audited?#
No. The figure was reported in the public @GTMO record and is preserved as a historical, individual-account claim. The attached screenshots provide context for the sequence, but they are not an independent audit or a promise of future returns.
Did the report include both BUY and SELL setups?#
Yes. The BUY used the 4402.3–4398 zone with a 4395 stop and four upside targets. The later SELL used 4405–4409 with a 4412 stop and four downside targets. Both are completed historical examples, not live signals.
How can I follow the next public update?#
Message @GTMOBest to ask about free signals and FREE VIP channel access. Read the levels and risk notes in each new report before deciding whether any setup fits your own plan.
Connect with Gold Trader Mo#
Follow Gold Trader Mo for the next daily gold trading report, then message @GTMOBest for the free signal lane and information about FREE VIP access. You will get the clearest value from the channel by tracking the entry context, protection updates, and exits together instead of chasing a screenshot after a fast candle.
This daily report is educational market commentary, not financial advice. Trading involves risk, capital can be lost, and past performance or channel-reported results do not guarantee what happens in the next session.