
Market Snapshot#
September 9, 2026 was an intraday session to study for one reason: gold did not hand traders a clean, one-direction script. The public @GTMO channel record shows a sell idea, a recovery wait, and then a buy idea that was ultimately cut when the tape refused to confirm the expected move. That sequence makes this a risk-reset recap, not a victory lap.
The market snapshot used for this report was observed at 08:25 UTC, or 15:25 in GMT+7. XAUUSD spot was 4401.09 at that observation time. The same snapshot recorded an intraday high of 4412.76 and a low of 4341.61, with a quoted change of 45.54, or 1.10%. Because the session was still open when the data was captured, 4401.09 is a current spot observation, not a daily close or settlement.
| Metric | Intraday observation |
|---|---|
| XAUUSD spot | 4401.09 |
| XAUUSD high | 4412.76 |
| XAUUSD low | 4341.61 |
| Quoted change | 45.54 (1.10%) |
| DXY | 98.84 |
| US 10-year yield | 4.81% |
| WTI crude | 94.63 |
| VIX | 16.18 |
| Federal funds target range | 3.50%–3.75% |
The broader backdrop was a tug-of-war between demand for a defensive asset and pressure from yields, the dollar, and oil. The market brief associated the bid in crude with heightened Middle East risk, while the prospect of a September policy increase kept rates in focus. That combination can produce fast reversals: a headline lifts gold, a yield move interrupts it, and a technical level becomes more important than the first explanation offered on social media.
For readers who want the next public update, message @GTMOBest for free gold signals and channel access. The useful context is the sequence below, not a promise that a historical setup will repeat.
Why The Tone Changed So Fast#
The tone changed because the first directional read was reasonable but incomplete. Early in the session, the sell zone drew a quick response and several screenshots showed positions moving into profit. That did not turn the whole day into a winning trend. Price later returned to the zone, the protection level was adjusted, and the channel acknowledged that the idea had been hit. The public record then moved from confidence to recovery planning.
That change in tone is important for anyone reading a daily gold trading report after the fact. A chart can look obvious once the candles are finished, but the decision point arrives before the outcome is known. On September 9, the desk had to decide whether to keep forcing the original bearish view, wait for a cleaner structure, or prepare a different scenario. Waiting became part of the trade plan.
The recovery message also fits the pattern seen in the September 8 two-way session recap. That earlier report showed how quickly gold could switch between a buy recovery and a sell continuation. The comparison is useful because it keeps this report grounded: a volatile day can contain good execution moments and still require a reset before the next decision.
Technical Outlook#
The observed structure gave traders four practical reference points:
- First resistance: 4412.76.
- Second resistance: 4434.00.
- First support: 4355.55.
- Second support: 4341.61.
With spot at 4401.09 at the observation time, gold was below the first resistance and well above the session low. That positioning leaves two competing reads. A confirmed push through 4412.76 could reopen the path toward 4434.00. A failure below that area, followed by a break of 4355.55, would put the 4341.61 low back into focus. Neither scenario should be treated as an instruction by itself; confirmation and invalidation still matter.
The technical story is easier to understand beside the September 7 report on a four-target sell. That day rewarded continuation after a clean break. September 9 did the opposite: the first sell moved, then the follow-through weakened, and a later buy attempt also failed to hold. The difference is a reminder that the same market can reward patience one day and punish prediction the next.
The September 4 recovery report adds another useful comparison. It framed recovery as a process of managing a mixed session, not as an excuse to erase the difficult parts. That is the right lens here as well. The levels are a map; the evidence decides which route is open.
Trading Signals#
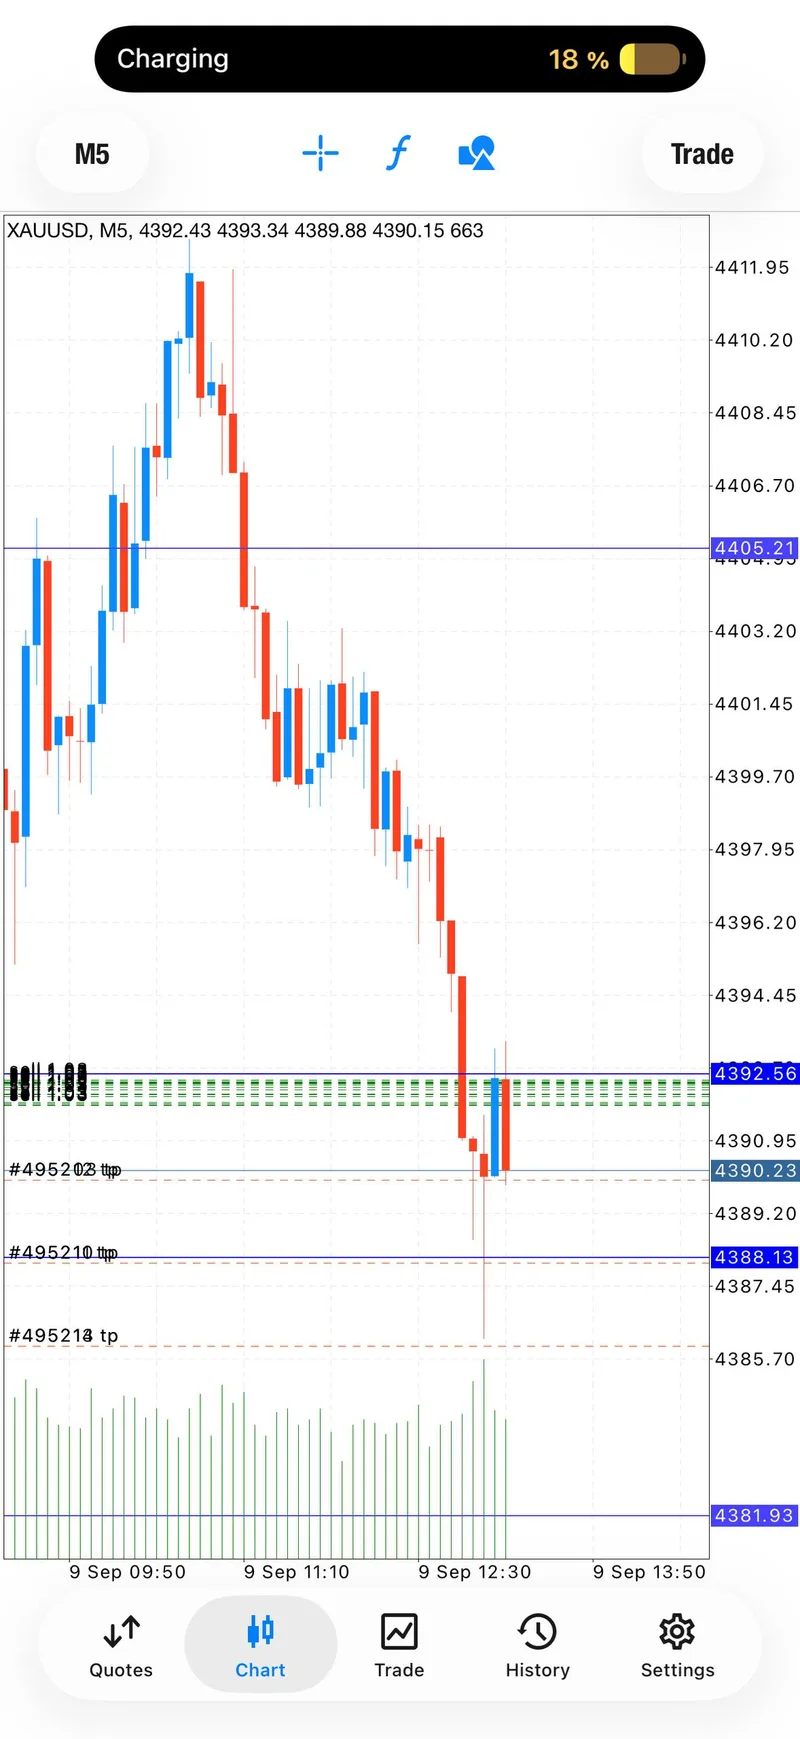
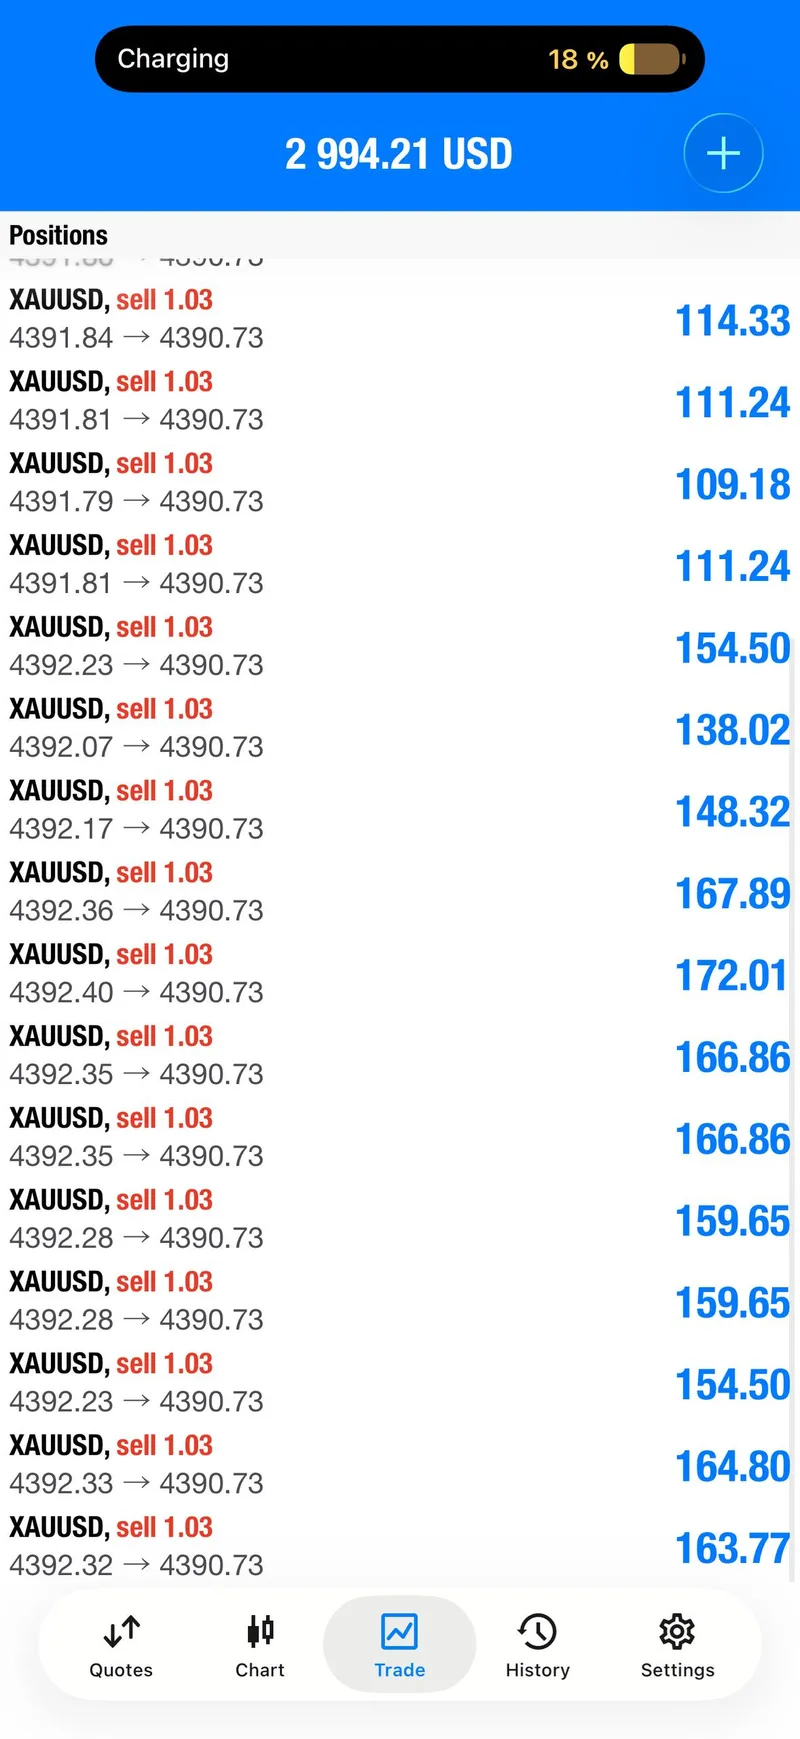
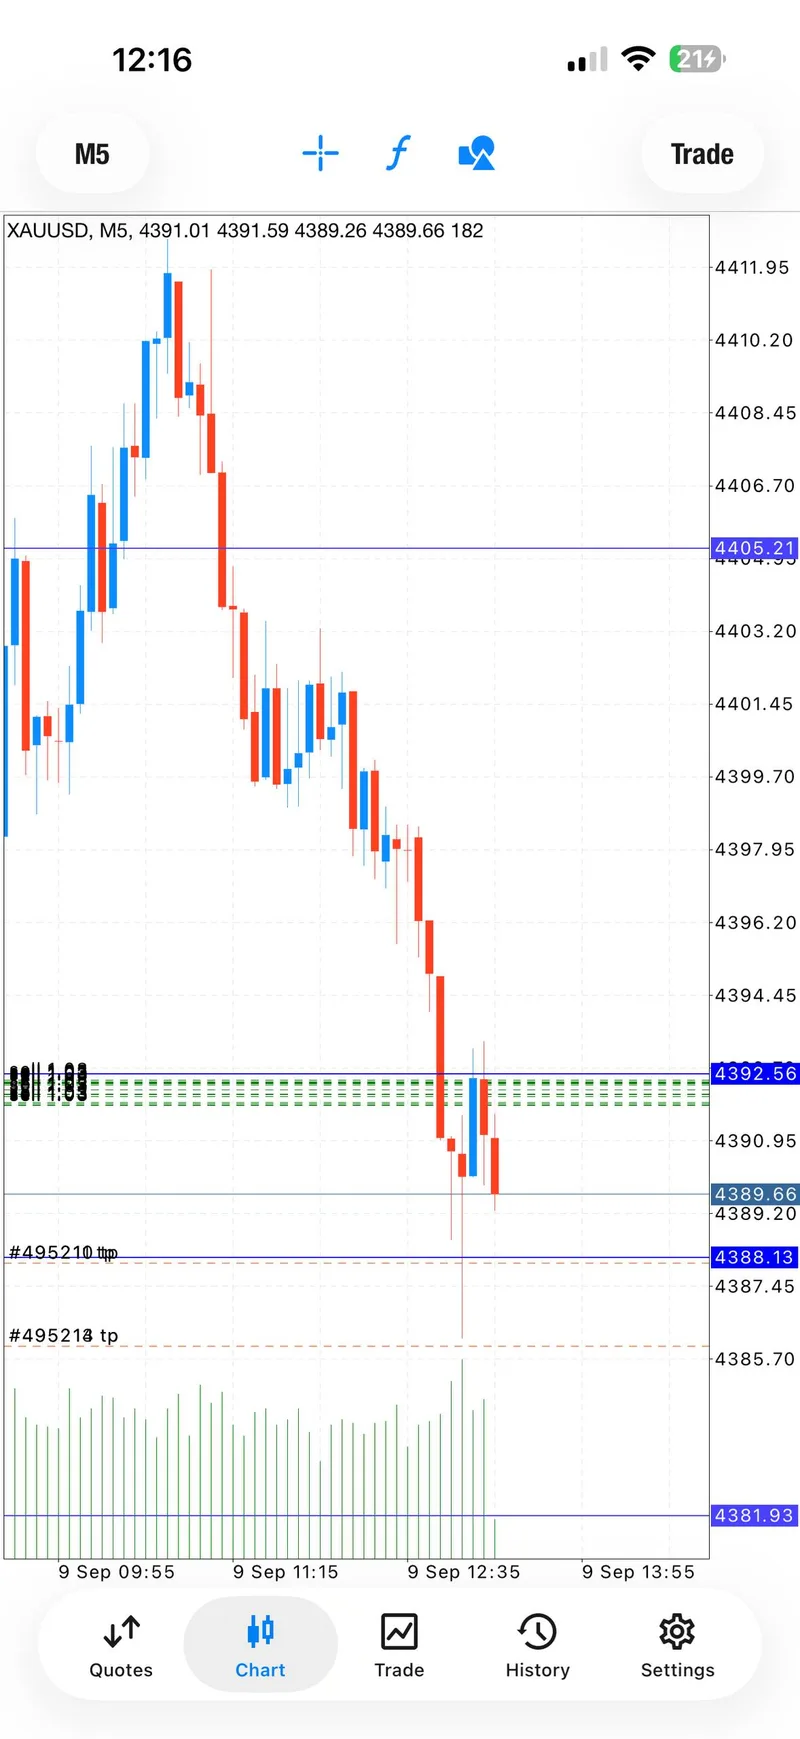
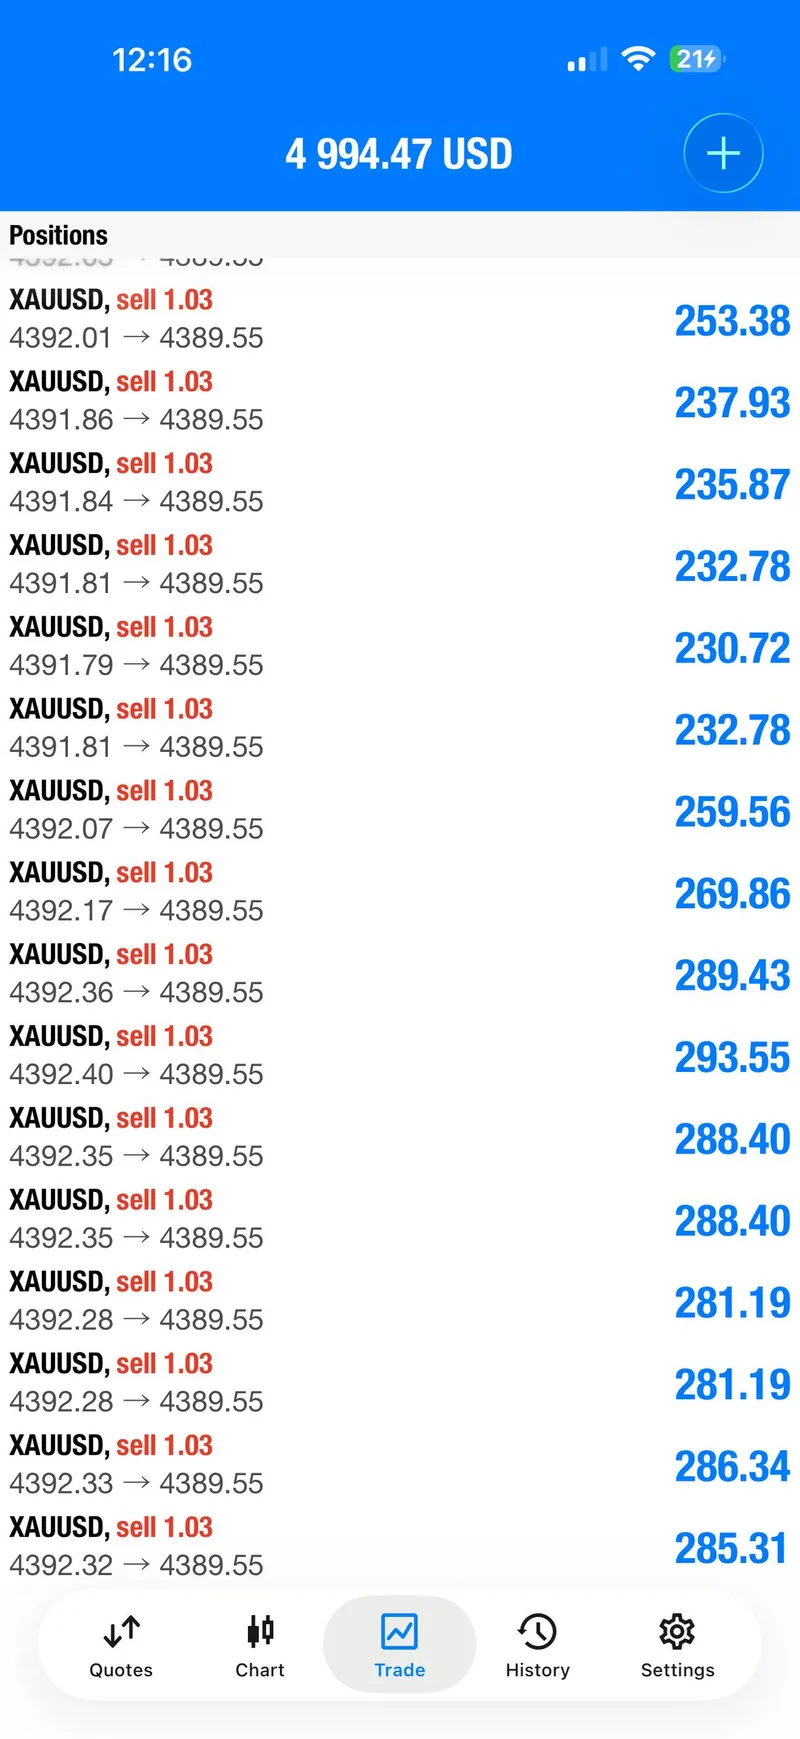
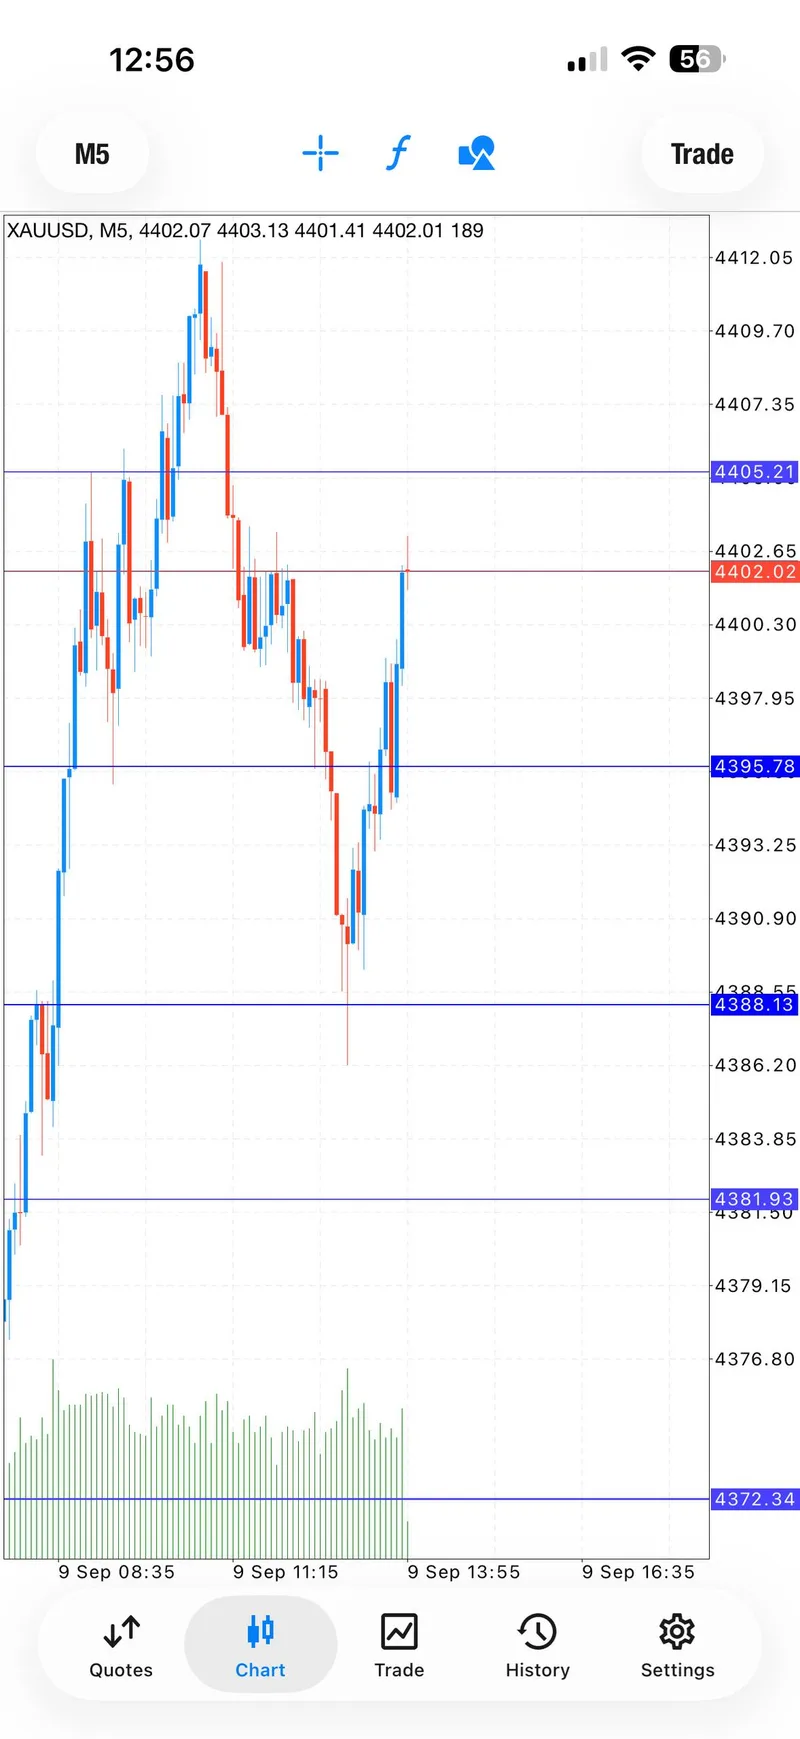
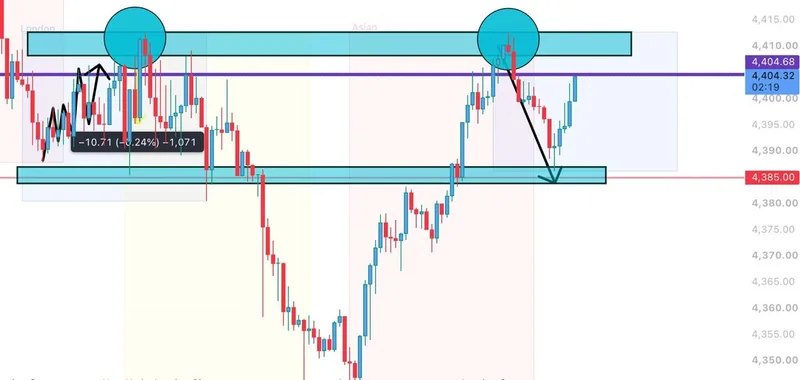
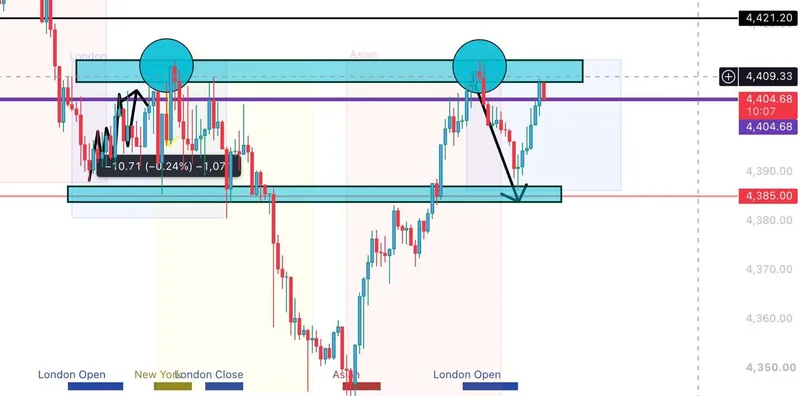
The public record contained two canonical setup sequences. Repeated copies in the free and paid lanes are treated as one setup each, so this report does not inflate the count.
Signal 1 — SELL sequence#
The first sell was announced around the 4392–4396 zone with an invalidation level at 4400. The planned ladder was 4390, 4388, 4386, 4384, and then an open target. The early screenshots show why the idea attracted attention: price moved into profit quickly and the first target was acknowledged. A later update moved protection to 4402, followed by a message closing the trades.
The important qualification came immediately after. The channel explained that it had expected a drop connected to the move in oil, but price action chose a different path. The message described the result as a hit and promised a recovery attempt rather than pretending the first idea had remained valid. That is the complete sequence: an attractive first reaction, a return into risk, an exit, and a transparent reset.
Signal 2 — BUY recovery attempt#
After a two-top retracement and a period of waiting around the US-session zones, the next canonical setup was a buy from 4408–4404. Its initial invalidation level was 4400, with planned upside checkpoints at 4410, 4412, 4414, and 4416 before an open extension.
The buy did not receive the confirmation the desk wanted. The last protection level was first adjusted to 4397 and later to 4395.5 as volume increased. The channel then stated that the position was cut for a loss. This was not presented as a hidden win or a delayed target; it was a failed recovery attempt documented in the same public lane.
Taken together, the two setups explain the day's mixed character. The first sell produced an early profit window but was later hit. The second buy was an attempt to recover structure and was also cut. There is no verified same-day dollar close in the source record, so this report does not invent one.
Signal Performance Breakdown#
The cleanest way to measure this session is by decision points rather than by a single headline number.
First, the sell idea did what a short-term setup is supposed to do at the start: it reached a favorable area quickly enough for the channel to show progress and acknowledge the first target. Then price invalidated the broader expectation. Moving protection and closing the trades limited the time spent arguing with the market, but the public recap still called the hit honestly.
Second, the recovery buy was not taken immediately after the first loss. The channel waited for the London retracement to develop, described the two-top structure, and watched the US session before committing to another direction. That pause is evidence of process. The later buy still failed, but it was not a blind revenge entry made in the same breath as the first result.
Third, the final note matters more than a polished screenshot. The channel reported being $55k down, accepted responsibility for the decisions, and explicitly rejected revenge trading. It chose to rest and return with a clear mind. That is not a performance claim; it is a risk-management record.
Seven selected public screenshots accompany this report. They show the early sell progress, the target-stage update, the protection discussion, the admission of the first hit, and the chart context for the recovery attempt. No member feedback or testimonial is presented because none was verified in the September 9 archive.
Execution Lessons#
The first lesson is to separate a favorable reaction from a completed thesis. A sell moving into profit is useful evidence, but it does not prove that every planned target will print. The 4392–4396 zone and the 4400 invalidation level created a defined idea; they did not remove the need to respond when price returned.
The second lesson is that a recovery trade needs its own invalidation. The buy from 4408–4404 was not simply an extension of the earlier sell. It had a fresh structure, fresh protection, and fresh checkpoints. When volume increased and the updated protection levels at 4397 and 4395.5 no longer preserved the intended read, cutting the position was the defensible action.
The third lesson is emotional, but still technical in consequence. A reported $55k loss can create pressure to win back money immediately. The channel's decision to stop, avoid revenge trading, and return the next day is the part worth studying. Capital preservation is not a slogan; it is what keeps one difficult session from becoming a sequence of larger decisions made under stress.
Finally, use market context as a filter, not as a guarantee. Oil, yields, the dollar, policy expectations, and geopolitical headlines can all explain a move after it happens. The chart still has to confirm the level in front of you. On a fast XAUUSD session, the most professional sentence may be “the setup was hit; wait for the next clean structure.”
What The Day Means Going Forward#
September 9 belongs in the recovery-and-reset category. The report is useful because it preserves the uncomfortable middle: an early sell that looked promising, a hit, a patient pause, a buy attempt, and a second cut. Readers do not need to copy either setup. They can use the sequence to ask better questions before the next session begins.
The first question is whether price can reclaim 4412.76 and hold it long enough to make 4434.00 relevant. The second is whether weakness through 4355.55 exposes 4341.61 again. The third is whether the macro pressure from a 4.81% ten-year yield and 94.63 WTI remains strong enough to interrupt gold's defensive bid. These are scenario questions, not forecasts.
The broader takeaway is simple: a daily gold report earns trust by showing how the plan changed. The public @GTMO record did not hide the failed ideas, and it did not turn a loss note into a promise. That honesty gives tomorrow's analysis a cleaner starting point.
FAQ#
Was September 9 a winning or losing day?#
It was a mixed, risk-reset session. The first sell moved into profit and later hit, while the subsequent buy recovery attempt was cut. The source record does not provide a verified final dollar close for the day, so a single win-or-loss label would be incomplete.
What was the main XAUUSD zone?#
The first sell was planned from 4392–4396 with an invalidation level at 4400. The later buy recovery attempt used 4408–4404 and was managed with protection updates at 4397 and 4395.5.
What were the key market levels at the observation time?#
The snapshot recorded resistance at 4412.76 and 4434.00, with support at 4355.55 and 4341.61. Spot was 4401.09 at 08:25 UTC, so those values describe an intraday map rather than a closing print.
Why include a loss note in a trading recap?#
Because the loss note explains the decision boundary. The channel reported being $55k down, rejected revenge trading, and chose to rest. That is relevant risk information even though it is not a result to imitate.
Where can readers follow the next update?#
Readers can follow the free public @GTMO lane and message @GTMOBest for free signals and channel access. Historical reports are context, not live instructions.
Connect with Gold Trader Mo#
For more historical market recaps, visit Gold Trader Mo and browse the daily reports archive. The public @GTMO channel is the place to watch the next setup develop in real time, while @GTMOBest is the direct contact for free signal updates and channel access.
This report is educational market commentary, not financial advice. Trading involves risk, leverage can magnify losses, and past performance does not guarantee future results. Always size positions for your own account, verify conditions independently, and use a defined risk limit.