
Want free signals and FREE VIP channel access? Message @GTMOBest before you read the next setup.
This historical August 14, 2026 XAUUSD recap is built around a clear Friday sequence: the public @GTMO record first showed a BUY setup that reached all four fixed targets, then a second BUY setup that reached its first target and moved to breakeven. The day also produced exactly 40 member feedback messages and 10 selected public proof screenshots.
It is a past-session record, not a live instruction. Trading involves risk, account size and execution differ, and results may vary. The public record shows what was shared and reported that day; it does not promise the same outcome for every trader.
Market Snapshot#
Market context supported the story without replacing it. Same-day published references described gold as pulling back after a prior-session high near $4,449.39. Those references placed spot gold around $4,371 at 09:00 ET, while the published intraday range reference was approximately $4,311.22-$4,386.91. A universal XAU/USD close was not verified at the 21:00 GMT+7 evaluation point, so this report uses an area rather than pretending there was one provider-neutral close.
| Reference | August 14 context |
|---|---|
| XAUUSD area | Approximately $4,311.22-$4,386.91 intraday; no universal close verified at 21:00 GMT+7 |
| DXY | Approximately 99.9-100, low-precision intraday reference |
| US 10-year yield | Approximately 4.66%, low-precision intraday reference |
| Macro backdrop | July PPI at 4.7%; CME FedWatch showed a 69.4% September hold probability |
| Session frame | Historical GMT+7 recap, not a live quote or signal |
The same-day market context had two forces in tension: profit-taking after a stretched rally, and a macro backdrop that remained supportive of a non-yielding asset through cooler inflation expectations. That helps explain why the desk began with patience around structure and then acted once bullish momentum became clearer. It does not create the trading result. The stronger evidence is the public sequence of zones, targets and protection updates.
For a session-by-session comparison, readers can also review the August 13 XAUUSD recap, the August 12 gold report, and the August 11 recap. The broader Gold Trader Mo report archive keeps the historical record in one place.
Why The Tone Changed So Fast#
The opening discussion was not a blind chase. The public record described an Asia-session low near a previous support zone, London opening in the middle of the structure, and a yellow middle zone that could act as minor resistance while price remained below it. The stated operating message was patience: none of the zones was involved in price action yet.
That tone changed as the lower-timeframe structure strengthened. A later public update described gold as strongly bullish with little room for sellers, followed by a ready notice and the first BUY call. In plain language, the day moved from waiting for confirmation to managing a move that had started to reward the chosen direction.
The first sequence then made the story unusually easy to audit. It had a readable entry band, a stated stop, four fixed targets, and follow-up messages marking target progress. After the third target, breakeven protection was called out before the fourth target was reported. The later second sequence repeated the same protection-first rhythm, even though its final target ladder was not claimed as fully complete in the available record.
Technical Outlook#
The levels below describe August 14 evidence and should not be reused as a live trading plan.
- The first historical BUY zone was 4350.2-4346, with 4342 as the stated stop and fixed targets at 4352, 4354, 4356 and 4358.
- The second historical BUY zone was 4351-4347, again with 4342 as the stated stop and fixed targets at 4353, 4355, 4357 and 4359, plus an open continuation reference.
- Broader same-day market references placed an upper context area near 4430-4449.39 and lower reference levels around 4320, 4287 and 4155. These are market-context levels, not promises about the next session.
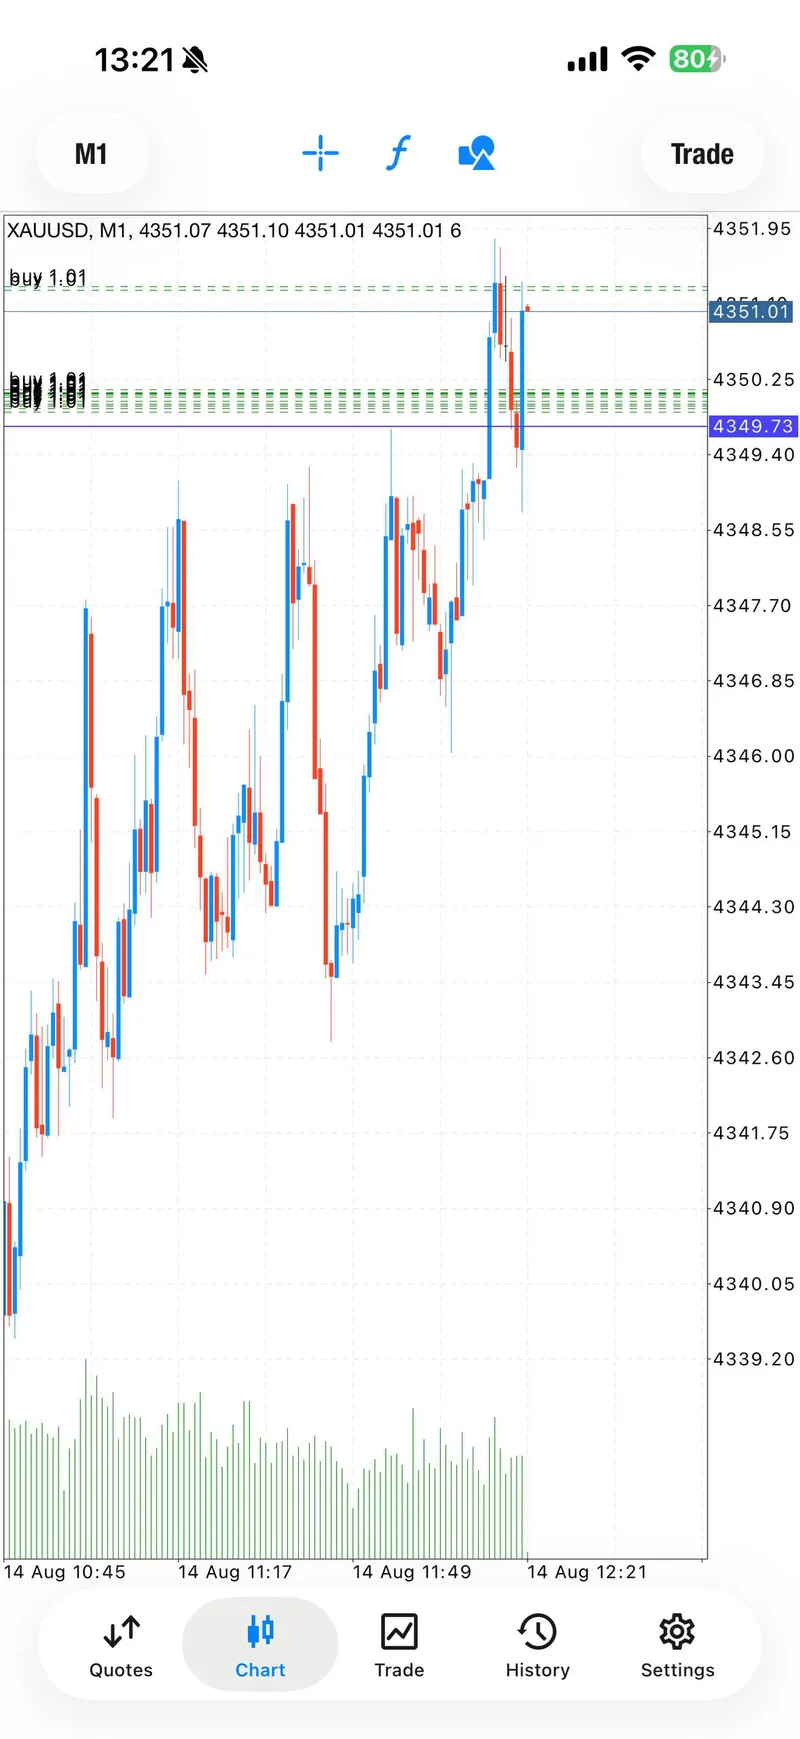
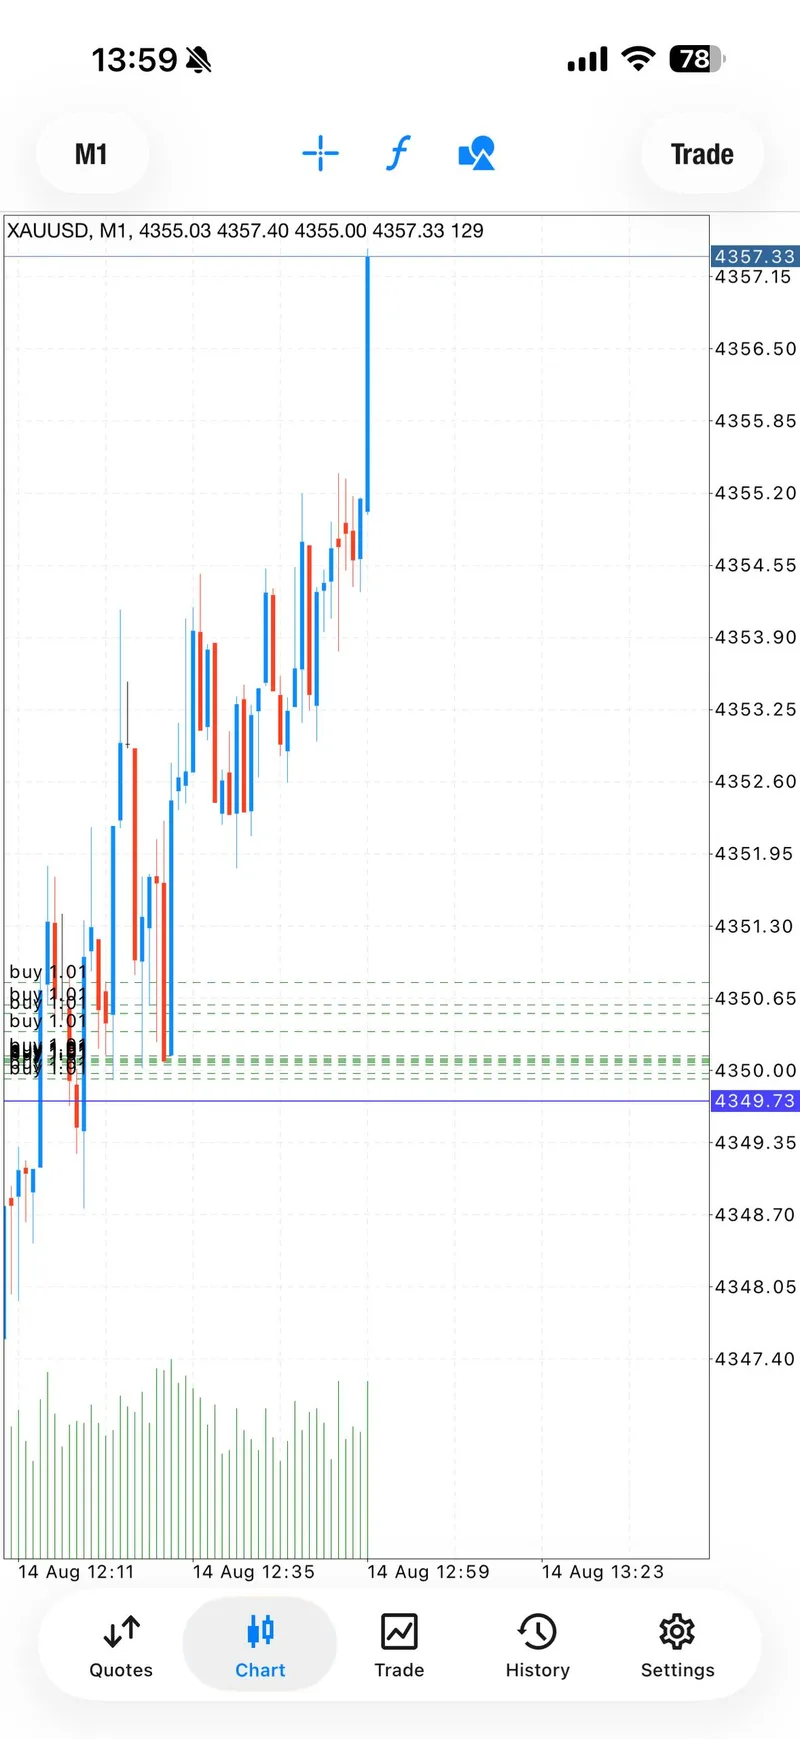
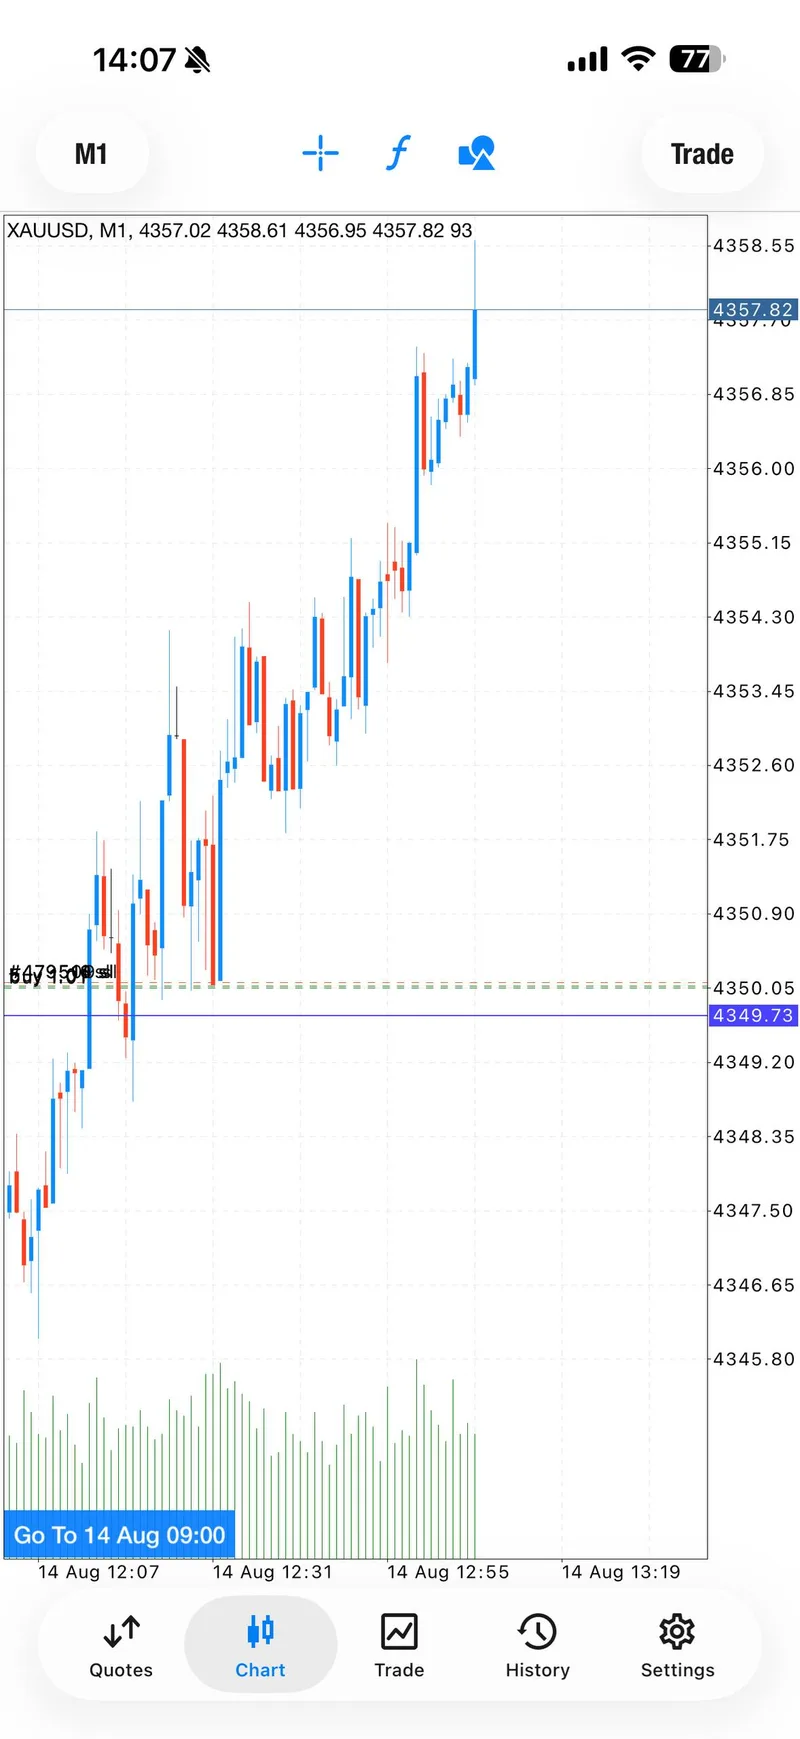
- The chart screenshots show why the risk language mattered: the first setup moved through the target ladder, while the second setup was reduced toward breakeven after its first target.
The useful lesson is the order of operations. A zone came first, invalidation was visible, targets were staged, and the risk conversation changed as price moved. That is more informative than a single result screenshot with no explanation.
Trading Signals#
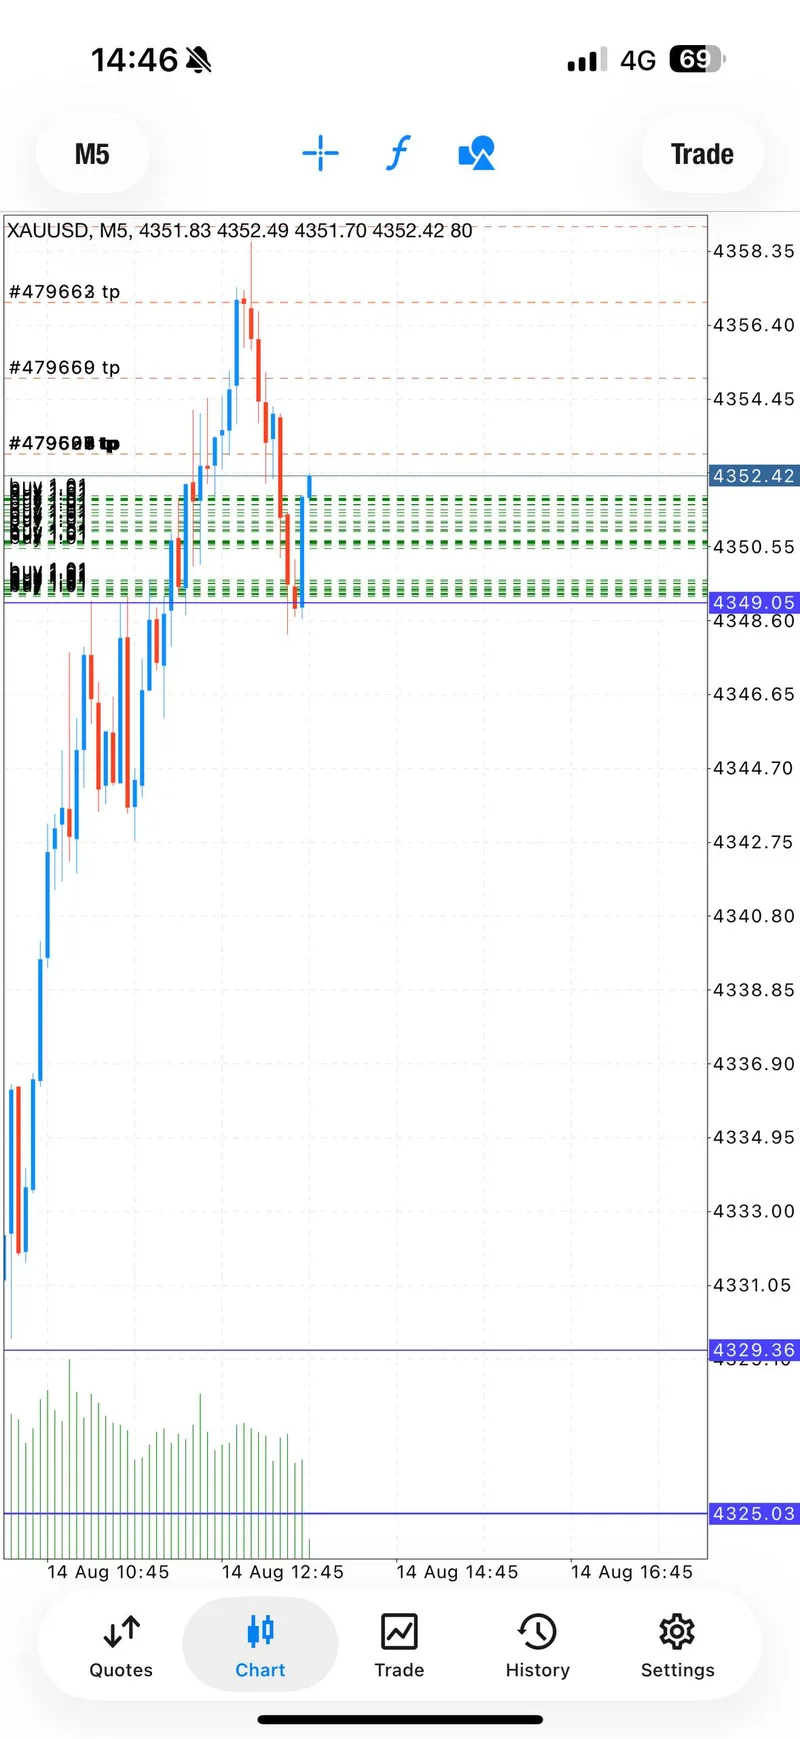
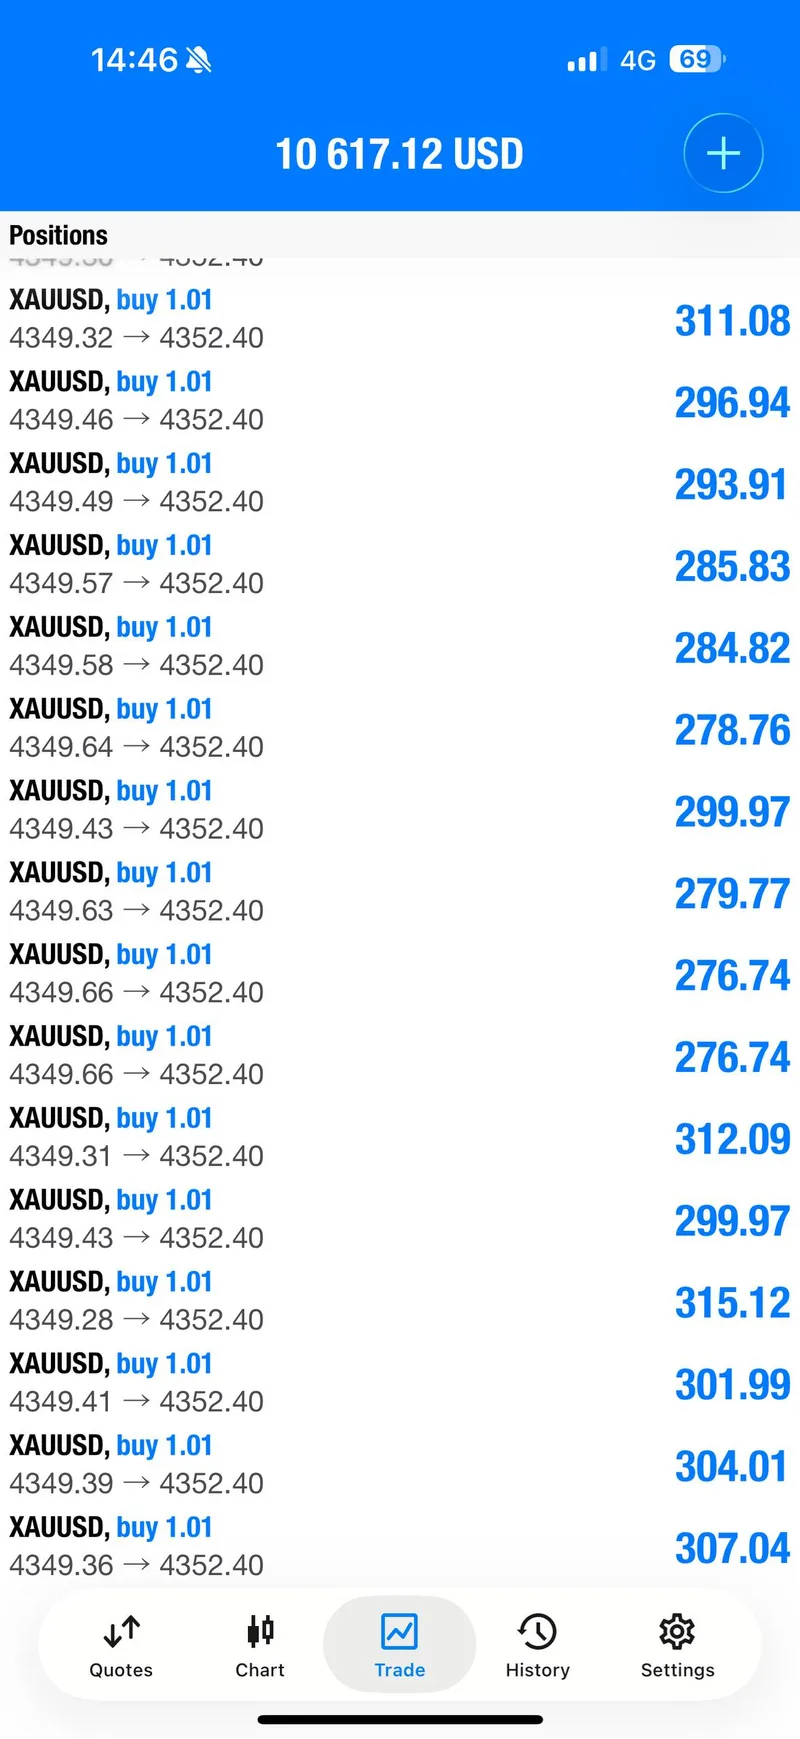
Signal 1 — 4350.2-4346 BUY sequence#
The first parameterized public BUY call gave the 4350.2-4346 entry band, 4342 stop, and fixed targets at 4352, 4354, 4356 and 4358, with an open continuation reference. The earlier short “Gold buy now” line was the start of the same public sequence, not a separate setup; the fully parameterized line is the canonical record for this recap.
The follow-through was reported in stages. TP1 and TP2 were checked within minutes. Later updates reported TP3 and told traders to set breakeven for zero risk. A further update marked TP4 as incoming, followed by “All 4 TakeProfits brought home” and a later checklist showing TP1 through TP4 complete. The strongest defensible claim is therefore precise: this first BUY sequence had four fixed targets reported complete in the same-day public record.
Signal 2 — 4351-4347 BUY risk-reset sequence#
After the first sequence, the public channel called for another BUY and then published the parameterized 4351-4347 entry band, 4342 stop, and fixed targets at 4353, 4355, 4357 and 4359, plus an open continuation reference.
The available record supports a narrower outcome claim for this second setup. It reported all entries in profit, instructed partial profit-taking at TP1 with the worst entries closed first, then called for risk reduction and breakeven. The same-day evidence does not show a clear all-four-target completion for this second ladder, so this recap does not claim one. That boundary is important: the first sequence delivered the all-four-target headline; the second sequence delivered a documented TP1 and risk-reset story.
Together, these were two parameterized BUY setups, not three. The unparameterized “Gold buy now” lines appeared immediately before their corresponding detailed zones and were treated as sequence openers rather than extra trades.
Signal Performance Breakdown#


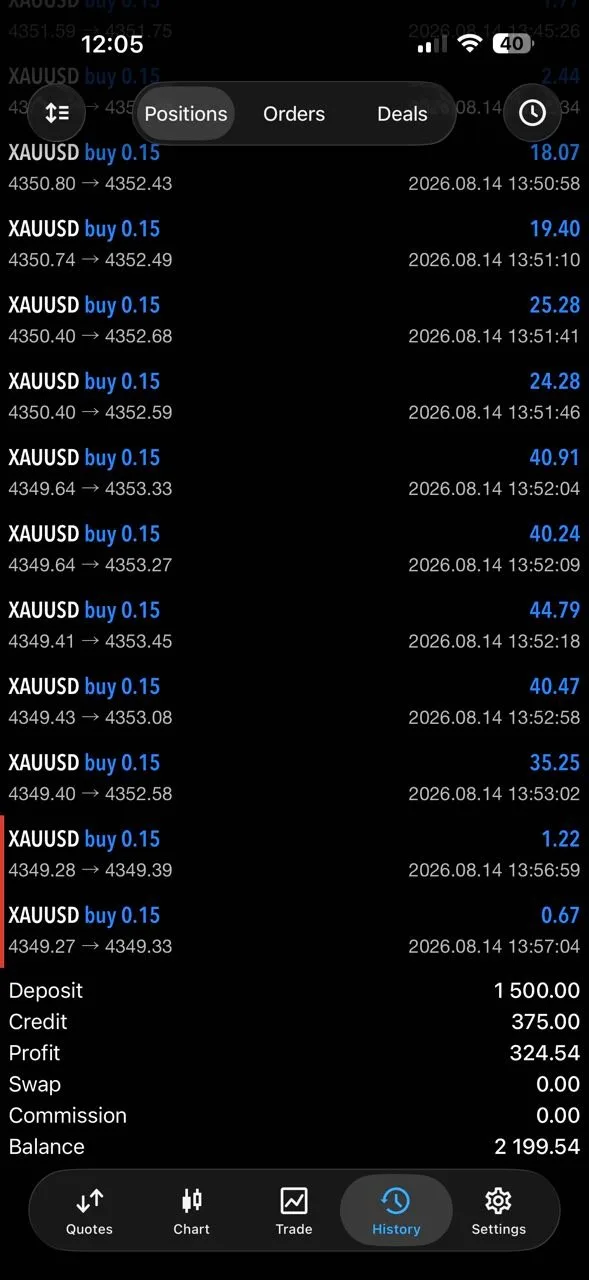
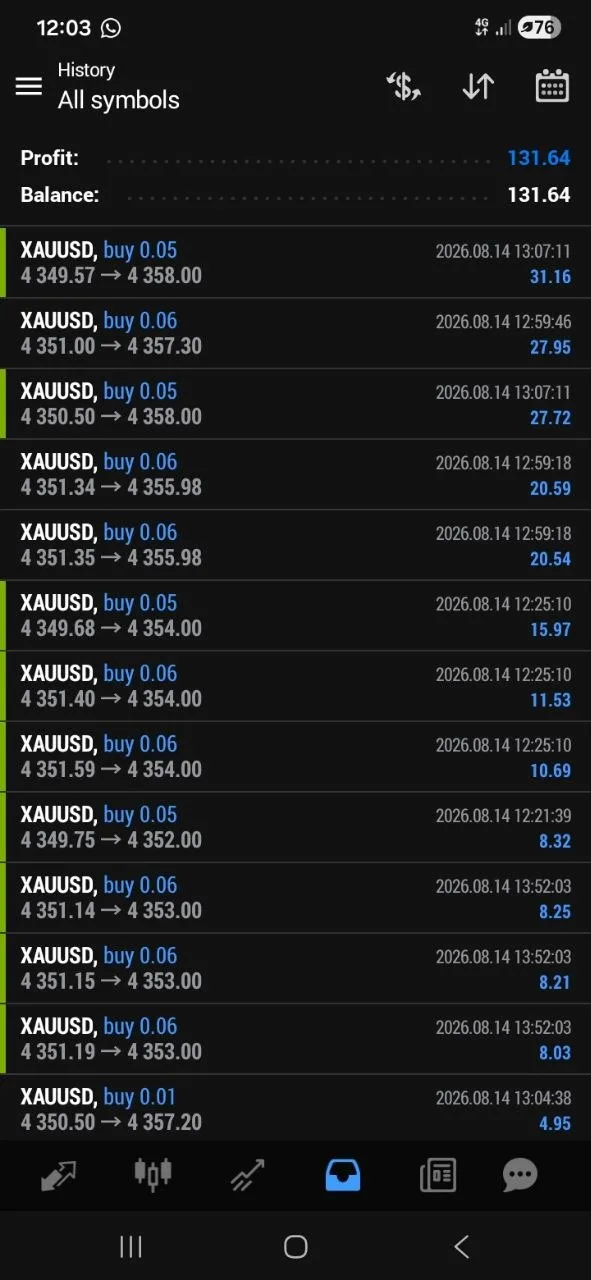
Exactly 40 member feedback messages appeared in the same-day public record. That is the total feedback count, not the number of screenshots shown here.
The gallery contains 10 selected public proof screenshots: 6 trading-sequence views and 4 member-account or member-response views. Those counts are intentionally separate. A screenshot is not automatically a new feedback message, and an account-history screen is not a typical-result claim.
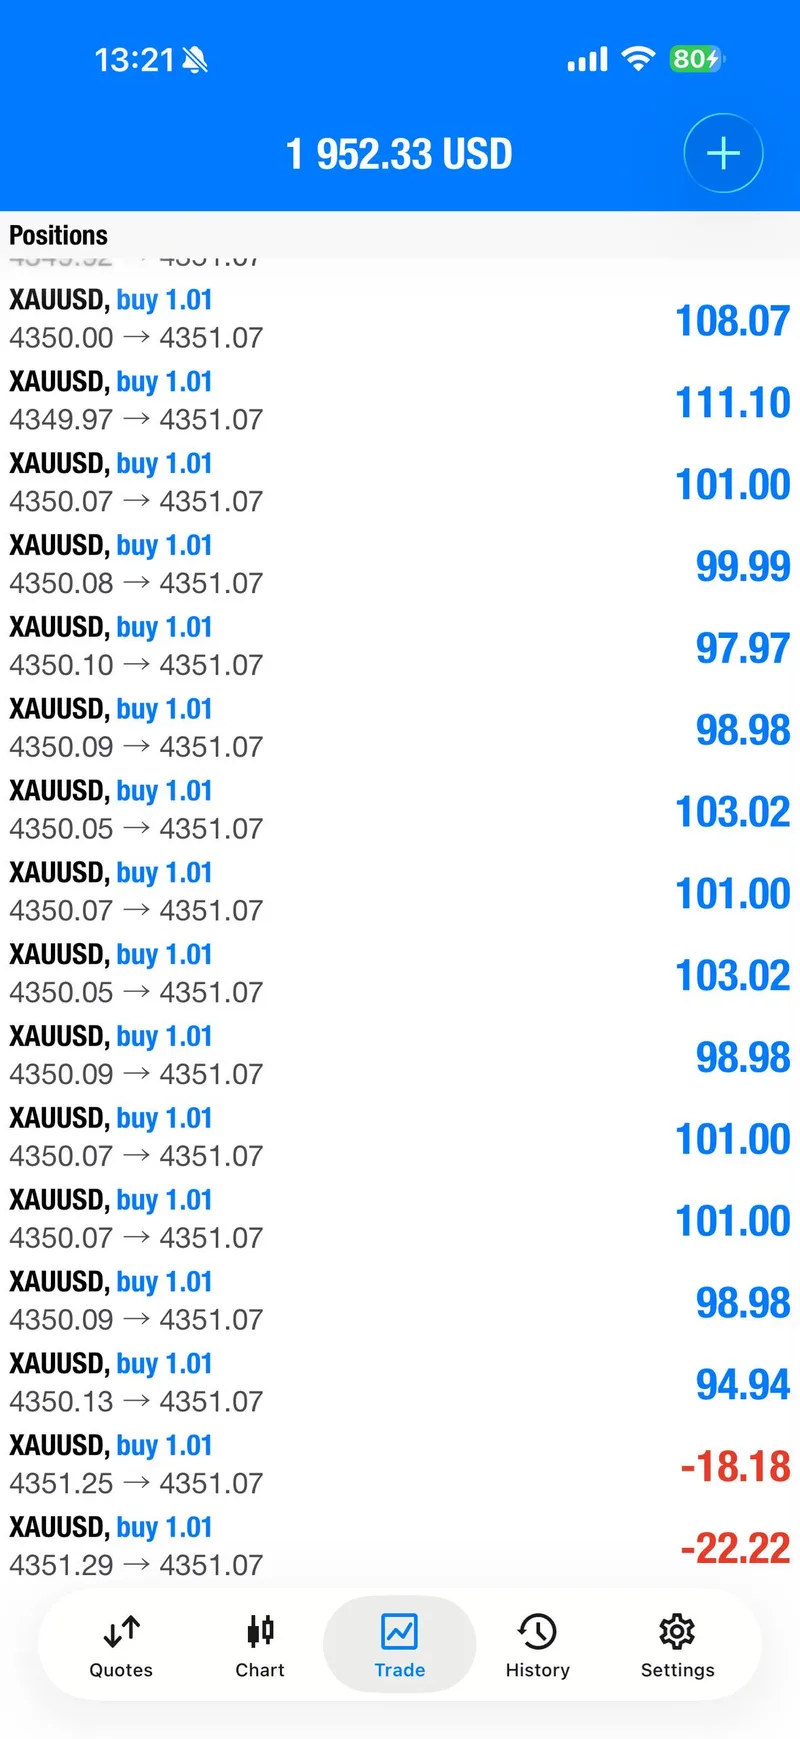
The trading gallery follows the sequence from the early BUY area through the first setup’s target progression and into the second setup’s risk reset. One account view displays multiple XAUUSD BUY positions and positive dollar amounts; it is presented as account-specific evidence, not as a promise about position sizing or returns.
The member layer is equally concrete but still needs context. A member screenshot shows a 4350.18 to 4353.30 XAUUSD buy with a displayed $11,530.19 result. Another shows a 4350.18 to 4352.15452 buy with $12,259.05 displayed. A separate history view shows same-day entries moving from roughly 4349.57-4351.59 toward 4353-4358 with $131.64 displayed. Another member history screen shows multiple same-day buys moving from roughly 4350.40-4350.80 toward 4352.43-4353.45 with $324.54 displayed.
These are public individual-account views. Balance, leverage, lot size, broker conditions and timing vary, so none of those amounts should be read as a typical result. The written feedback added the human response: Tom Heidenreich posted “Thank you mo!”, Bartosz said he was learning step by step and building his account, and Rdubs reported “130 today, 760 this week.” Those replies show engagement and individual experience, not a statistical performance guarantee.
Execution Lessons#
First, count the setup from the complete parameterized record. Mirrored FREE and VIP messages repeated the same public sequence; counting every short opener and mirror would inflate the story.
Second, staged targets made the first move readable. The four-target ladder let the public record show progress instead of asking readers to trust a single end-of-day statement.
Third, breakeven changed the risk profile of the story. After TP3 on the first sequence and TP1 on the second, the public updates emphasized protection and risk reduction. That is a more responsible takeaway than focusing only on the largest account screenshot.
Fourth, individual proof needs labels. The $11,530.19, $12,259.05, $324.54 and $131.64 displays show what appeared on particular accounts. They do not tell a new reader what balance, leverage or position size to use.
Finally, historical evidence needs a time boundary. The two BUY zones and target levels belong to August 14. Current market conditions can be different, and a past signal should never be mistaken for a current instruction.
What The Day Means Going Forward#
August 14 is best remembered as a clean sequence story: patience around structure, one fully parameterized BUY setup that reported all four fixed targets, then a second BUY setup that reached TP1 and moved to breakeven. The 40-message member response and 10 selected public proof screenshots add depth, but the article does not need inflated trade counts or a universal PnL claim to make the point.
For a reader deciding whether Gold Trader Mo is worth following, the useful test is simple: look for the stated zone, the risk boundary, the target progression, the protection update and the evidence after the move. Then separate a verified public account display from what any new trader should expect.
Want the next free signals and FREE VIP channel access? Message @GTMOBest for the current public channel details. Do not carry August 14 levels into a new session without new evidence, a new risk plan and a clear understanding that trading involves risk.
FAQ#
How many setups were documented on August 14?#
Two parameterized BUY setups were documented: 4350.2-4346 and 4351-4347. The short “Gold buy now” lines immediately before the detailed zones were sequence openers, not additional setups.
What happened on the first BUY sequence?#
The 4350.2-4346 BUY sequence had a 4342 stop and fixed targets at 4352, 4354, 4356 and 4358. The same-day public record reported all four fixed targets complete, with breakeven protection called out after TP3.
What happened on the second BUY sequence?#
The 4351-4347 BUY sequence had a 4342 stop and fixed targets at 4353, 4355, 4357 and 4359. The available evidence shows TP1, partial profit-taking and a move to breakeven; it does not support claiming that all four targets were completed.
How many member feedback messages and screenshots were counted?#
Exactly 40 member feedback messages were counted. The article shows 10 selected public proof screenshots: 6 trading views and 4 member views. These are different counts.
Is the market snapshot a live signal or a guaranteed close?#
No. The market snapshot is historical context. Spot gold remained active beyond the evaluation timestamp, so the report uses an approximate intraday area rather than claiming one universal close. Ask @GTMOBest for current information instead.
Connect with Gold Trader Mo#
Want free signals and FREE VIP channel access? Reach @GTMOBest and ask for the current public channel details. This August 14 report is a past-session record; the next decision should be based on current evidence, current risk and your own account conditions.