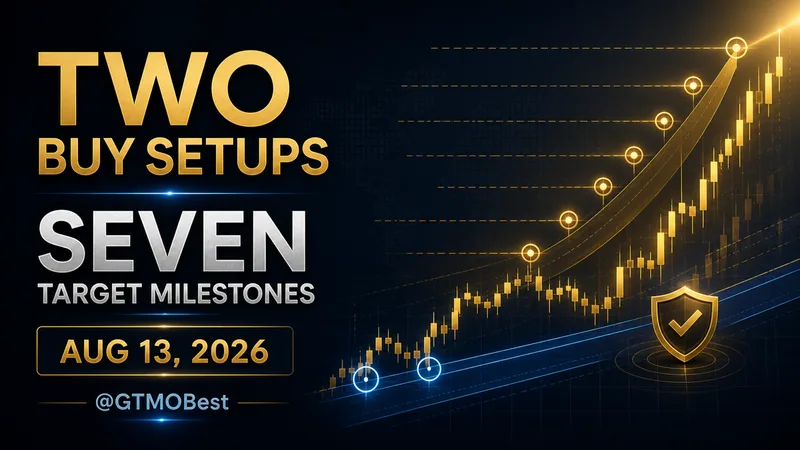
Want free signals and FREE VIP channel access? Message @GTMOBest before you read the next setup. This historical XAUUSD recap shows what the public @GTMO channel record documented on August 13, 2026: two BUY sequences, seven fixed target milestones, disciplined risk protection, and a near-$28K result visible in one account-history screenshot.
Trading involves risk and results may vary; only use capital you can afford to lose. The public Telegram record is available at https://t.me/gtmobest.
The story is not a promise of typical performance and it is not a live instruction. It is a past-session record: what was called publicly, how the move progressed, what members shared afterward, and which details can be checked in the selected proof gallery.
Market Snapshot#
Gold traded through a volatile session, with public spot/CFD references clustering around $4,379–$4,382 and an intraday band of roughly $4,364–$4,450. Provider, contract and session conventions differ, so these figures are context rather than a claim of one universal daily close.
| Reference | August 13 context |
|---|---|
| XAUUSD spot/CFD references | Approximately $4,379–$4,382 |
| Visible intraday range | Approximately $4,364–$4,450 |
| US Dollar Index | Approximately 99.90–99.99 |
| US 10-year yield | Approximately 4.65% |
| Session frame | Historical GMT+7 recap, not a live quote |
The macro backdrop kept the market sensitive to rates, the dollar and the next US data points. A same-day US market summary linked softer producer-price information and easing yield pressure with the day’s gold discussion, while the dollar stayed firm enough to cap some upside. That context helps explain the sharp back-and-forth, but it does not create the trading result. The stronger story is in the public sequence of entries, targets and risk resets.
For additional context, compare this recap with the August 12 gold trading report, the August 11 recap, and the August 10 report.
Why The Tone Changed So Fast#
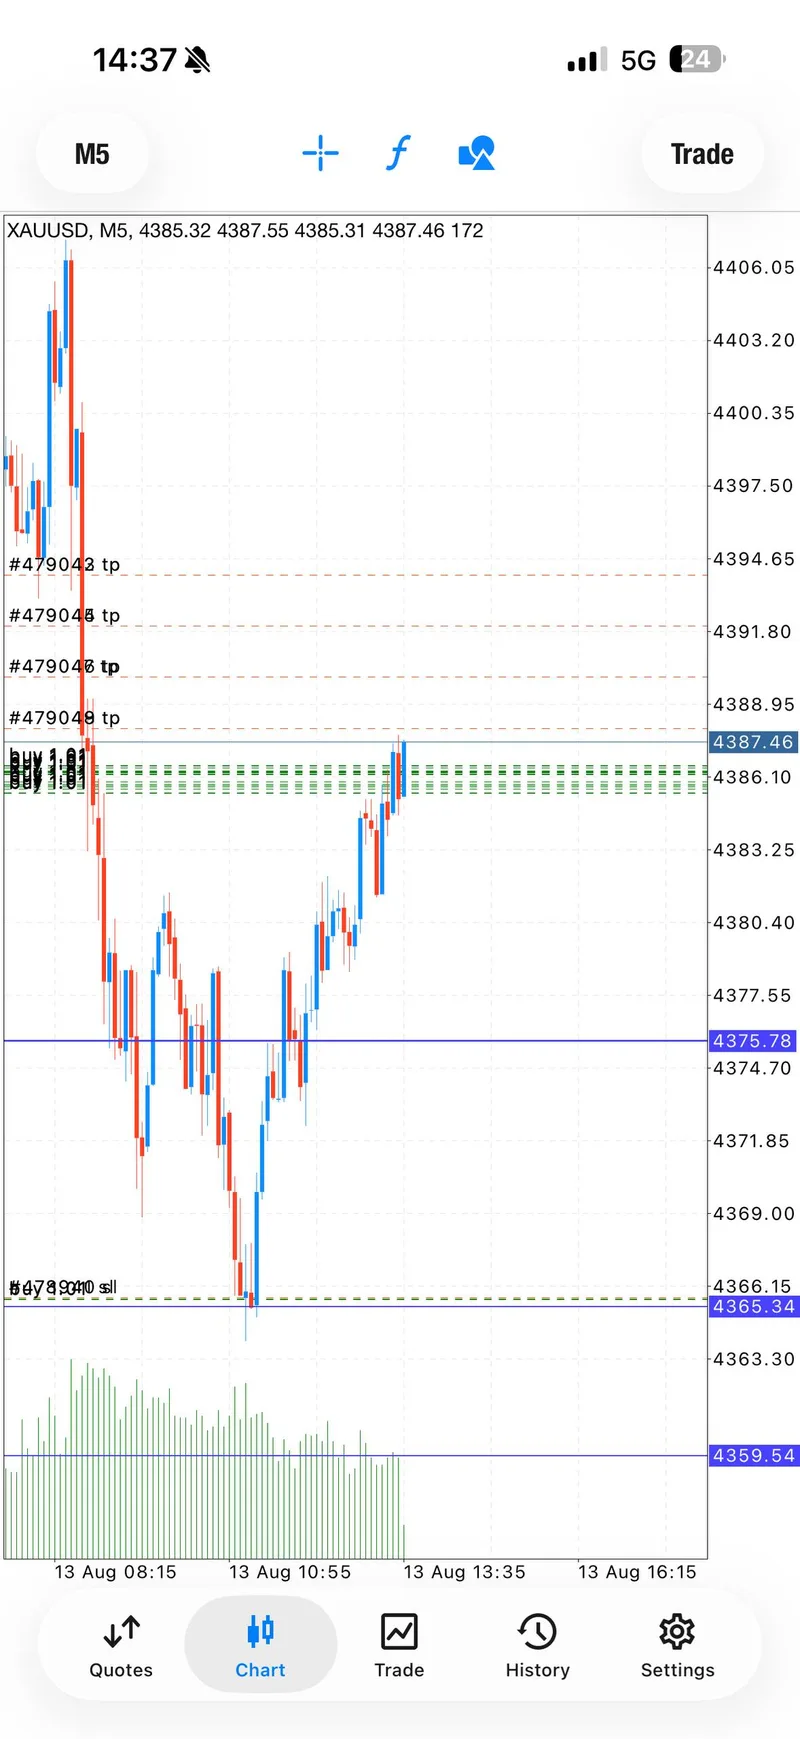
The first public BUY call arrived in the lower 4360s: 4366.4–4363, with a 4359 risk cap and three fixed targets at 4369, 4371 and 4373. Follow-up posts then documented the early target progress, a move to breakeven, and the final target being marked complete. In plain language, the trade story moved from “protect the downside” to “let the position run without the original risk.”
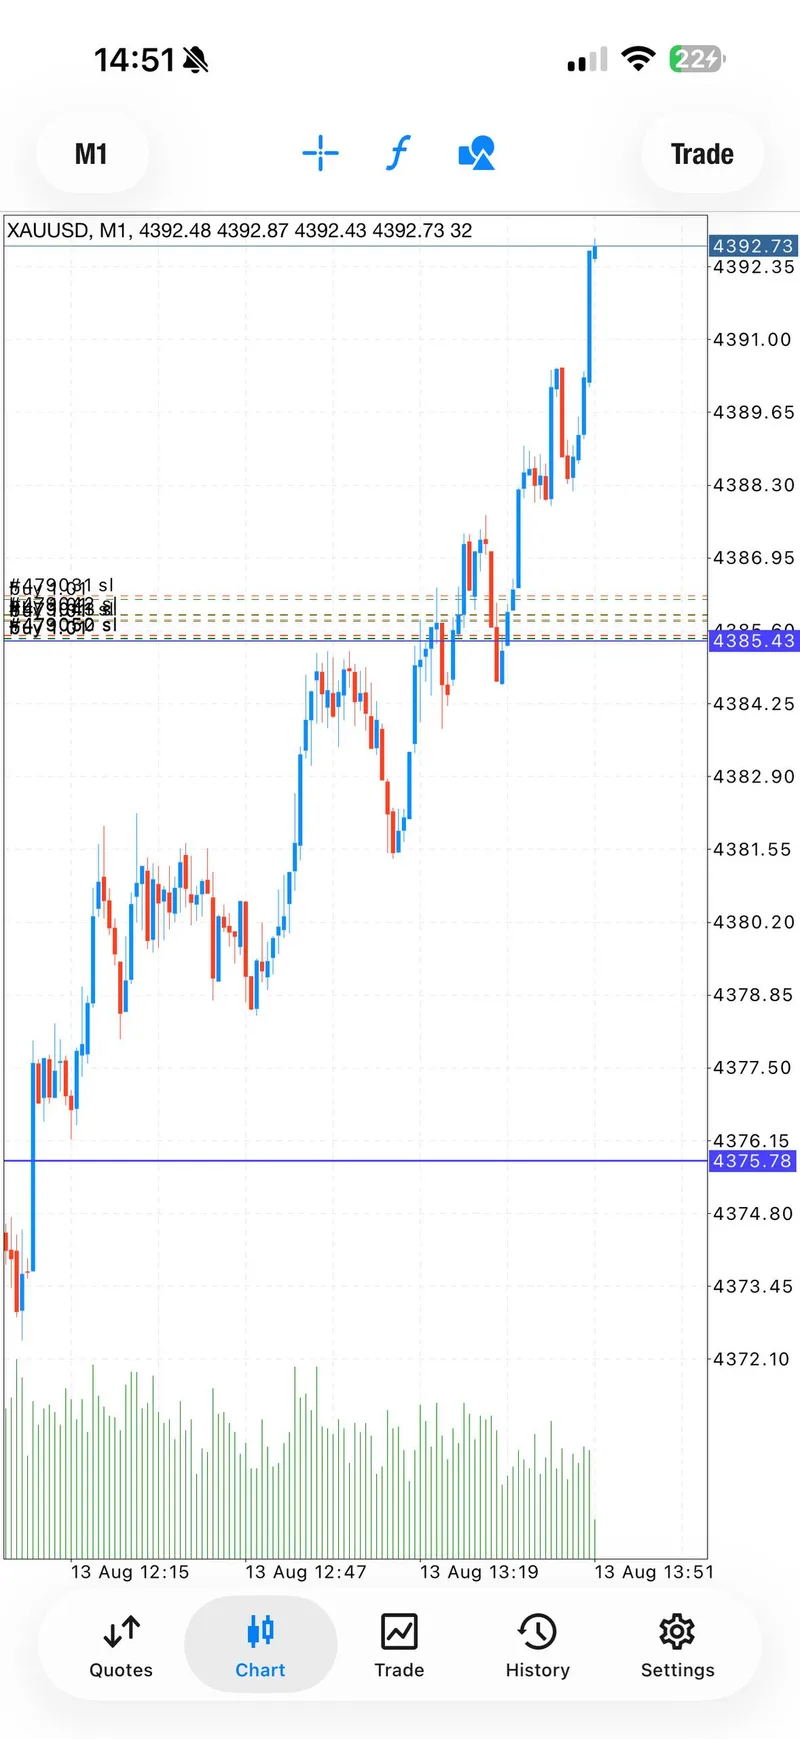
The second sequence came later, around 4386–4383, with a 4379 risk cap and four fixed targets at 4388, 4390, 4392 and 4394. The public record again showed the sequence moving through target areas while the risk was moved toward breakeven. That repetition is the useful editorial point: the day was not built around one lucky screenshot; it was a two-sequence progression with risk protection repeatedly called out.
The channel’s tone also stayed direct when price was already higher. That matters for readers evaluating execution quality. A historical recap can acknowledge the result while still saying that entry price, account size, leverage and position management change the outcome for every trader.
Technical Outlook#
The levels below belong to the August 13 session and should be read as historical evidence, not as a live trading plan.
- The first historical BUY area was 4366.4–4363, with 4359 as the stated risk cap and 4369/4371/4373 as the fixed target ladder.
- The second historical BUY area was 4386–4383, with 4379 as the stated risk cap and 4388/4390/4392/4394 as the fixed target ladder.
- The market context around 4380 and 4350 acted as broader reference zones in the same-day discussion, while 4441–4450 appeared as an upper contextual resistance area.
- The public charts showed the move advancing through the target ladder rather than a single instant exit. Breakeven updates were part of the documented risk process.
That structure gives the recap its shape: lower entry zone, protection, staged targets, then a higher second sequence with the same emphasis on protecting open profit. It is a framework for reviewing the past session, not permission to copy the levels into a new market.
Trading Signals#
Signal 1 — Lower-zone BUY sequence#
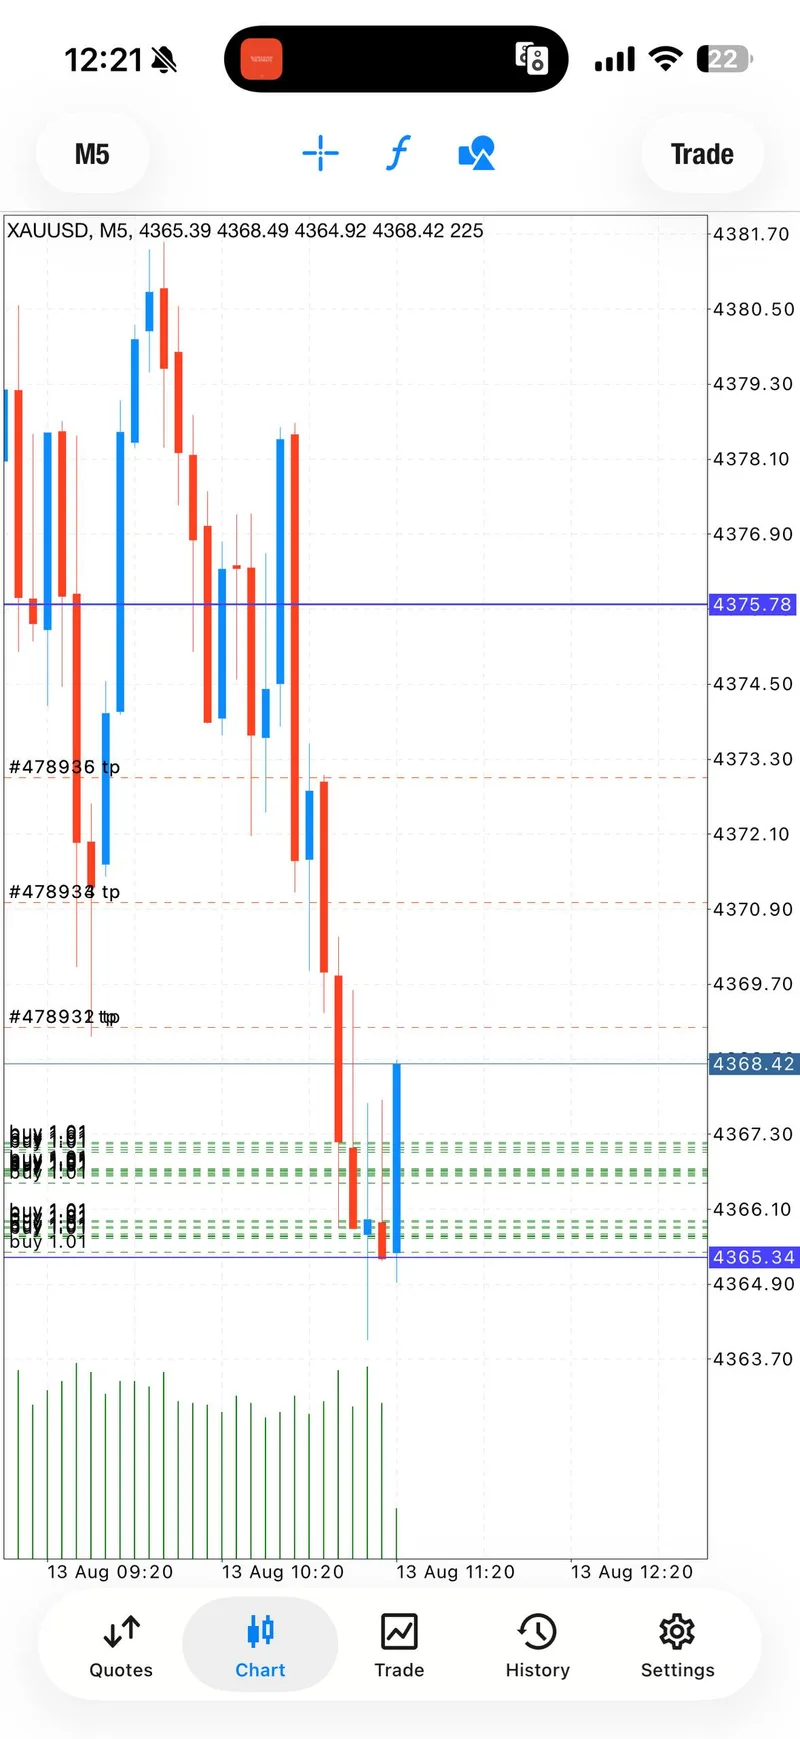
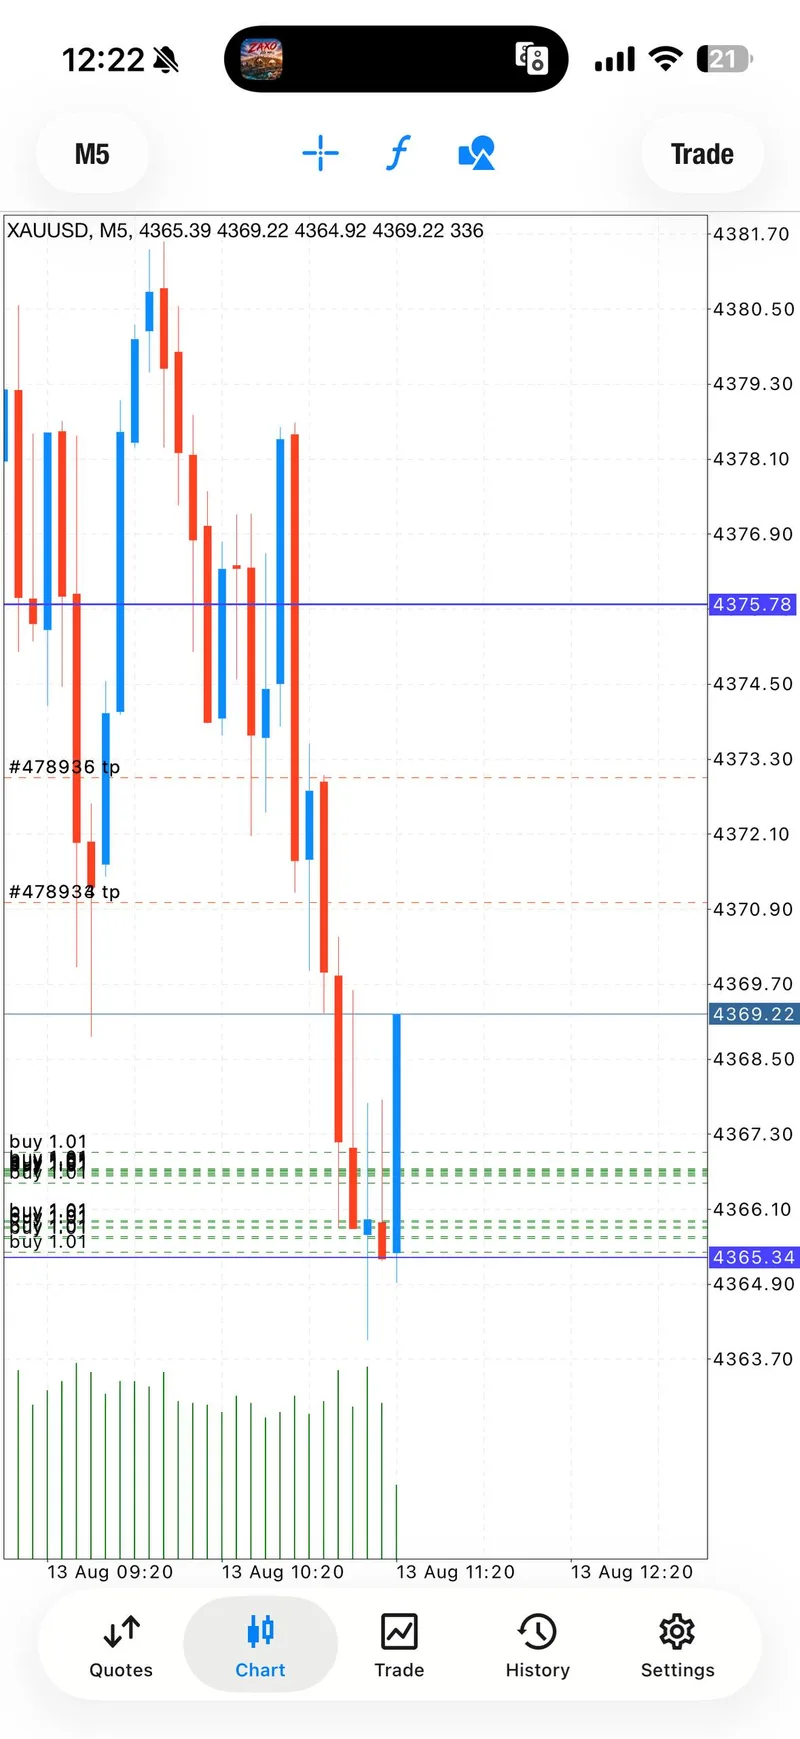
The public call placed the historical BUY area at 4366.4–4363. The stated risk cap was 4359. The fixed target ladder was 4369, 4371 and 4373, with the record later showing all three fixed targets marked complete.
The follow-up sequence matters more than the initial line. The public record showed instant progress, then the first target, the second target, and a breakeven instruction before the third target was reported. That is the clearest same-day example of a risk-first transition: once price moved, the original downside was no longer treated as the only plan.
Signal 2 — Higher-zone BUY sequence#
The second historical BUY area was 4386–4383, with a 4379 risk cap. The fixed targets were 4388, 4390, 4392 and 4394. The accompanying chart and follow-up record showed the move progressing through the ladder, with breakeven protection added before the higher targets were marked.
This second sequence is why the day’s recap is stronger than a one-trade headline. The public record described four fixed target milestones on the later BUY, after three fixed milestones on the earlier one. Together, those two sequences account for seven fixed target milestones reported during the session.
The lines above describe August 13 only. Anyone looking for current market access should use the current public channel and ask @GTMOBest for free signals and FREE VIP channel access.
Signal Performance Breakdown#
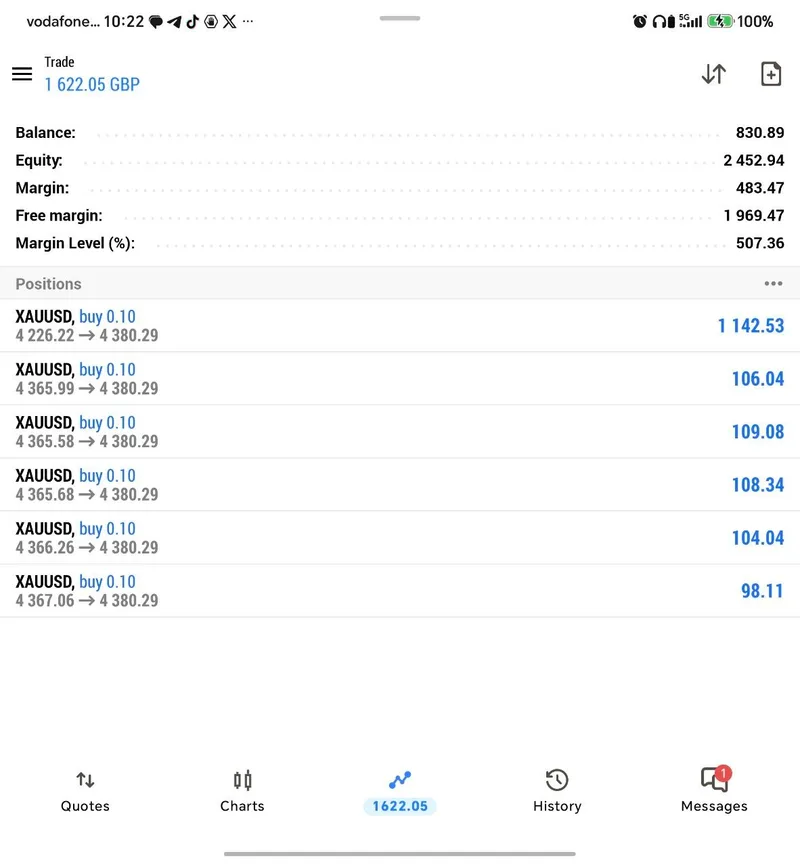
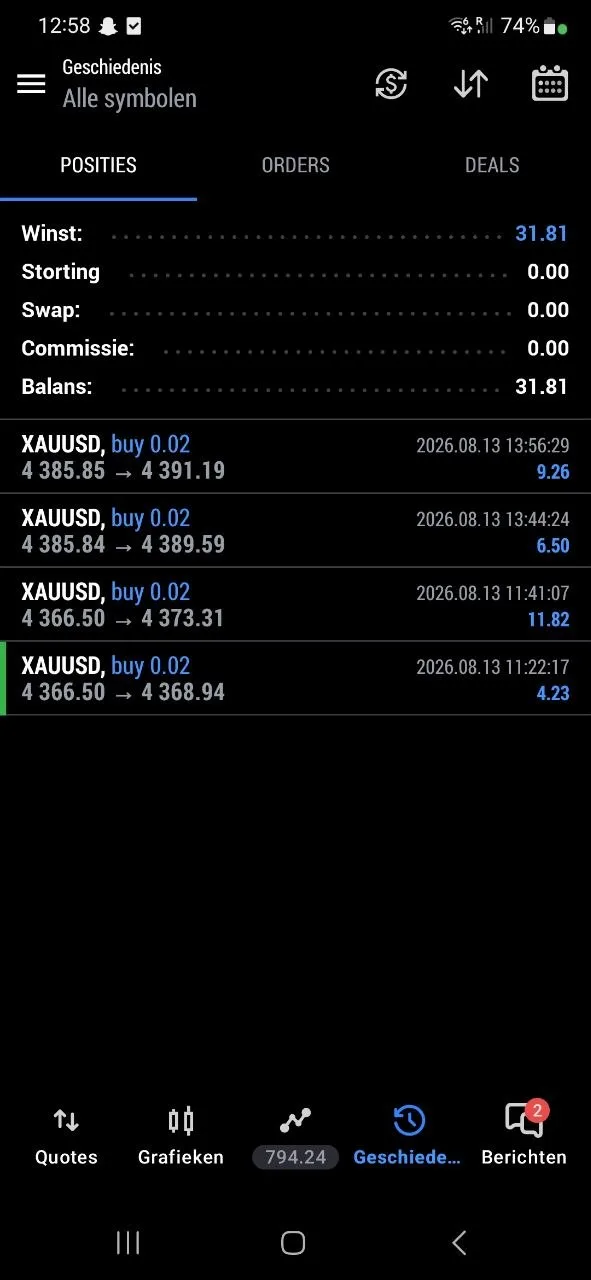
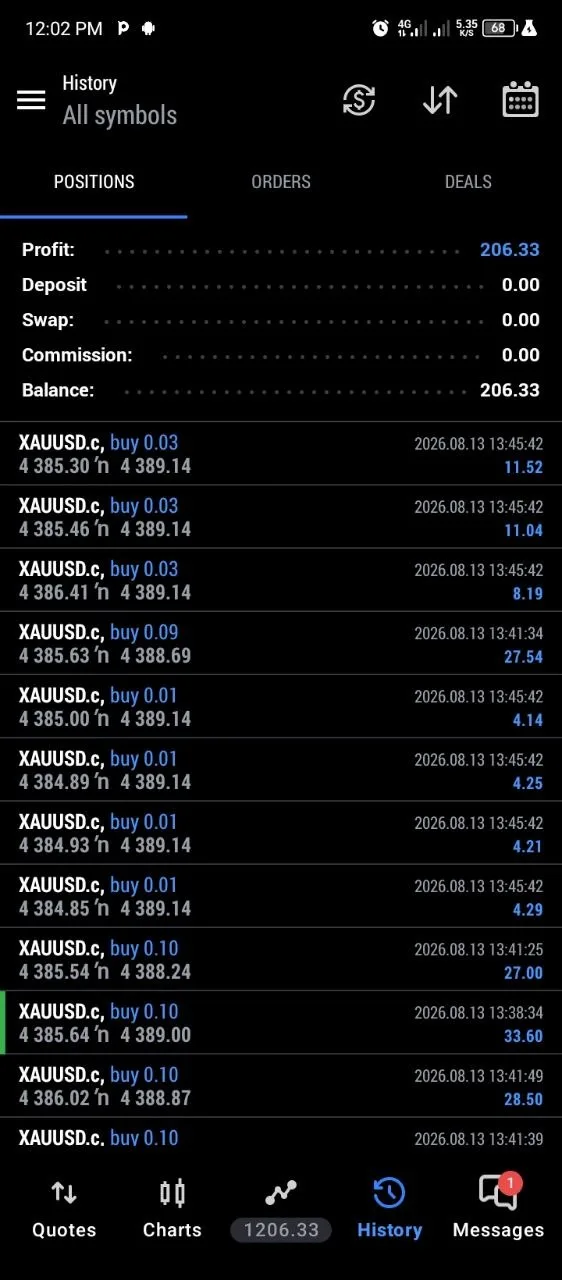
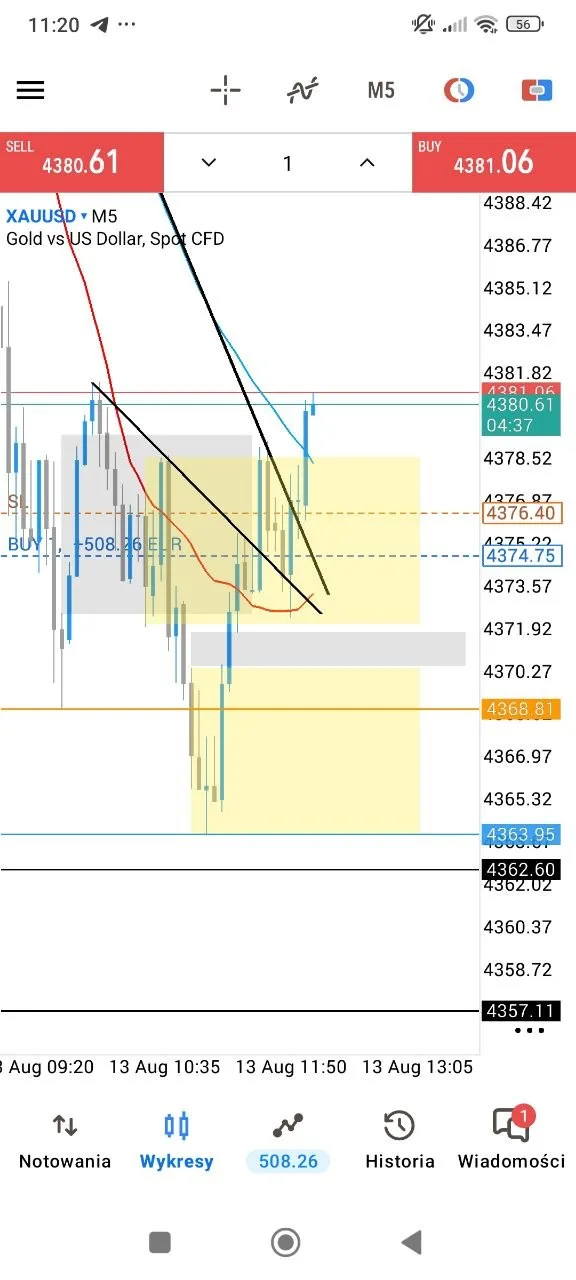
The same-day public record contains exactly 33 member feedback messages. That is the total feedback-message count, not the number of screenshots shown in this article.
The gallery contains 11 selected public proof screenshots:
- 7 trading-sequence screenshots showing the calls, chart progression or account-history context.
- 4 member screenshots showing community responses or individual account views.
Those counts are deliberately kept separate. A screenshot is not automatically a new feedback message, and an account-history image is not a promise of the same result for every reader.
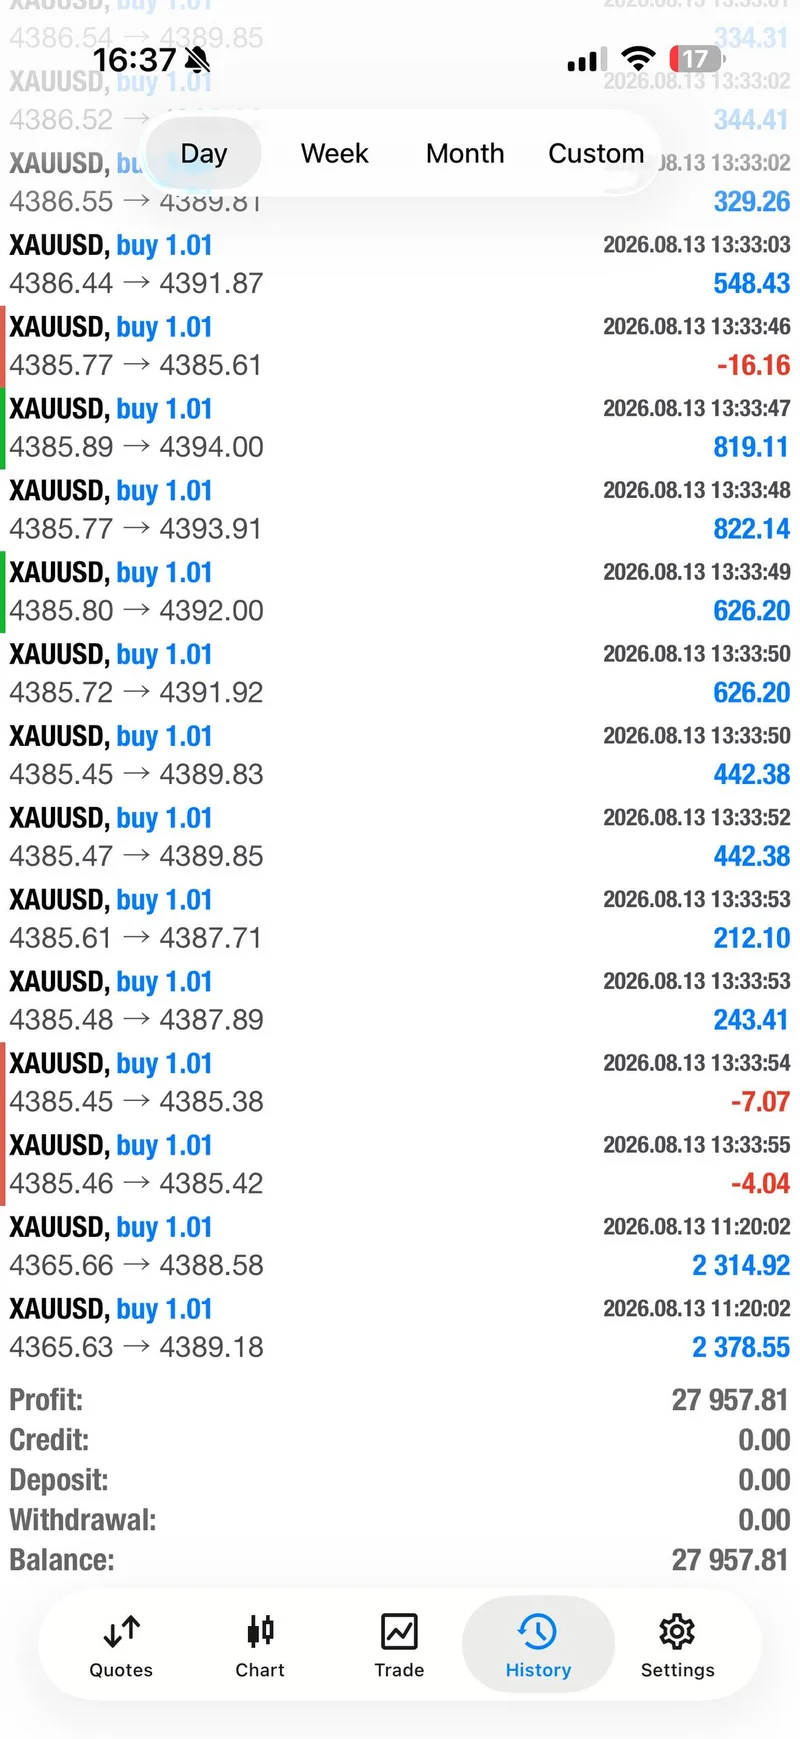
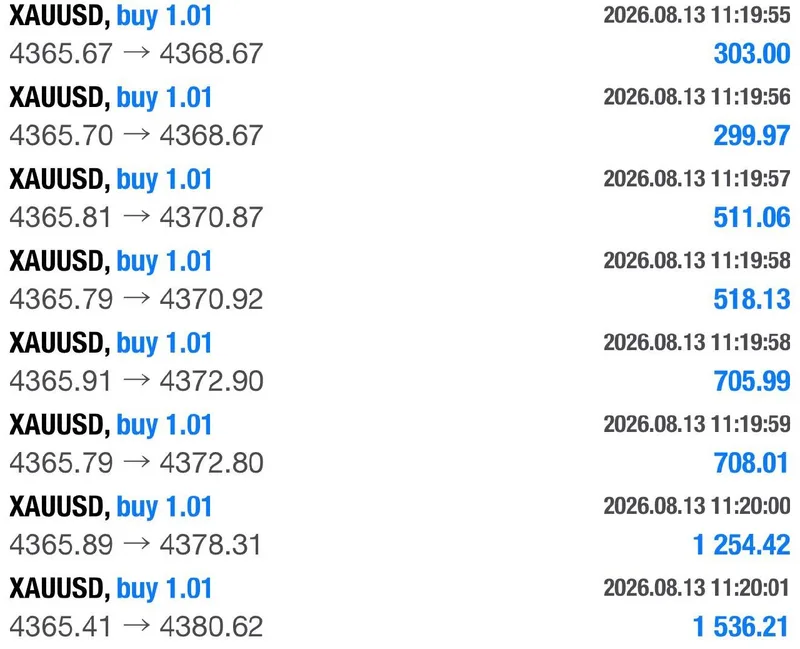
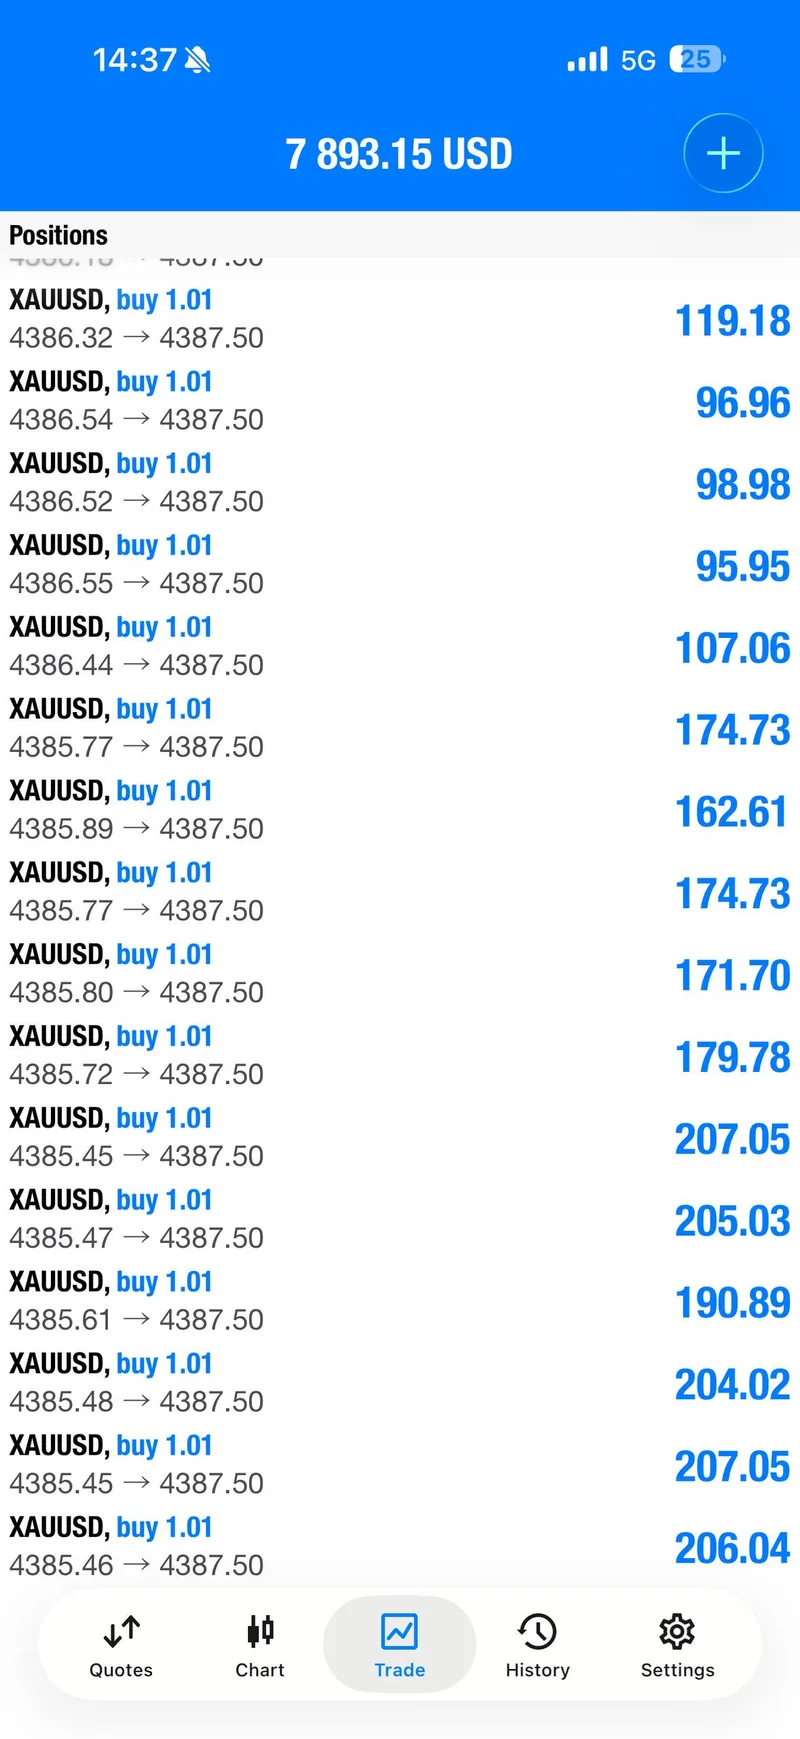
The strongest result beat is a public end-of-day history screenshot showing $27,957.81 profit for the displayed period. The channel message described the result as almost $28,000 closed on the day, and the visible history image is consistent with that account-specific claim. It is useful proof of what was displayed publicly; it is not a typical-outcome claim, a guarantee, or a result that can be transferred to another account.
Member feedback added a human layer to the record. Public replies included thanks, “closed with profits” updates, and individual amounts such as £275, £155, €81 and $90. Those replies show that members were actively following the session, but they do not establish a statistically representative return. The selected gallery keeps that distinction visible.
Execution Lessons#
First, staged targets made the sequence readable. The two calls gave the market a set of checkpoints instead of forcing the audience to judge one all-or-nothing exit.
Second, breakeven was part of the documented workflow. The updates repeatedly moved the conversation from initial risk toward protected open profit. That is a more responsible lesson than focusing only on the final screenshot.
Third, account-specific evidence needs labels. The near-$28K history view and the smaller member-account screenshots show what appeared on individual accounts. They do not tell a new reader what position size, leverage, balance or broker conditions to use.
Fourth, a historical win still needs boundaries. The session record supports two BUY sequences and seven fixed target milestones. It does not support a claim that every follower earned the same amount or that the same levels remain valid now.
What The Day Means Going Forward#
August 13 is best remembered as a proof-led conversion story: the public @GTMO record showed two clearly parameterized BUY sequences, a visible progression through seven fixed targets, and repeated risk-protection updates. The near-$28K screenshot gives the article a strong result beat, while the 33-message feedback count and 11-image gallery show that the day was also followed by an active community.
The practical takeaway is simple: judge a trading recap by the complete path. Look for the stated zone, the risk boundary, the target progression, the protection update and the evidence after the move. Then separate a verified public account result from what a new trader should expect.
For another historical comparison, the recent Gold Trader Mo report archive keeps the session-by-session record in one place. For today’s market, do not reuse yesterday’s levels as live instructions. Ask @GTMOBest for the current free signals and FREE VIP channel access.
FAQ#
How many setups were documented on August 13?
Two public BUY sequences were documented: the lower 4366.4–4363 area and the later 4386–4383 area.
How many targets were reported?
Seven fixed target milestones were reported across the two sequences: three on the first call and four on the second. An “open” continuation reference is not counted as a fixed target.
How many member feedback messages were counted?
Exactly 33 member feedback messages were counted for the same-day record. The article shows 11 selected screenshots, which is a separate count.
Is the near-$28K result typical?
No. One public account-history screenshot showed $27,957.81 for the displayed period. It is account-specific evidence, not a typical-result claim or guarantee.
Can I use these levels as a live signal?
No. The levels are historical August 13 evidence. Market conditions, execution and risk are different in every session. Request current information from @GTMOBest instead.
Connect with Gold Trader Mo#
Want free signals and FREE VIP channel access? Reach @GTMOBest and ask for the current public channel details. The August 13 recap is a past-session record; the next decision should be based on current evidence, current risk and your own account conditions.