
Market Snapshot#
Monday did not go in a straight line, and Mo said so in public. His first gold buy on the @GTMO channel reported two quick targets twice. Then the market turned, the buys were closed, and at 17:51 Vietnam time Mo told the channel, “I’m still down $26k”, posting a history screenshot that showed the loss. He did not delete the post or go quiet. He explained the fake breakout, stayed with a second sell after widening its stop to 4178, and that sell went on to report 100+ pips and a full recovery, then TP4 with 130+ pips. At 22:03 he posted “300+ PIPS TRADE CLOSED ALL NOW!!” on the second sell.
These are Mo’s own reported results from the public record. The screenshots show the drawdown and the later profitable sell positions. They do not prove an audited net figure for the day, and individual members finished in different places. To follow the next public update or ask about free signal access, message @GTMOBest. This recap looks back at Monday’s published decisions; it is not a new instruction to trade.
| Observation | October 19 reading |
|---|---|
| Instrument | OANDA XAUUSD, Gold Spot / U.S. Dollar |
| Observed spot | $4,146.505 per troy ounce |
| As of | 22:00 Vietnam time (UTC+7), October 19, 2026 |
| Session status | Market open; intraday snapshot, not a final close |
The observation is the latest forming daily candle on TradingView / OANDA, read at 22:00:56 Vietnam time. At that point gold was trading well below both of the day’s public sell zones.
Why The Tone Changed So Fast#
The day opened with momentum. At 15:02 Mo published a buy zone, and by 15:09 he reported “2 TP’s in 2 Minutes!” When price came back to the entry, he told readers who had already closed that they could take a second round. He also told anyone still holding the first entry not to add more. That second round reported TP1 and TP2 again by 15:14.
Then the trade stalled. At 15:51 Mo said price was at the bottom of the zone and the last entries were in. At 16:32 he moved the buy stop from 4166 to 4164. By 17:11 he joked that he had been “2 hours in that trade that hit 4 TP’s in 10 minutes.” At 17:42, with volume rising, he closed the buys and switched direction.
At 18:17 Mo explained what happened in his own words: he had traded the trendline, it looked like it broke downwards, so he closed the buys and sold the retest. “I simply got manipulated by a fake breakout, now I’m going to stick to my SL and either I learn or earn.” That candid note is the turning point of the day. It describes a reversal on the chart, not a reaction to a news event.
Technical Outlook#
All three of Monday’s published plans sat in a narrow band:
- Buy: zone 4174.7–4170, stop 4166 (later moved to 4164), targets 4177 to 4185.
- First sell: zone 4167.3–4171, stop 4175, targets 4165 to 4159, then an open target.
- Second sell: zone 4168.3–4172, stop 4176 (later moved to 4178), targets 4166 to 4160, then an open target.
These are historical plan levels from the public signals, not market quotes and not current recommendations. Mo’s fake-breakout comment refers to his own trendline drawing.
The 22:00 reading of $4,146.505 puts gold more than 20 dollars below the second sell zone. That supports the direction of the later updates, but it does not show an individual fill or exit. As historical reference points, the roughly 4167–4175 band where all three of Monday’s plans sat and the 4146 area where gold traded at 22:00 are the two levels worth noting. For a new session, build a fresh plan rather than treating Monday’s zones as live support or resistance. For the week’s broader scenarios, see the weekly gold forecast for October 19–23.
Trading Signals#
Three public setups, kept in order#
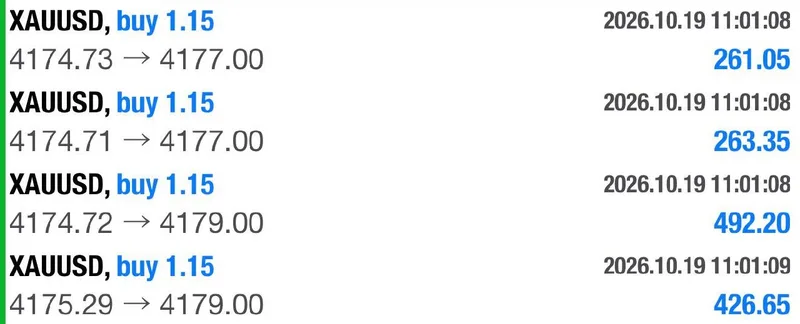
Monday had three fully specified public setups. The short “Gold buy now” and “Gold sell now” alerts belong to the plans that follow them; they are not extra trades. All times are Vietnam time, UTC+7, on October 19.
| Time | Public update | What it shows |
|---|---|---|
| 15:02 | Buy plan: 4174.7–4170, stop 4166 | Setup 1 |
| 15:09 | “2 TP’s in 2 Minutes!” | TP1 and TP2 reported |
| 15:10–15:14 | Second round from the entry; TP1 and TP2 again | Re-entry for those who had closed |
| 15:51 | Last entries placed at the bottom of the zone | Exposure added |
| 16:32 | Buy stop moved to 4164 | Wider stop |
| 17:42 | “I’m closing the trade now” | Buys closed manually |
| 17:44 | First sell plan: 4167.3–4171, stop 4175 | Setup 2 |
| 17:46–17:50 | TP1 and TP2, “Instant 45+ pips”, then breakeven hit | Setup 2 out at breakeven |
| 17:51 | “I’m still down $26k” with screenshot | Drawdown shown publicly |
| 17:54 | Second sell plan: 4168.3–4172, stop 4176 | Setup 3 |
| 18:13 | “Last adjustment for today, move SL to 4178” | Wider stop |
| 18:17 | Fake-breakout explanation | Reasoning shared |
| 18:56 | Half profits taken, breakeven set | Risk reduced |
| 18:59–19:01 | “100+ pips” full-recovery post, then TP4 with 130+ pips | Reported recovery |
| 22:02–22:03 | “Nobody recovers better then me!”, then 300+ pips, all closed | Final reported exit |
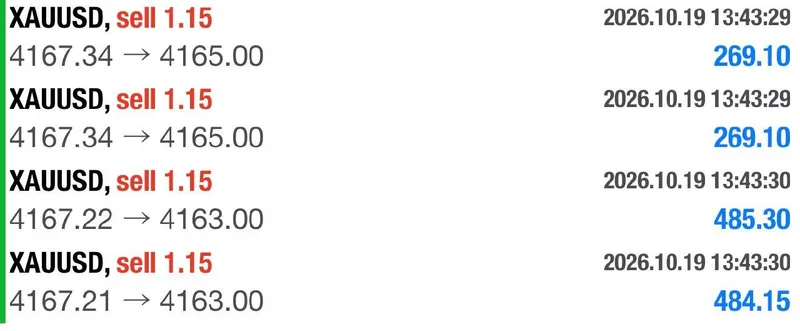
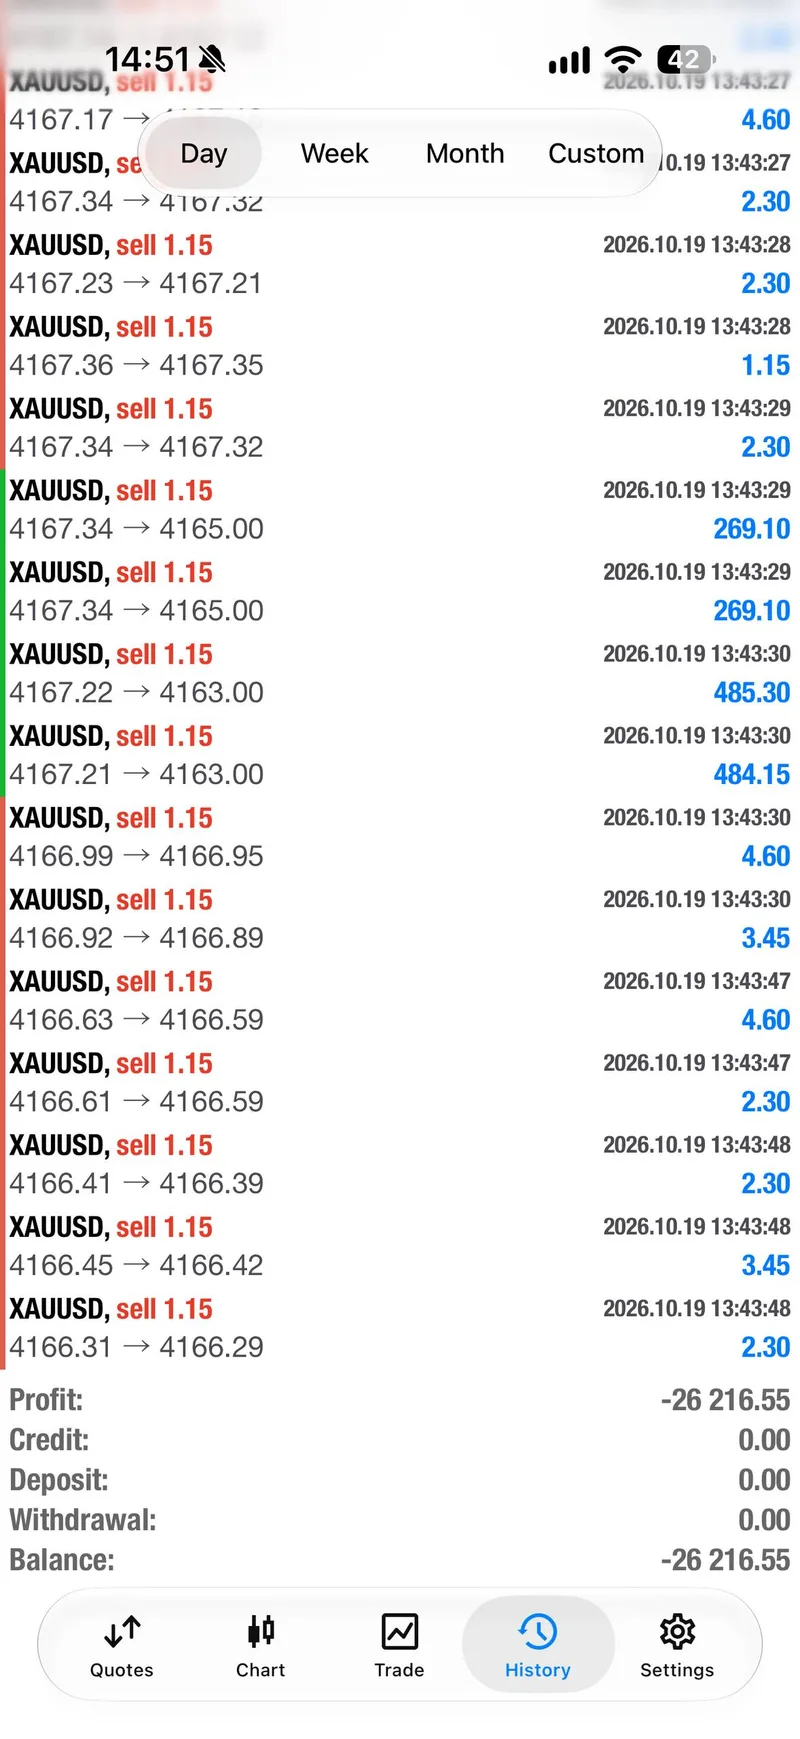
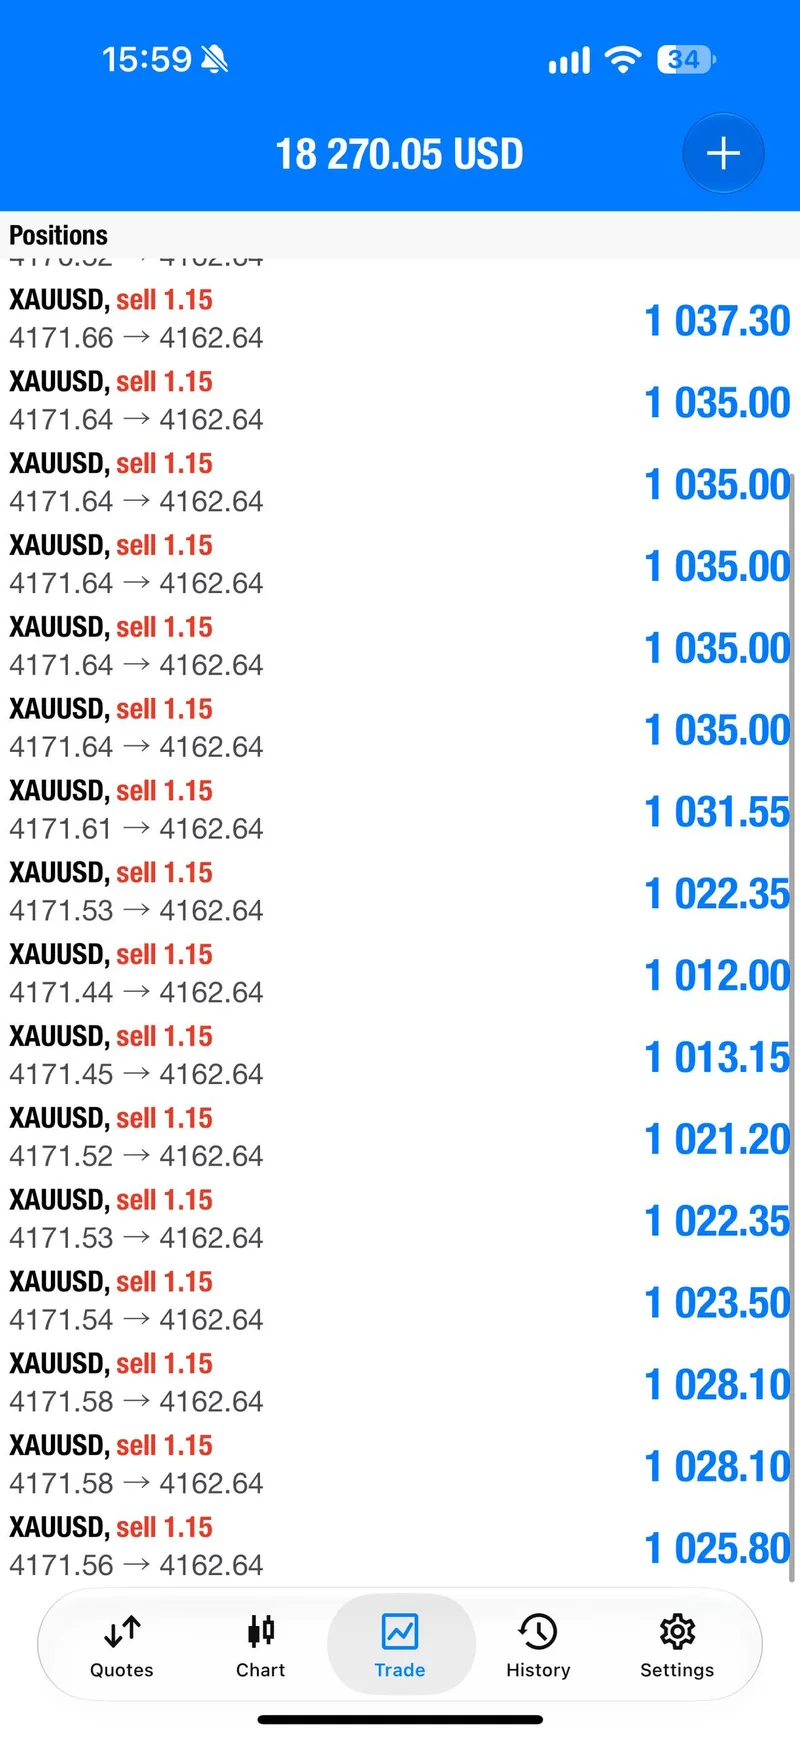
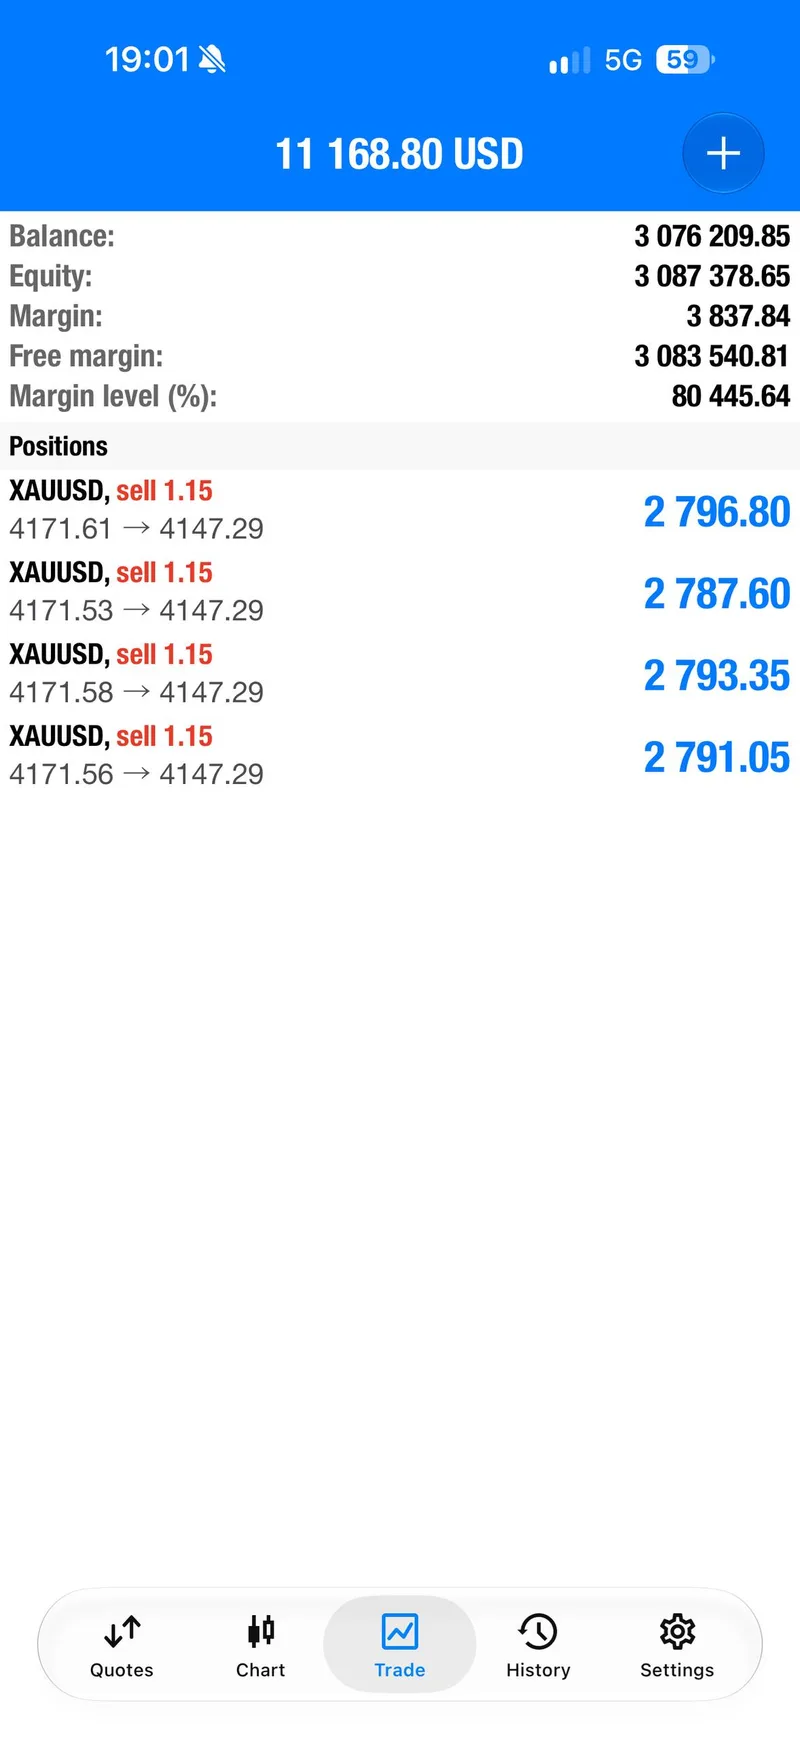
The selected screenshots below follow the same order: early targets, the first sell, the drawdown, and the second sell as it moved into profit.
Signal Performance Breakdown#
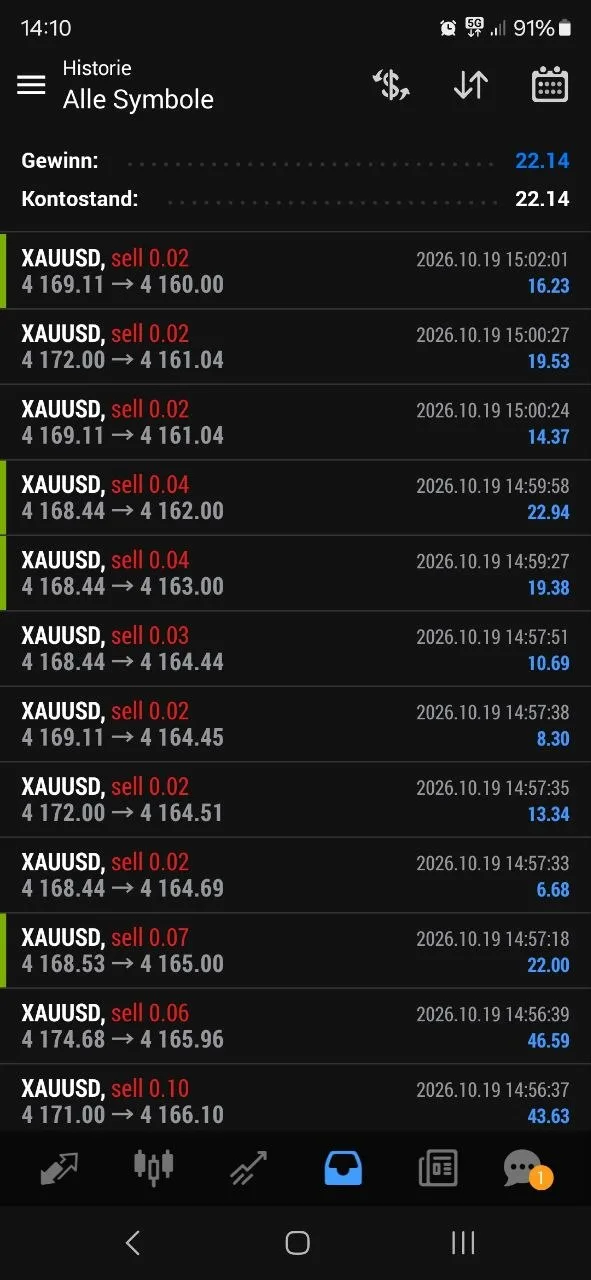
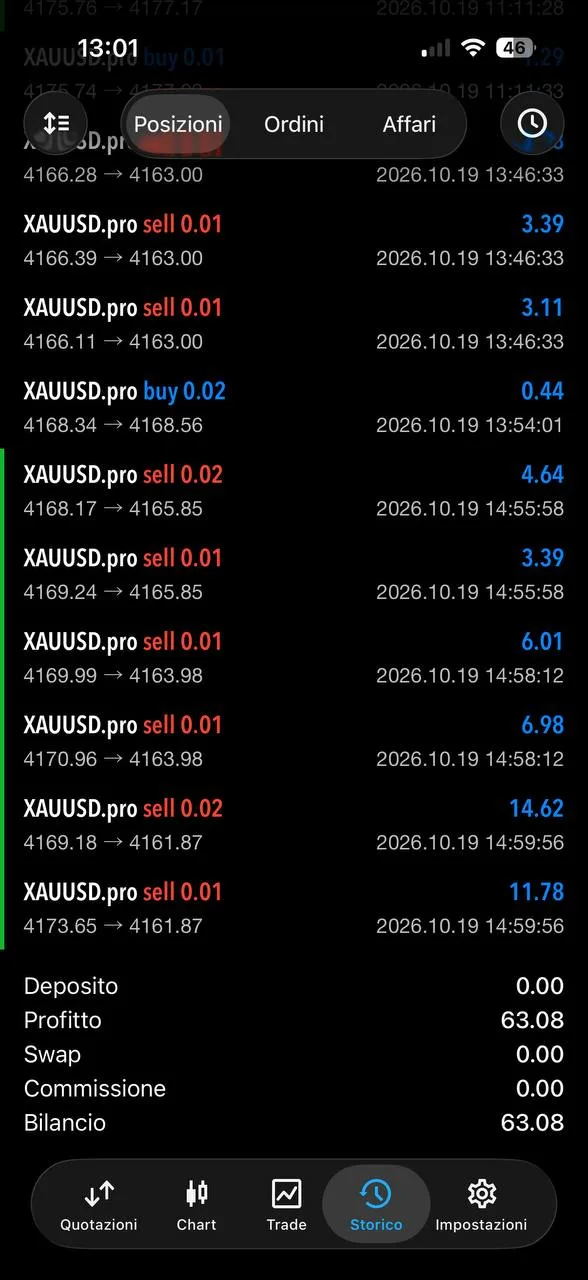
Setup 1, the buy: TP1 and TP2 were reported twice, once on the first entry and once on the second round. The remaining buys were closed manually at 17:42. Mo did not post their exit price, and the drawdown that followed makes clear this part of the day lost money.
Setup 2, the first sell: TP1 and TP2 were reported within about two minutes, followed by “Instant 45+ pips.” Mo then set breakeven, and the rest of that trade closed at breakeven at 17:50.
The drawdown: At 17:51 Mo posted “I’m still down $26k”. The day-history screenshot with it displays a total of -26 216.55. No currency is shown next to that total; the dollar figure is Mo’s own statement.
Setup 3, the second sell: This is the trade that changed the day. At 18:38 Mo wrote, “Only a big waterfall will save us today,” meaning a sharp drop that would carry the sell to its targets. The drop arrived at 18:55, marked by Mo’s “LETS GOOOO” update. Mo took half profits at 18:56 and set breakeven. At 18:59 he posted “100+ pips” with “fully recovery,” and at 19:01 he reported TP4 with 130+ pips. At 22:02 he replied to his own $26k post with “Nobody recovers better then me!” One screenshot in that reply shows four remaining sells in floating profit. A minute later he posted “300+ PIPS TRADE CLOSED ALL NOW!!”
The day ended with a reported full recovery led by the second sell, with 300+ pips reported on that trade. The pip figures and the recovery are Mo’s claims. The screenshots back up the loss and the later profitable sell positions, but they do not reconcile into an audited net result for the day.
What members shared publicly#
The public channel had 10 member messages on Monday, and they did not all say the same thing:
- Martin: “Fully recovered. And 2 runners still open.”
- Haroon Dhanyal: “fully recovered.”
- Gus: “low risk still +5,8% thanks for your good signals.”
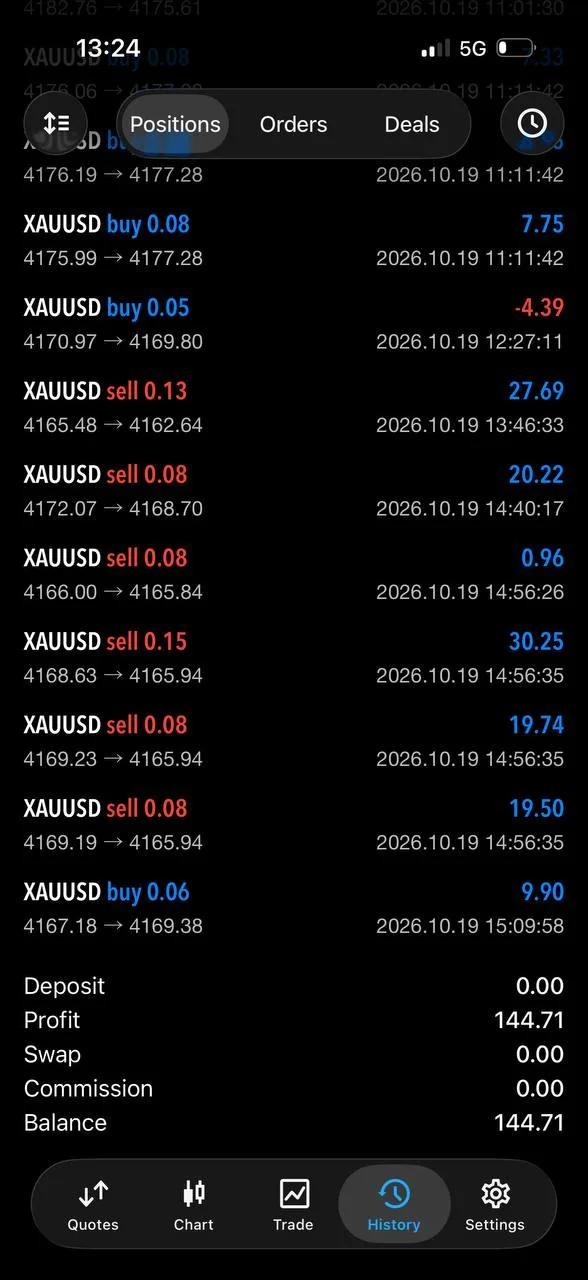
- Callum shared “£144” with a history screenshot. It displays Profit 144.71, including a visible losing buy row.
- Rdubs: “Was £600 down, now only £130 down, closed a bit too much when you said take half profits, but happy enough with the outcome.”
Rdubs’s message is a useful reminder: the same signals did not produce the same result for everyone. Timing, position size and how much each member closed at “take half” all made a difference. The galleries show 8 selected screenshots from the day’s posts, not every image shared. Members’ own figures are personal reports, not verified returns.
For days that ended differently, compare the October 16 gold report and the October 15 gold report.
Execution Lessons#
A quick target is not the end of the risk. Setup 1 reported four targets across two rounds in minutes, yet the same buy idea later turned into the day’s main loss. Re-entering at the original level resets your risk, even right after a win.
Widening a stop increases what you can lose. Mo moved the buy stop from 4166 to 4164 and the second sell’s stop from 4176 to 4178. On Monday the second sell recovered. That outcome does not make a wider stop a good rule. Decide your maximum loss before you enter, and stick to it unless you have a clear plan to change it.
Size decides whether a whipsaw is survivable. Mo’s screenshots show many separate entries on each setup. A follower with smaller, fixed risk could take the same sequence without the same strain; a follower who sized up after the early wins could not. Choose your size for the worst case, not the first target.
Reporting a loss in real time is a trust signal, not a guarantee. Mo posted the drawdown as it happened and explained the fake breakout before the recovery came. That transparency lets readers judge the decision process. It does not promise the next whipsaw will recover.
What The Day Means Going Forward#
Monday showed the full range of a trading day: fast early targets, a reversal that hurt, a loss posted in public, and a second sell that Mo reported as a full recovery and a 300+ pip exit. The useful thing to keep is not the final pip count. It is how the decisions were explained while the outcome was still unknown.
Before the next session, write down your own maximum loss per trade, how you will handle a second-round entry, and when you will take partial profit. Then follow how the next public setup is explained and managed on @GTMO, rather than chasing Monday’s levels. You can also review a four-target sell day in the October 14 gold report.
FAQ#
Where was gold trading when this report was prepared?#
OANDA XAUUSD’s latest forming daily candle was observed at $4,146.505 per troy ounce at 22:00 Vietnam time on October 19, 2026. The market was open. This is an intraday observation, not a finalized close or an official gold fix.
Did Mo lose money on October 19?#
Yes, during the session. After the first buy reversed, Mo posted “I’m still down $26k” at 17:51 with a screenshot showing a day-history total of -26 216.55. He later reported a full recovery through the second sell. The public record does not include an audited net figure for the whole day.
What does “300+ pips” refer to?#
It is Mo’s closing update on the second sell, posted at 22:03 Vietnam time. It is the trade’s reported pip result, not a dollar profit and not an outcome every member received.
Did every member recover?#
No. Several members wrote “fully recovered” or shared gains. Rdubs reported being £130 down after starting £600 down. Results depended on each person’s entries, size and exits.
How can I ask about free signals and access?#
Follow the public @GTMO channel, then contact @GTMOBest for the current free-access steps and support. Confirm any eligibility or account requirements directly before committing funds.
Connect with Gold Trader Mo#
Read every daily public recap from Gold Trader Mo and compare the plan, the management and the outcome for yourself, including the days that do not start well. To follow upcoming public gold updates or ask about free signal access, message @GTMOBest.
Risk disclaimer: This report is for education and historical commentary, not personalized financial advice or a live trade instruction. Gold and leveraged trading involve substantial risk, and you can lose more than you expect when a market reverses quickly. Past performance and reported results from Mo or members do not guarantee future returns. Use your own risk limits and verify access conditions before opening or funding an account.