
March 27, 2026 finished as a real GTMO win day inside a verified correction tape. XAUUSD closed at $4,417.45 (+0.28%) while DXY held at 100.19 (+0.04%), the US 10Y settled at 4.438% (+0.014), WTI jumped to $99.64 (+5.46%), and VIX surged to 31.05 (+13.16%). The Fed stayed on hold at 3.50%-3.75% unchanged, which left traders balancing safe-haven demand, inflation pressure, and a market still sensitive to every headline tied to energy risk.
The macro mix now reads cleanly: gold was in Correction, bearish short-term within a broader bull cycle. Hormuz tensions created the energy shock, oil carried that stress into inflation expectations, and the first wave of safe-haven demand rotated into the US dollar instead of gold. That backdrop explains why the session opened with clean sell pressure, then later produced a tradeable rebound once the downside move had already done its work.
Market Snapshot#
March 27 traded like a headline-sensitive gold session where a firm dollar and higher yields created pressure, but not enough to stop clean execution windows from opening. XAUUSD still closed at $4,417.45 (+0.28%) even as DXY held at 100.19 (+0.04%), the US 10Y stayed elevated at 4.438% (+0.014), WTI traded at $99.64 (+5.46%), VIX spiked to 31.05 (+13.16%), and the Fed range remained 3.50%-3.75% unchanged. Those verified inputs explain why the room had to stay flexible through a volatile correction session.
| Metric | Value | Change | Read |
|---|---|---|---|
| XAUUSD close | $4,417.45 | +0.28% | Green close, but still inside a short-term correction regime |
| Fed funds | 3.50%-3.75% | Unchanged | The Fed stayed on hold while inflation pressure stayed in the conversation |
| DXY | 100.19 | +0.04% | Safe-haven demand leaned toward the US dollar first |
| US 10Y yield | 4.438% | +0.014 | Higher yields kept pressure on non-yielding assets |
| WTI crude | $99.64 | +5.46% | Hormuz tensions drove an energy shock through oil |
| VIX | 31.05 | +13.16% | Volatility above 31 confirmed a real fear bid in the tape |
| Gold regime | Correction | Bearish short-term within broader bull cycle | Tactical tone stayed defensive even with the bigger bull trend intact |
The verified macro picture is sharper now. Oil spiked because Hormuz tensions reintroduced an energy-shock narrative, the Fed did not give traders a dovish escape hatch, and the volatility jump above 31 confirmed that fear was real rather than cosmetic. In that setting, safe-haven demand shifted toward the US dollar first, which is why March 27 rewarded disciplined downside execution before the late rebound. The nearby weekly gold forecast for March 23-27, 2026 already framed this kind of environment as one where traders had to respect fast intraday pivots instead of marrying one direction all day.
Why The Tone Changed So Fast#
Energy shock hit inflation expectations first#
WTI at $99.64 (+5.46%) told the macro story before gold finished writing its own. Hormuz tensions pushed an energy shock back into the session, and that matters because higher oil revives energy-driven inflation pressure at exactly the moment when the Fed is still on hold. Gold can benefit from fear, but it struggles when the market decides the first safe-haven destination is the dollar and not bullion.
Dollar demand owned the opening tone#
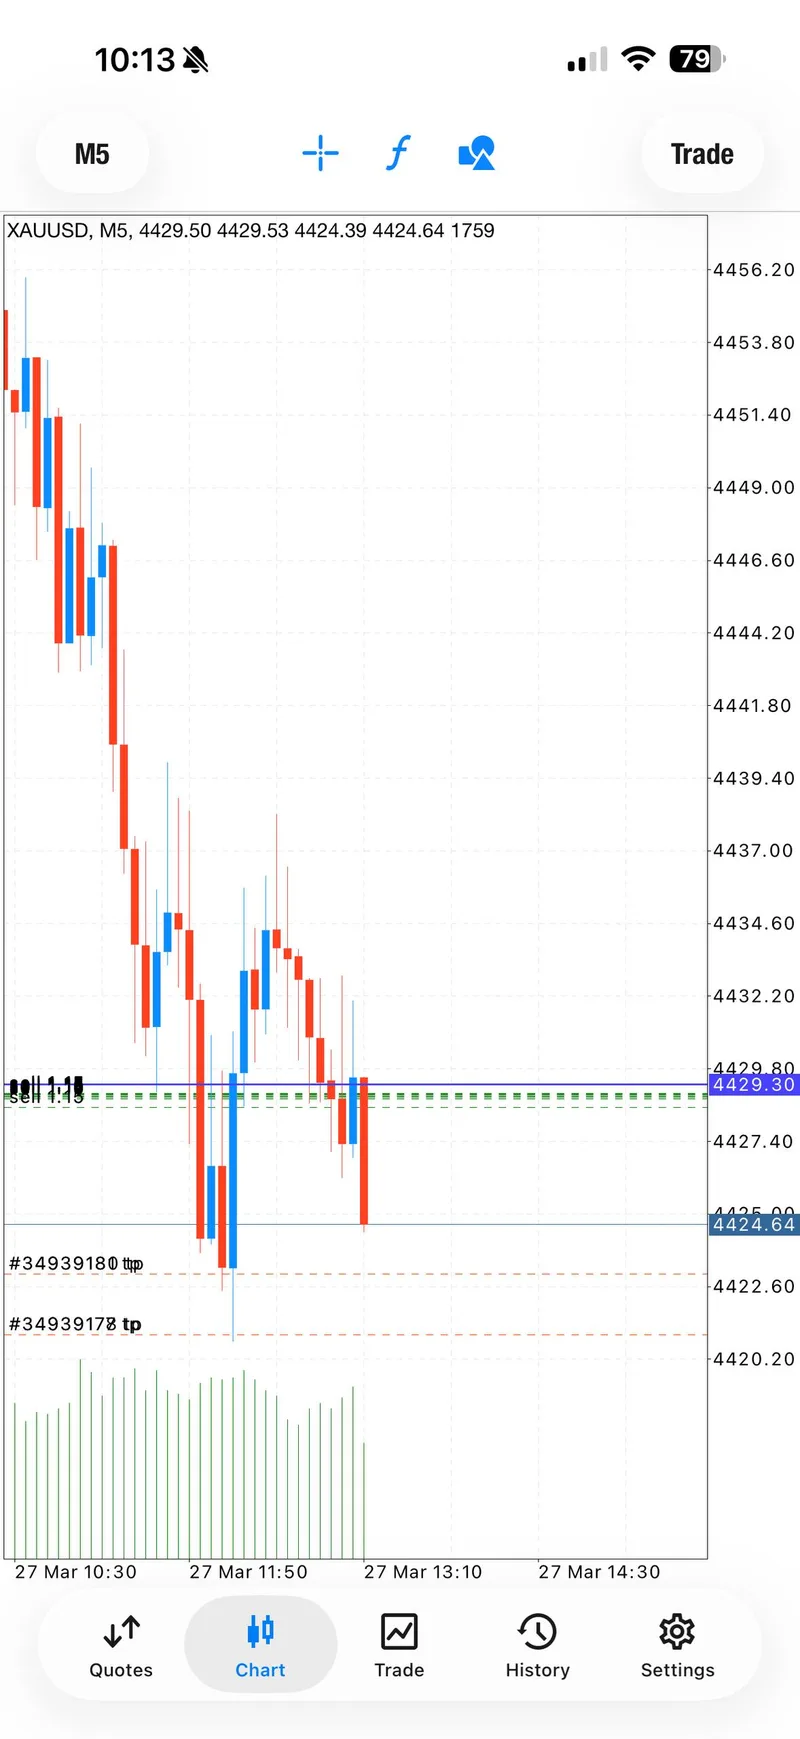
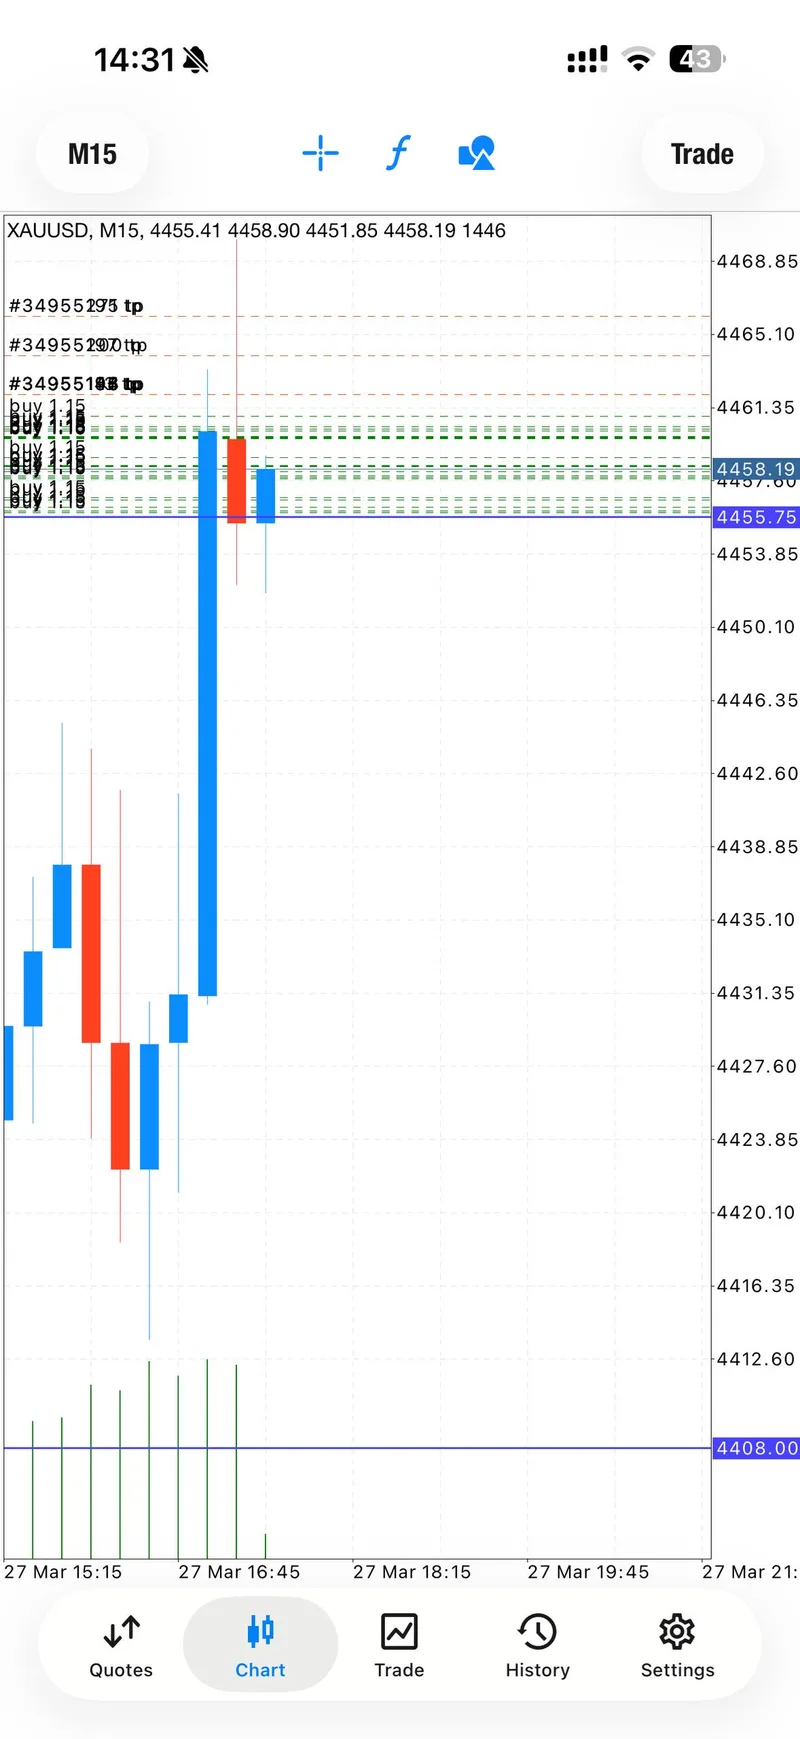
The day opened with back-to-back sell structures in almost the same zone because the dollar-yield mix stayed hostile. Signal 1 used 4427.6-4430 with a 4435 invalidation. Signal 2 came shortly after with 4428.5-4432 and the same 4435 stop. That repetition matters because it shows the room was not chasing random candles. It was leaning into the same pressure area while DXY held firm at 100.19 and the 10Y stayed elevated at 4.438%.
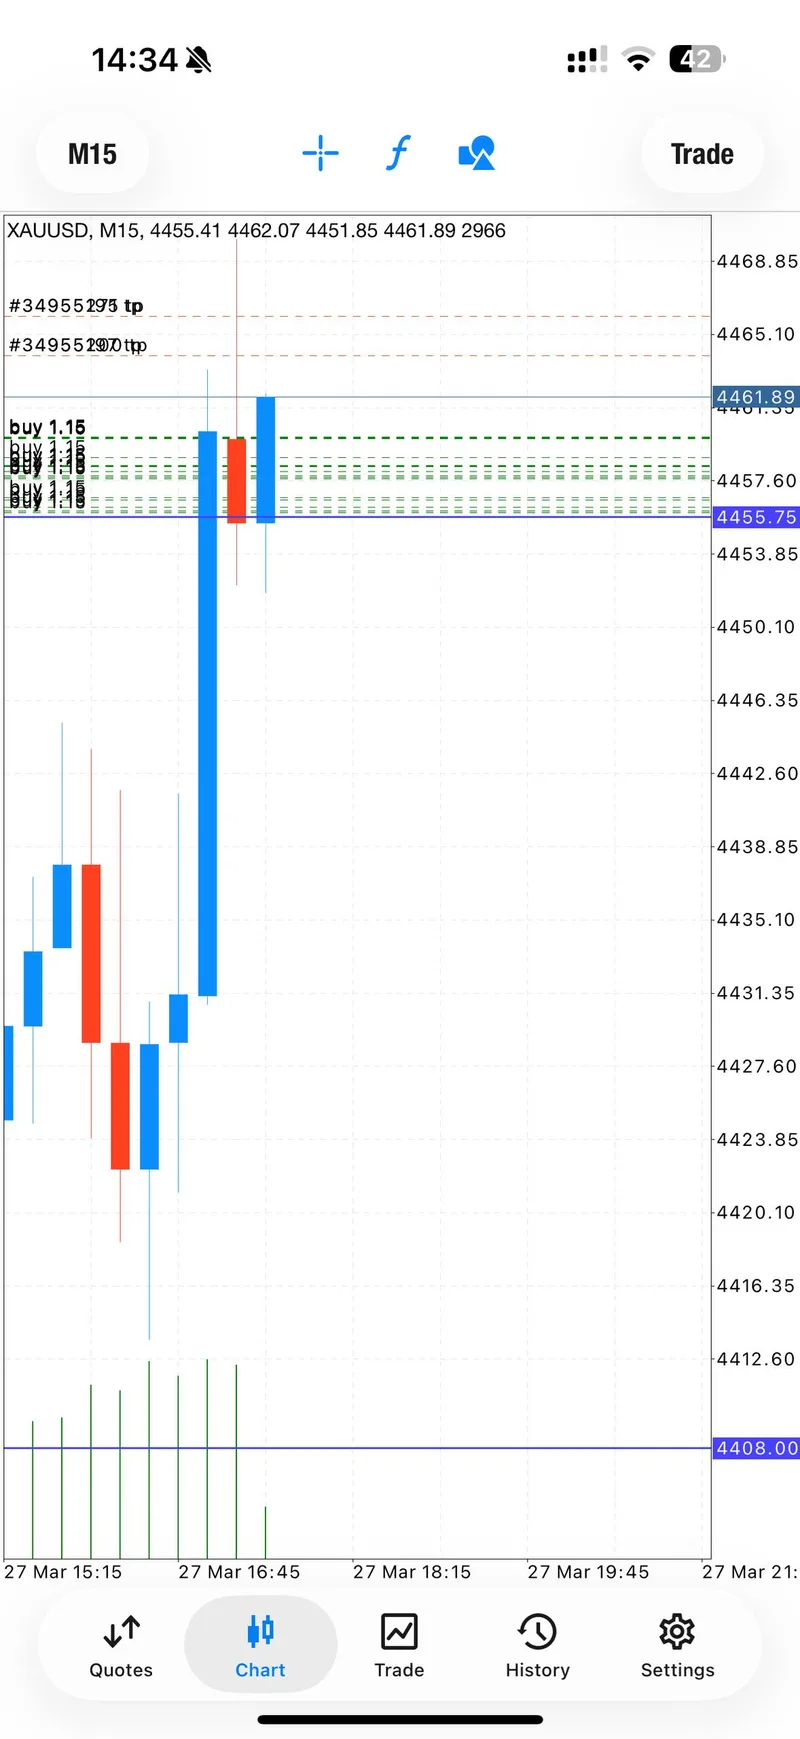
The late reversal was still real#
The tone changed because downside control did not last forever. VIX above 31 showed real fear, but once the early sell pressure was spent the market stopped behaving like a one-way washout. After the second sell finished, the members-only feed flipped to a buy idea at 4460-4456 with 4452 as the stop and 4462, 4464, and 4466 as the target ladder. In other words, the same day that rewarded morning sells later rewarded a disciplined late buy.
This sequence also fits the pattern seen in the March 25 daily gold trading report: Mo's edge is not just finding one direction, but staying usable when the session changes character. On March 27 the evidence shows exactly that. The room pressed the first clean downside move, pressed a second sell when the setup repeated, and then caught the rebound once the tape stopped behaving like a pure sell session.
Technical Outlook#
The verified dashboard now supports the same technical map already visible in the signal evidence. The regime call is Correction, bearish short-term within a broader bull cycle, so the safest read is still tactical: respect the short-term pressure, but do not forget that gold can rebound fast once fear peaks and the first dollar bid has already cleared.
| Session level | Value | Why it matters |
|---|---|---|
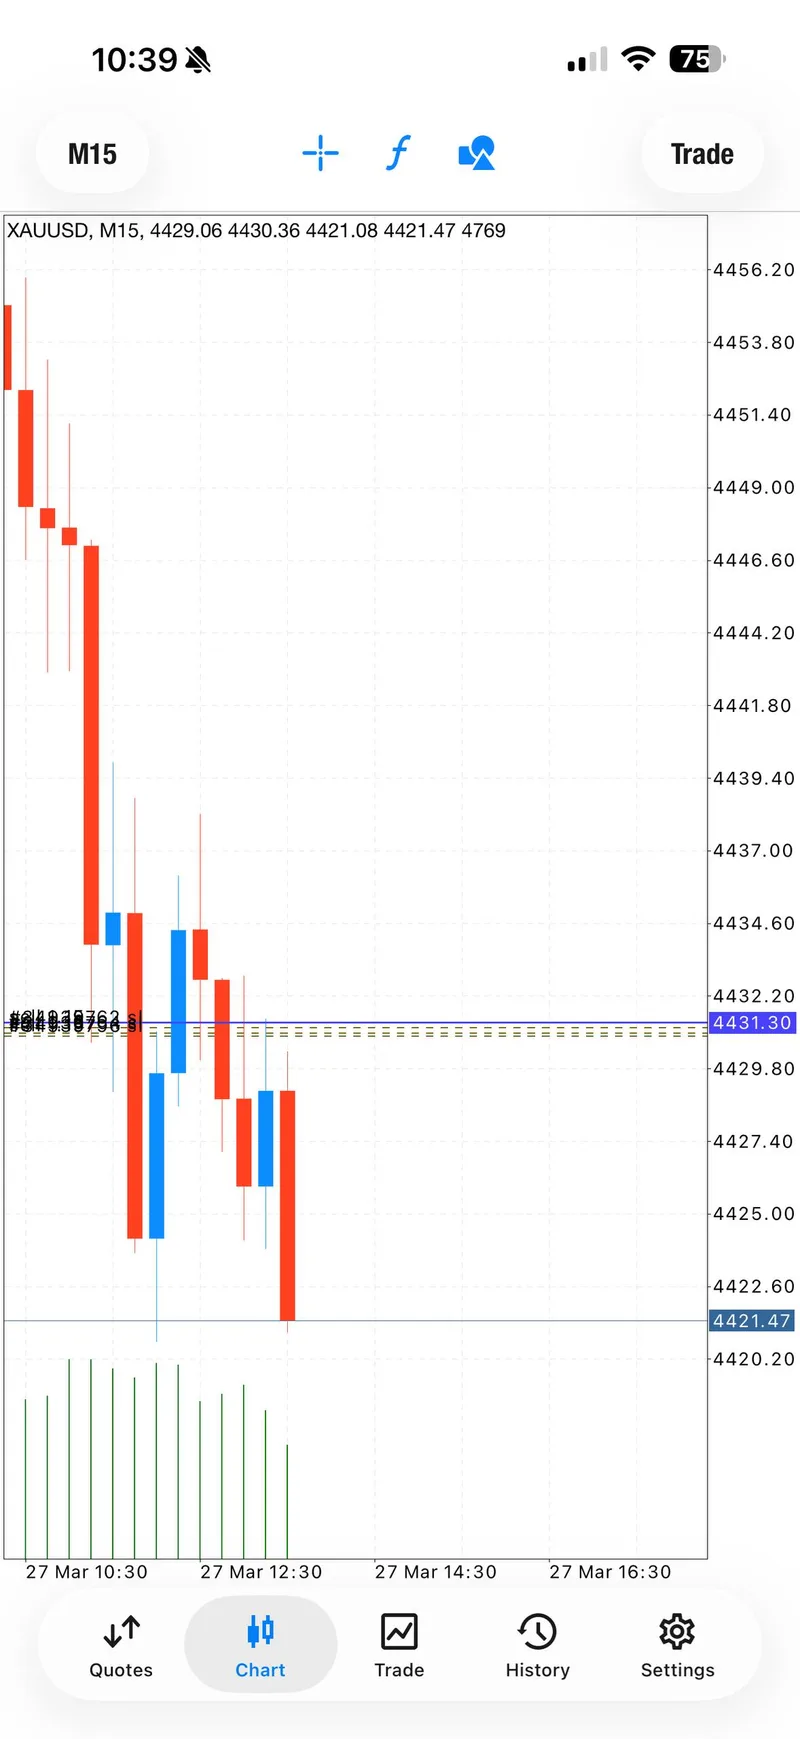
| Repeated sell zone | 4427.6-4432 | Two verified sell ideas were issued from this supply area |
| Sell invalidation | 4435 | Both sell structures used the same ceiling for risk definition |
| Recovery demand zone | 4460-4456 | The late-session buy used this area to catch the reversal |
| Recovery invalidation | 4452 | The late buy stayed disciplined because the stop was still tight |
| Late-session extension | 4466 | Highest verified buy target printed in the saved signal evidence |
That technical map lines up with the verified dashboard instead of fighting it. The 4435 ceiling mattered because it separated controlled downside ideas from a failed sell thesis. The 4460-4456 reversal zone mattered because it showed where pressure had already done enough work to set up a late recovery. The bigger picture is still a broader bull cycle, but March 27 traded like a short-term correction day where the dollar won the first haven bid. Readers who want broader nearby context can compare this with the weekly gold trading summary for March 16-20, 2026, which shows how GTMO usually handles regime shifts across several sessions instead of one fast day.
Trading Signals#
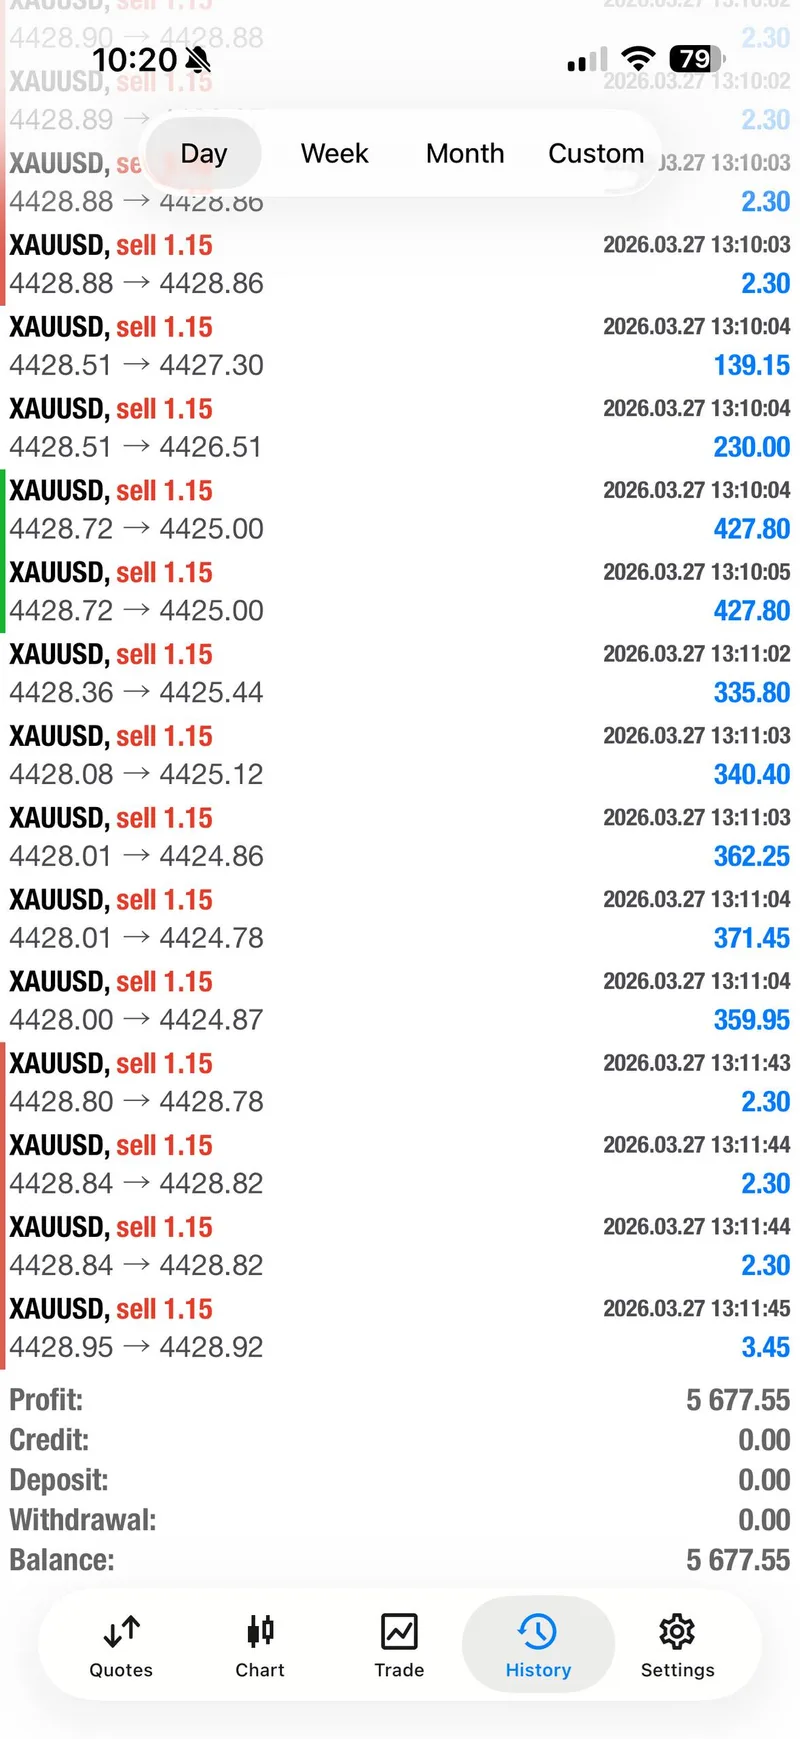
March 27 produced three verified GTMO signals once duplicate posts across the public and members-only feeds were removed. All three retained entries include a full entry range, stop, target ladder, and result trail. That is enough to treat the day as a valid reportable session.
Signal 1 - Morning sell#
- Entry: 4427.6-4430
- SL: 4435
- TP: 4425 / 4423 / 4421, then open remainder
- Result: TP1 was confirmed, Mo shifted the rest to zero risk, and later posted "Breakeven hit, $5k closed" on the remainder.
Signal 2 - Second sell continuation#
- Entry: 4428.5-4432
- SL: 4435
- TP: 4426 / 4424 / 4422, then open remainder
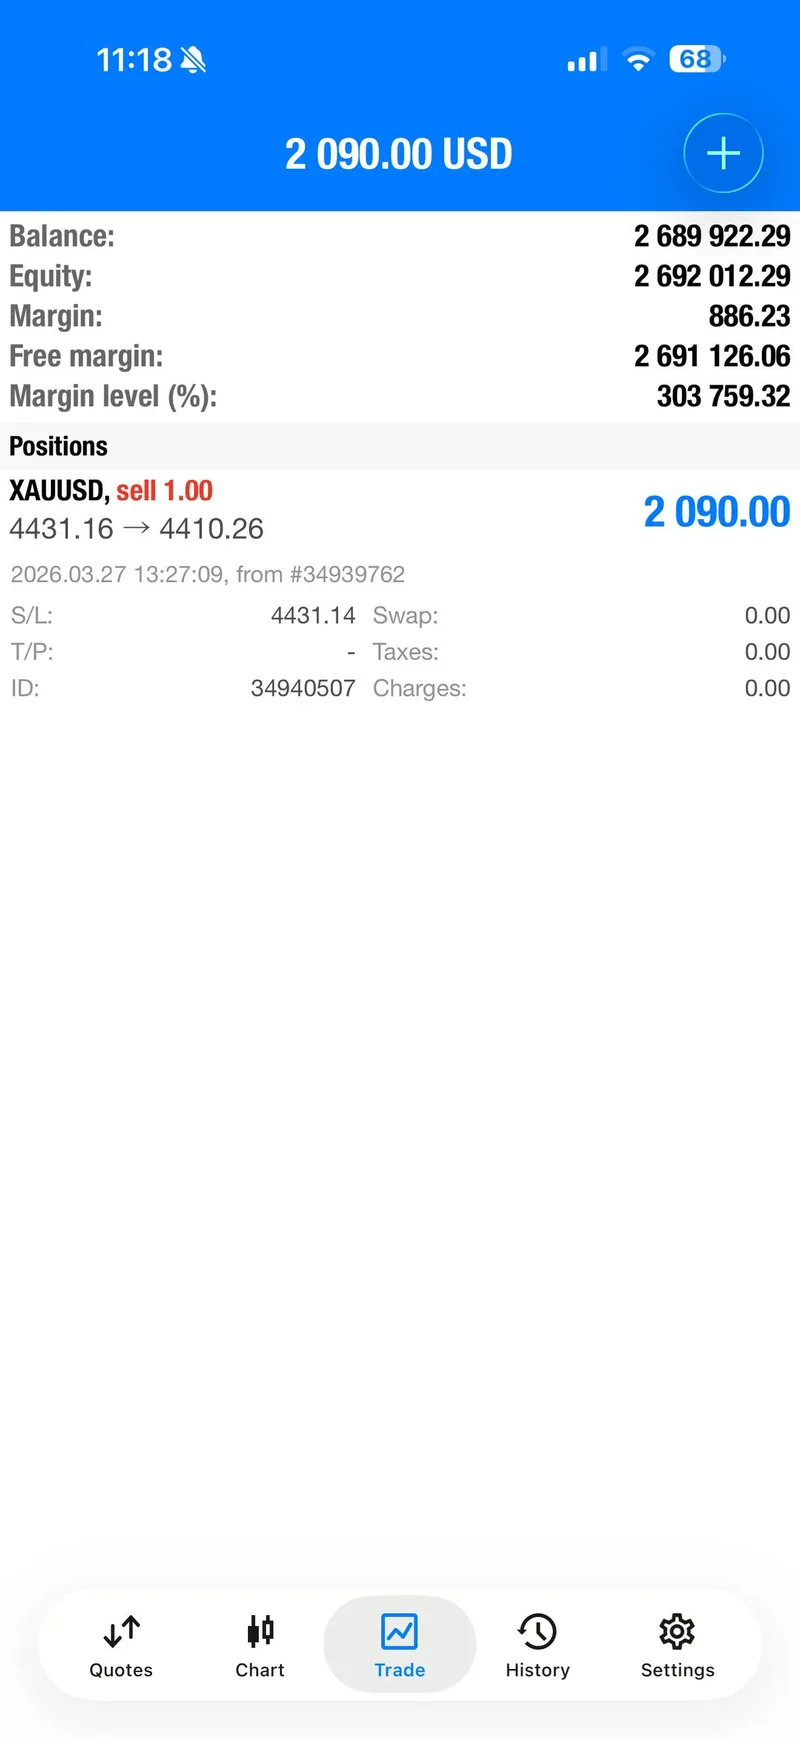
- Result: TP1, TP2, and TP3 were all called complete. The session later closed with a visible $2,090 profit ticket on the final sell proof image.
Signal 3 - Late-session buy#
- Entry: 4460-4456
- SL: 4452
- TP: 4462 / 4464 / 4466, then open remainder
- Result: The members-only feed reported all three targets hit in a one-minute candle, moved protection after the burst, took partial profit, set breakeven, and closed the rest green.
The key point is not just that three ideas were posted. It is that all three can be reconstructed from saved evidence with exact fields, and all three make sense against a dashboard that now confirms a correction regime with volatility above 31. That is the threshold the daily report contract actually needs, and March 27 clears it.
Signal Performance Breakdown#
The win-day narrative is strong because the session did not depend on one lucky screenshot. Signal 1 generated immediate confirmation and real cash before the remainder was flattened at breakeven. Signal 2 reused the same morning pressure zone and delivered the cleanest finish of the day, including the strongest single-ticket proof in the selected gallery. Signal 3 then proved the room did not stay mentally stuck on the downside once the session turned.
There is also a useful separation between verified evidence and operator headline copy. The raw Telegram file contains a room-level banner that read "$31,139.50 TODAY PROFIT!" and "3 Winning Trades, both directions traded!" That is valid same-day evidence for narrative framing, but it should still be treated as channel-posted session summary rather than an externally reconciled account statement. The stronger reporting base is the combination of exact signal fields, the visible $5,000 closeout language, the visible $2,090 ticket, and the member screenshots that followed.
The macro alignment matters here. DXY at 100.19 and the 10Y at 4.438% justified the first two sells because the market was still trading the correction regime honestly. Then VIX at 31.05 signaled an overstretched tape, which helps explain why the late-session buy could work after the downside pressure exhausted. GTMO did not fight the dashboard. It traded with it, then reacted faster than traders who stayed anchored to only one direction.
This is why the day should be described as a true win day. The room logged three verified trade ideas. The first one paid and protected. The second one swept the full sell ladder and produced the cleanest numerical proof. The third one showed that the late reversal was not just commentary; it was tradeable. That is a stronger story than a single good call because it shows sequence, adaptation, and follow-through.
Execution Lessons#
Lesson 1 - Repetition works when the invalidation stays tight#
Both sell ideas leaned on 4435 as the line that proved the downside case wrong. Reusing a level is only useful when the risk stays defined. March 27 passed that test because the repeated setup did not widen into lazy hope. It stayed specific.
Lesson 2 - Zero-risk language matters because it changes trader behavior#
Signal 1 did not just hit an opening target. It shifted into zero-risk management before the remainder was closed for a posted $5,000 result. That matters because it turned early direction into actual cash protection. On fast days, that is often what keeps a good morning from turning into an emotional afternoon.
Lesson 3 - A win day can still be two-way#
The late-session buy is what stops this report from becoming a one-note sell recap. Once the downside pressure was spent, the room took the opposite side with a full set of levels and then reported the recovery targets as complete. The lesson is simple: the room performed because it stayed conditional, not stubborn.
Lesson 4 - Community proof is strongest when it mirrors the session map#
The selected gallery does not rely on generic celebration posts. It mirrors the signal sequence. The profit images show Signal 1 progress, Signal 1 cash proof, Signal 2 extension, Signal 2 final ticket, the late buy setup, and the late buy continuation. The community images then show that the same session translated into visible member outcomes. That one-to-one alignment is why the report feels defensible instead of decorative.
What The Day Means Going Forward#
March 27 matters because all 7 Google AI metrics now support the same story the signal tape was already telling: correction regime, bearish short-term inside a broader bull cycle, with the energy shock and volatility spike initially pushing safe-haven demand into the dollar. The proven part of the session is strong: three verified signals, multiple cash-result proofs, and enough real community feedback to show the day landed with traders.
The bigger takeaway is that this was a fast, two-way, evidence-heavy day where GTMO converted a difficult macro backdrop into a clear win narrative. Traders got paid on the downside first, then saw the room adapt when the tape stopped behaving like a one-way selloff.
Member voices from March 27#
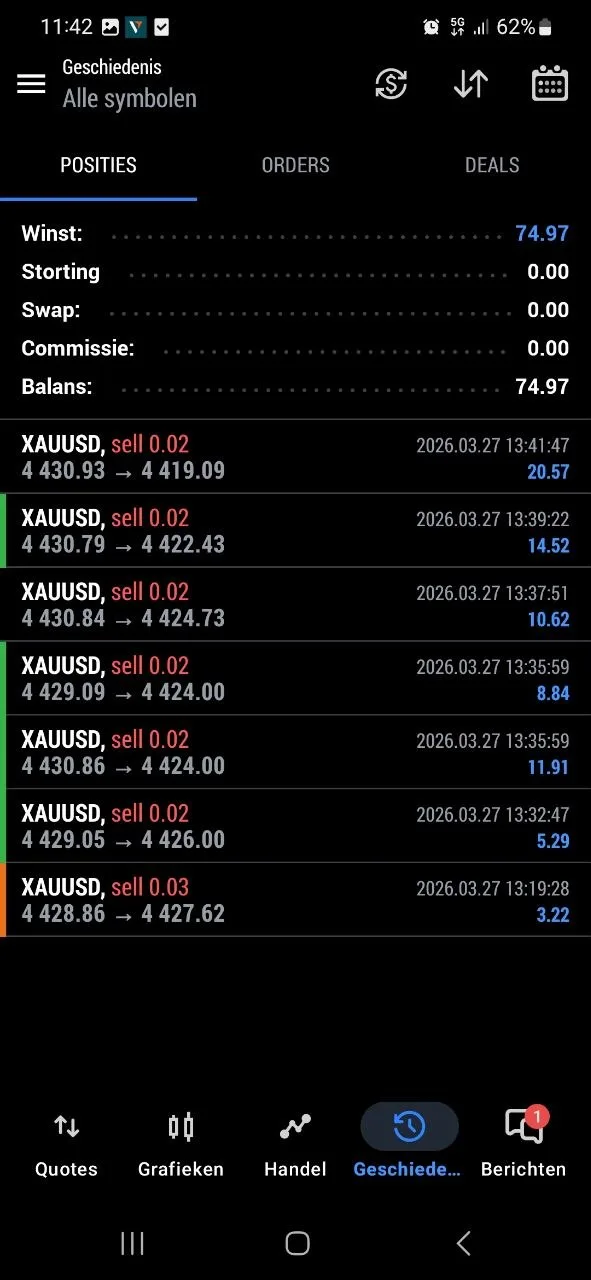
Community proof: $74.97 total and the trader replied, "I am out of the trade! Thank you mo!"
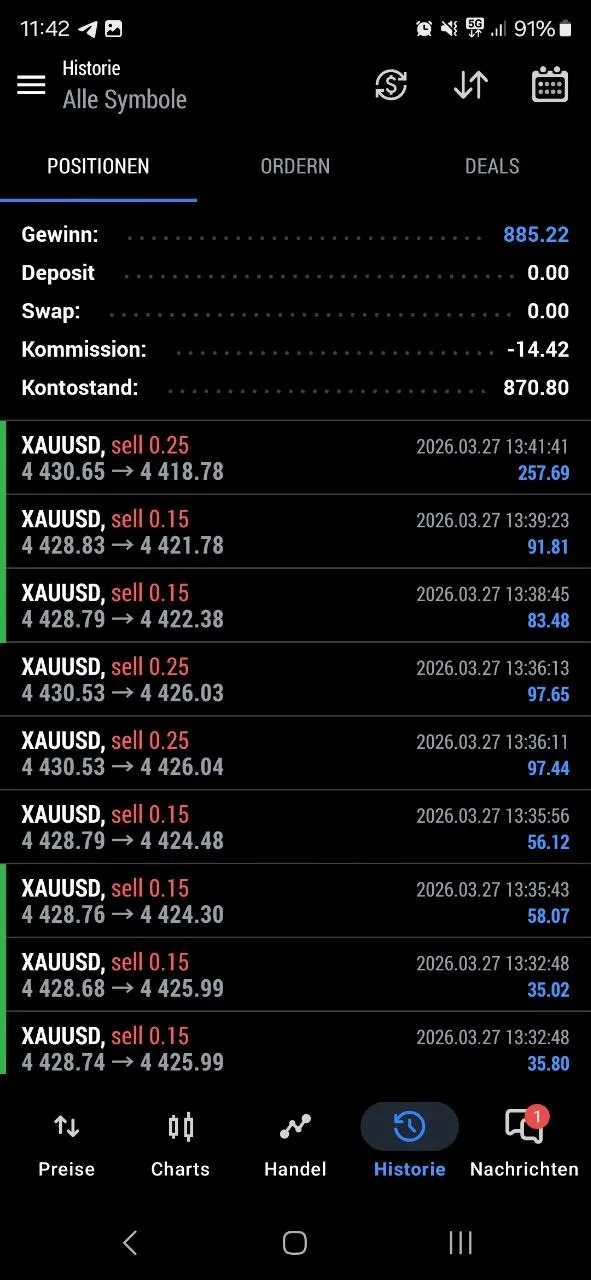
Community proof: $885.22 total profit with the note, "Another winning day with Mo. Thank xou @gtmo."
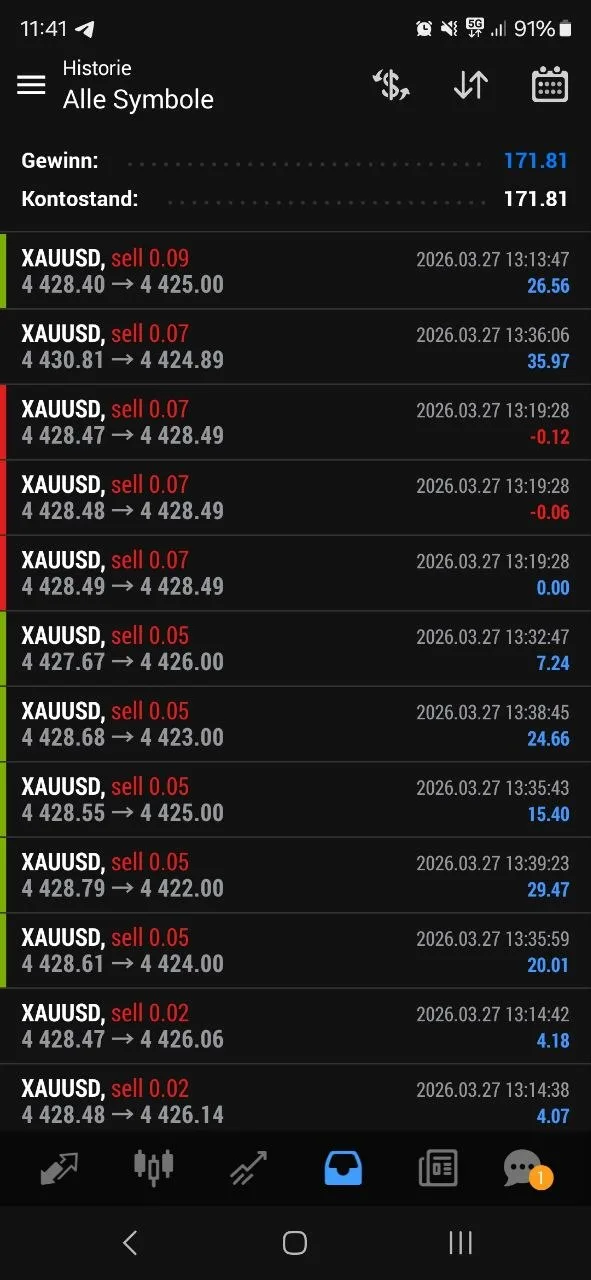
Community proof: $171.81 total across extra March 27 XAUUSD wins, reinforcing that the sell sequence paid more than once.
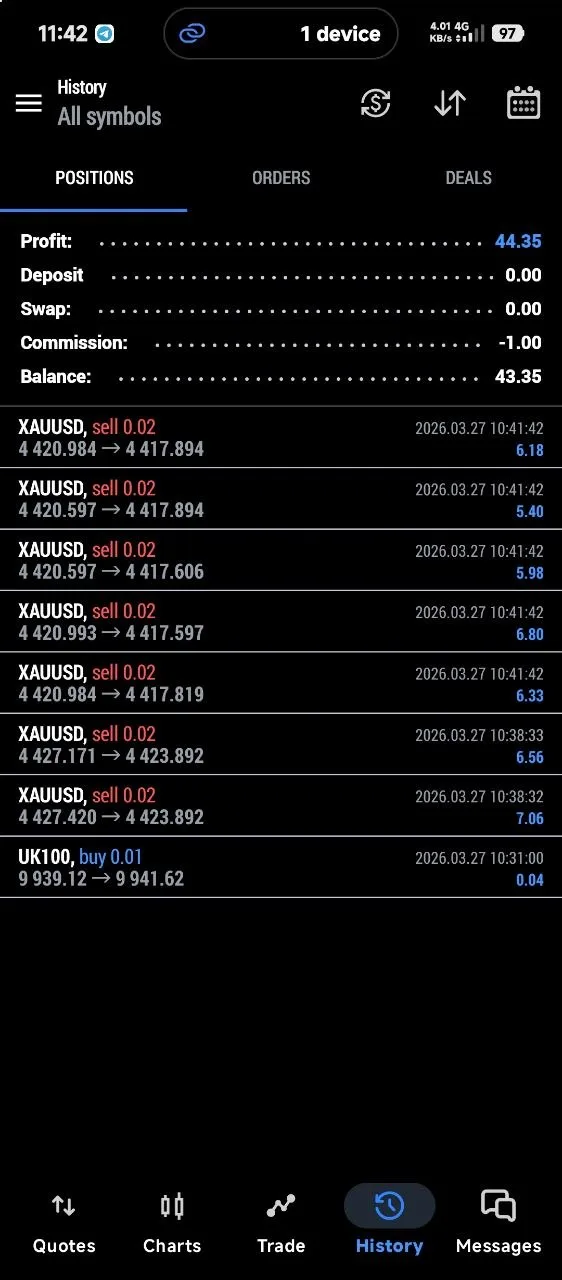
Community proof: $44.35 total with mostly XAUUSD wins, a smaller but still real cash result from the same session.
Community feedback on signal quality: "King Mo, thank you, the fall was good to watch."
Community feedback on result quality: "Thank you Mo! Got a bit scared, but totally worth it."
Small-account proof: "I never had this profit on a $26 account. Thanks so much, the goat."
Community proof from Austria: "$1,152 from Austria. We love you Mo, always giving away freeware money!"
Those blockquotes are valuable because they show more than excitement. They tie the session to concrete dollar outcomes, signal quality, and result quality across very different account sizes. That is exactly the kind of social proof the daily report contract is meant to preserve.
FAQ#
What does the verified March 27 dashboard say in one line?#
It says gold closed at $4,417.45 (+0.28%) inside a Correction regime, bearish short-term within a broader bull cycle, while DXY held at 100.19, the 10Y stayed at 4.438%, WTI jumped to $99.64, VIX spiked to 31.05, and the Fed stayed on hold at 3.50%-3.75%.
Why did gold still finish green if the short-term regime was bearish?#
Because the broader bull cycle is still intact even though the short-term tape was corrective. March 27 opened with dollar-led pressure, then rebounded once volatility had already spiked and the first sell wave was exhausted.
Why did safe-haven demand help the US dollar more than gold?#
The market was dealing with an energy shock, sticky inflation pressure, and a Fed that was still on hold. In that setup, traders often buy the dollar first, especially when DXY is firm and yields are elevated, which is exactly what March 27 showed.
Why are there no inline screenshots inside the article body?#
The report keeps charts and proof images in the gallery so the story stays readable while the evidence remains easy to review in sequence.
Which nearby GTMO posts give the best context for this session?#
Start with the March 25 daily gold trading report for another strong win-day example, then compare the broader setup language in the weekly gold forecast for March 23-27, 2026 and the weekly gold trading summary for March 16-20, 2026.
What explains the late rebound after the morning sell pressure?#
The early dollar-and-yield pressure did real damage first, but VIX above 31 also signaled a fear spike that could reverse once the opening washout was spent. That is why a late-session recovery trade made sense after the downside move had already done its work.
Connect with Gold Trader Mo#
Follow the daily archive, compare nearby reports, and use the support channel if you want updates before the next trading session.
- Free Signals: GTMO Trades
- Support: @gtmobest
- YouTube: GTMOFX
- Instagram: mojirjees
- Website: Gold Trader Mo
Risk Disclaimer: This content is educational only and is not financial advice. Trading gold and leveraged products involves risk, capital is at risk, and results may vary. Only use funds you can afford to lose.