Last Week's Gold Market Recap#
Gold just suffered its worst weekly decline since 2011, and the market that entered last week above $5,000 with talk of "new paradigm" pricing exited Friday at $4,491.15 — a staggering loss of roughly 10.4% in five sessions. For traders who have been following our market analysis coverage, this is the kind of week that separates structural conviction from momentum-chasing, and the distinction matters enormously for what comes next.
The week started near the $5,000+ level with residual bullish momentum from a first-quarter rally that had taken gold to a 52-week high of $5,477.79. On Monday and early Tuesday, price pushed as high as $5,419.25 ahead of the March FOMC meeting, as traders positioned for a dovish pivot or at least a signal that cuts were approaching. That pre-Fed high now looks like a blowoff top. What followed was a three-day unraveling that combined hawkish policy disappointment, geopolitical whiplash, and a liquidity vacuum into one of the sharpest gold selloffs in over a decade.
The FOMC held the federal funds rate at 3.75% on Wednesday, which was expected. What was not expected was the tone. Chair Powell explicitly stated that the Committee needed to see further progress on inflation before entertaining rate reductions, and the updated dot plot confirmed that rates would stay higher for longer than markets had priced. Treasury yields surged, the 10-year climbed toward 4.384%, the dollar regained favor with the DXY pushing to 99.55, and gold — which had been priced for easing — began to reprice violently.
March 19 became the single most destructive session. Gold fell 4.37% in a single day, sliding from approximately $4,816 to close at $4,608.97. That is a $207 intraday decline, the kind of move that triggers margin calls, blows through stop-loss clusters, and forces even well-capitalized accounts to reassess position sizing. The catalyst was not just the Fed. The US-Israel military escalation against Iran, which had been building since late February, created a paradoxical dynamic: geopolitical risk that would normally support gold was instead driving dollar strength as a global safe-haven preference, squeezing gold from both the rate side and the currency side simultaneously.
March 20 — Eid Al Fitr Friday — delivered another brutal session. Gold printed a $239 intraday range between $4,494 and $4,733, whipsawing traders who tried to call a bottom too early. The close at $4,491.15 was just $13 above the weekly low of $4,477.82, confirming that sellers had the final word. The market ended the week not with stabilization but with unresolved selling pressure, thin holiday liquidity, and a complete psychological shift from "goldilocks rally" to "is the bubble bursting?"
Despite the carnage, context matters. Gold is still up more than 5% year-to-date for 2026. It is 14.68% below its 52-week high, which is a significant correction but not a structural breakdown. Institutional forecasts — J.P. Morgan at $6,300, Bank of America at $6,000, Wells Fargo at $6,100–$6,300 — remain massively bullish. Central bank buying continues to provide a structural floor. The question entering this week is not whether gold will eventually recover, but when and from what level. Last week forced the market to reprice the timing of that recovery. This week will test whether the selloff has found a floor or whether there is more downside to absorb.
For context on how last week's signals played out in real time, our daily reports tracked the unraveling session by session, and last week's outlook is available at our March 16-20 forecast.
Key Fundamental Drivers for Gold This Week#
This week's fundamental landscape is defined by one overriding question: has the market finished repricing the hawkish Fed surprise, or is there more adjustment ahead? The answer depends on three pillars — incoming economic data, the evolving Iran situation, and whether institutional demand materializes on the dip.
The Fed overhang is the primary driver. Last week's FOMC outcome reset market expectations dramatically. Before the meeting, futures had priced roughly two rate cuts by year-end. After Powell's hawkish press conference and the updated dot plot, the market is now uncertain whether any cuts will occur in 2026. The 10-year Treasury yield at 4.384% reflects this repricing, and the DXY at 99.55 shows the dollar benefiting from higher-for-longer expectations. For gold, this creates a hostile environment on the rate-differential front: higher real yields increase the opportunity cost of holding a non-yielding asset, and a stronger dollar mechanically pressures the gold price. Any further hawkish commentary from Fed speakers this week — and several are scheduled post-blackout — could extend the selloff.
The Iran conflict remains the wild card. US-Israel military operations against Iran, escalating since late February, have created an unusual macro dynamic. Normally, geopolitical conflict is unambiguously bullish for gold. But this time, the conflict is also supporting dollar strength through flight-to-safety flows into US assets and pushing oil prices to $94.74 (WTI), which feeds back into inflation expectations and reinforces the Fed's hawkish stance. Gold is caught in a paradox: the risk premium that should support it is being offset by the monetary policy response to the same risk. If the conflict de-escalates, gold could paradoxically rally because the inflation pressure from oil would ease, giving the Fed more room to consider cuts.
Central bank buying remains the structural anchor. J.P. Morgan, in their latest research, identified central bank accumulation as the primary reason their $6,300 year-end target remains intact despite the selloff. This is not a short-term trading input, but it establishes a floor beneath which institutional demand is likely to absorb selling. ETF flows show early signs of "bottom-fishing" — investors using the dip to add exposure rather than liquidating further. If this pattern holds through Monday and Tuesday, it would be a meaningful signal that the smart money views $4,400–$4,500 as a buying zone rather than a breakdown zone.
The VIX at 24.06 confirms that cross-asset volatility remains elevated. For gold traders, this means wider intraday ranges, more aggressive stop-hunting, and the need for broader risk management than normal. This is not a market where tight stops and high leverage will reward patience; it is a market where position sizing discipline and level-based execution are survival requirements.
Gold Technical Analysis & Key Levels#
The technical picture has shifted dramatically from the constructive consolidation of two weeks ago to an oversold crash structure that demands a completely different analytical framework. Gold closed below key weekly moving-average support for the first time since the rally began, MACD has printed a bearish crossover, and the 14-period RSI has entered oversold territory after the 17% decline from the $5,477.79 high. The chart is no longer telling a story of "trend continuation." It is telling a story of "damage assessment and potential mean reversion."
Starting with the moving-average structure, the breakdown is clear. The 20 EMA, 50 SMA, and key weekly moving averages that had been supporting the rally now sit above price, which means they have flipped from support to resistance. This is a meaningful structural change. During the rally, every test of moving-average support attracted buying. Now, every rally toward those same levels will encounter overhead supply from traders who bought higher and are looking to exit at reduced losses. The first test of this dynamic will likely occur if gold rallies toward the $4,791–$4,815 zone, where prior support now acts as resistance.
The RSI in oversold territory is a double-edged signal. Historically, oversold readings in gold after sharp selloffs have preceded significant bounces — but the timing of those bounces is unpredictable. Oversold does not mean "buy immediately." It means the selling has been extreme enough that a relief rally is mechanically probable, but the bounce can come from current levels or from lower levels after a final capitulation flush. The MACD bearish crossover reinforces the idea that downside momentum has not yet exhausted itself, even though the pace of selling is likely to decelerate.
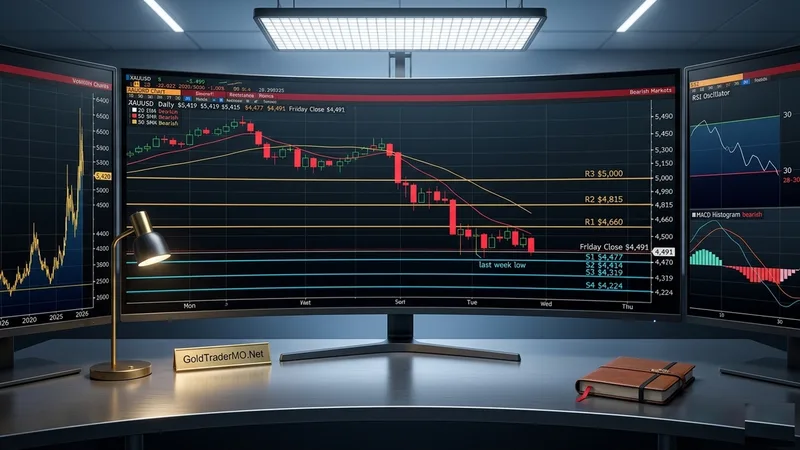
The support and resistance map for this week reflects the new reality:
| Level | Price | Significance |
|---|---|---|
| R4 | $5,000 | Psychological round-number resistance; the old floor is now a distant ceiling. Reclaiming this level would signal full recovery — extremely unlikely this week. |
| R3 | $4,996 | Pre-crash support shelf; any rally to this area would encounter massive overhead supply from trapped longs. |
| R2 | $4,791–$4,815 | Key resistance zone where prior support has flipped. A close above $4,815 would signal the correction is stabilizing. |
| R1 | $4,660–$4,680 | Immediate resistance and the first level bulls must reclaim to signal any short-term recovery attempt. |
| Friday Close | $4,491 | Current price anchor; how Monday opens relative to this level sets the tone for the week. |
| S1 | $4,477 | Last week's low and the first downside test. A break below confirms sellers remain in control. |
| S2 | $4,414 | Secondary support; a target for continued selling if $4,477 fails. |
| S3 | $4,319 | Deeper support and the bear-case target for a continued liquidation phase. |
| S4 | $4,224–$4,251 | Major structural support zone; if reached, this would represent a ~23% correction from highs and likely attract significant institutional buying. |
The technical conclusion is clear: gold is in a crash recovery phase, not a trending phase. The immediate bias is to the downside until proven otherwise. The burden of proof is on buyers to reclaim $4,660 and then $4,815 to shift the near-term structure from bearish to neutral. A break below $4,477 extends the selloff toward $4,414 and $4,319. Traders who want a deeper framework for execution around these levels can reference our gold scalping strategy guide, which addresses reaction-level logic and session-based confirmation rather than static directional bias.
Risk Events & Economic Calendar#
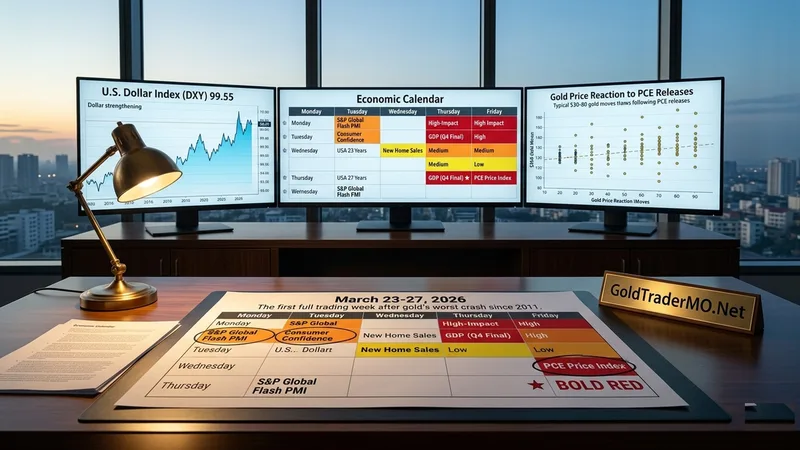
This is a PCE week — and after last week's hawkish Fed shock, Friday's Core PCE reading may be the single most consequential data point for gold's near-term direction. The economic calendar builds progressively from Monday's PMI flash readings to Friday's inflation data, creating a sequence where each release either reinforces or challenges the post-FOMC repricing. Traders should think in terms of cumulative narrative rather than isolated events.
The critical context is this: the Fed told the market last week that it needs to see more progress on inflation. Friday's PCE print is the next direct test of that condition. A cooler reading would undercut the hawkish narrative and create space for a gold bounce. A hotter reading would validate the Fed's caution and extend the selloff.
| Day | Event | Expected Impact | Why It Matters | Hotter/Stronger Implies | Cooler/Weaker Implies |
|---|---|---|---|---|---|
| Monday, March 23 | S&P Global Flash PMI (Manufacturing & Services, March) | High | First read on March business activity. Sets the growth narrative for the week. | Strong economy supports hawkish Fed, pressures gold toward $4,477. | Slowing activity challenges higher-for-longer thesis, supports gold recovery. |
| Monday, March 23 | Chicago Fed National Activity Index | Medium | Broad measure of economic momentum after the Fed's hawkish pivot. | Reinforces strong economy narrative, keeps yields elevated. | Softening momentum gives gold room to stabilize. |
| Tuesday, March 24 | Conference Board Consumer Confidence (March) | High | Consumer sentiment after the Fed and amid Iran conflict. Shapes spending expectations. | Confident consumers support growth/inflation narrative, bearish for gold. | Declining confidence suggests economic anxiety, supports safe-haven demand. |
| Tuesday, March 24 | New Home Sales (February) | Medium | Housing data reflects rate sensitivity. 10Y at 4.384% is already pressuring the sector. | Resilient housing despite high rates supports restrictive policy. | Weak sales confirm rate-sensitive sectors are cracking, dovish signal. |
| Wednesday, March 25 | Durable Goods Orders (February) | High | Capital spending indicator; a leading signal for business investment and manufacturing. | Strong orders support growth narrative, negative for gold. | Weak orders suggest businesses pulling back, supportive for gold. |
| Thursday, March 26 | Q4 2025 GDP (Third Estimate) | Medium-High | Final revision of Q4 growth. Markets will focus on the GDP deflator and consumer spending components. | Upward revision supports hawkish Fed, pressures gold. | Downward revision challenges the growth story, mildly gold-positive. |
| Thursday, March 26 | Weekly Initial Jobless Claims | Medium | Labor market health check; rising claims would signal cracks in employment. | Low claims support strong economy narrative. | Rising claims could shift Fed calculus, gold-positive. |
| Friday, March 27 | Core PCE Price Index (February) | Very High | The Fed's preferred inflation gauge. This is the week's most important release. Powell explicitly said he needs more inflation progress — this print is the test. | Validates hawkish Fed, extends gold selloff, targets $4,319 or lower. | Undercuts hawkish narrative, potential catalyst for relief rally toward $4,660+. |
| Friday, March 27 | Personal Income & Spending (February) | High | Consumer spending strength shapes demand-side inflation outlook. | Strong spending supports inflation persistence, negative for gold. | Weak spending signals demand cooling, supports gold. |
| Friday, March 27 | UMich Consumer Sentiment (Final, March) | Medium | Final revision of March sentiment; inflation expectations component is closely watched by the Fed. | Higher inflation expectations reinforce hawkish stance. | Lower expectations ease pressure on gold. |
Additionally, multiple Fed speakers are expected throughout the week now that the post-FOMC blackout period has lifted. Watch for commentary from regional Fed presidents — any reinforcement of Powell's hawkish tone could extend selling pressure, while any hint of disagreement or dovish nuance could provide a relief catalyst.
The calendar takeaway: Monday through Wednesday set the growth narrative; Thursday provides context through GDP and claims; Friday's Core PCE is the decisive event. If gold can hold above $4,477 through Thursday and the PCE comes in soft on Friday, the conditions for a meaningful relief rally are in place. If the PCE confirms persistent inflation, expect the selloff to extend.
Weekly Forecast & Outlook#
Bullish Case — 25% Probability#
The bullish case requires a specific sequence: early-week stabilization above $4,477, growing evidence of institutional dip-buying, at least one weak economic print (PMI or Consumer Confidence), and a Friday Core PCE that comes in below expectations. In this scenario, gold finds a floor in the $4,450–$4,500 zone during the first half of the week, begins a relief rally through $4,600, and reclaims $4,660–$4,680 by midweek. If Friday's PCE delivers a downside surprise, the rally extends toward $4,791–$4,815 by the close.
The logic: oversold RSI after a 17% correction, central bank buying providing structural demand, institutional targets still at $6,000–$6,300, and the historical pattern that gold's worst weekly selloffs in the past two decades have been followed by mean-reversion bounces within 1–3 weeks.
Target range: $4,660–$4,815 Invalidation: Sustained trade below $4,414. If gold cannot hold the secondary support zone, the dip-buying thesis fails and the correction has further to run.
Base Case — 50% Probability#
The base case is volatile, two-sided consolidation between $4,400 and $4,700 as the market digests last week's crash and waits for Friday's PCE data to resolve the fundamental ambiguity. This is the most likely outcome because it reflects what typically happens after a crash of this magnitude: the initial panic subsides, short-covering creates temporary rallies, but overhead supply from trapped longs prevents a clean V-shaped recovery. The market needs time to establish a new equilibrium.
In this path, Monday and Tuesday test the $4,477 low, potentially dipping briefly to $4,414 on intraday probes before recovering. Midweek sees choppy price action in the $4,500–$4,650 range as traders position ahead of PCE. Friday's data then determines whether the range breaks higher or lower for the following week.
Target range: $4,400–$4,700 Invalidation: A decisive close above $4,815 (bullish breakout) or below $4,319 (bearish acceleration) would tell traders that the consolidation phase has resolved into a new trend.
Bearish Case — 25% Probability#
The bearish case materializes if the selling from last week was not a one-time repricing but the beginning of a broader deleveraging. The triggers are: strong PMI data on Monday confirming economic resilience, hawkish Fed speaker commentary reinforcing the higher-for-longer message, and a Friday Core PCE that comes in hot — validating the Fed's caution and killing any remaining hope for 2026 rate cuts.
In this scenario, gold breaks below $4,477 early in the week and sellers target $4,414 and then $4,319. If $4,319 fails, the next major structural support is in the $4,224–$4,251 zone, which would represent a roughly 23% correction from the 52-week high and likely trigger significant institutional intervention. The Iran escalation scenario adds a tail risk here: if the conflict worsens but the dollar strengthens further, gold could face the rare combination of rising geopolitical fear and falling gold prices.
Target range: $4,319–$4,414 Invalidation: A close above $4,680 invalidates the bearish continuation thesis, as it would show that selling pressure has been absorbed and the market is transitioning back toward the base-case range.
Across all three scenarios, the defining characteristic of this week is uncertainty resolution. The crash happened; the question now is whether the market accepts the new price level as fair or continues to search for a deeper floor. The institutional backdrop says "buy the dip." The technical backdrop says "prove the floor first." Traders who wait for confirmation rather than predicting will be better positioned regardless of which scenario unfolds.
How Traders Can Approach This Week#
This is not a week for aggressive directional bets. It is a week for disciplined, level-based execution with smaller size and wider invalidation zones than normal. The volatility profile has fundamentally changed — Friday's $239 intraday range is not an anomaly, it is the new baseline for the near term. Traders who use normal-volatility position sizing in this environment are likely to get stopped out repeatedly.
Session structure matters more than usual. Asia will set the early tone — watch whether price holds above $4,477 or immediately tests lower. If Asia holds, London traders will likely probe for a recovery move toward $4,550–$4,600. If Asia breaks below $4,477, London could accelerate the selling toward $4,414. New York is where the real directional moves will resolve, particularly around the 8:30 AM ET data releases.
The key execution principle this week is: trade reactions, not predictions. After a crash like last week, the temptation is to either "call the bottom" or "sell the bounce." Both approaches carry extreme risk. Catching a falling knife when RSI is oversold sounds logical, but RSI can stay oversold for weeks if the fundamental repricing is not finished. Selling an oversold bounce sounds logical, but the magnitude of selling already absorbed means any positive catalyst can trigger violent short-covering.
Instead, use the level map from the technical section. $4,660 is the first meaningful recovery level — if price reclaims it and holds on a retest, longs become cleaner. $4,477 is the line in the sand for downside — if it breaks on a closing basis, shorts toward $4,414 and $4,319 open up. Between these levels, the market is in no-man's land, and the highest-probability approach is to wait for the level to break and then trade the reaction.
For risk management:
- Reduce position size by 30–50% relative to your normal allocation until volatility normalizes
- Use ATR-based stops rather than fixed-pip stops; the Average True Range has roughly doubled from pre-crash levels
- Avoid holding unhedged positions through Friday's PCE release unless you are specifically positioned for the binary outcome
- If you are flat going into Friday, that is a valid position — there is no obligation to be exposed during peak uncertainty
For intraday and scalping approaches, our gold scalping strategy guide provides a framework for session-based execution that is particularly relevant when the market is range-bound with elevated volatility. The emphasis on confirmation logic over directional bias applies directly to this week's conditions.
For those tracking levels daily through the week, our daily reports will update key levels and market flow as each session resolves.
FAQ#
Has gold's bull market ended after a 10.4% weekly decline?#
No. A correction — even a severe one — within a structural bull market is normal. Gold has corrected 14.68% from its 52-week high, but it remains up more than 5% year-to-date and the fundamental drivers of central bank buying, portfolio diversification demand, and geopolitical hedging are all still intact. Institutional year-end targets of $6,000–$6,300 from J.P. Morgan, Bank of America, and Wells Fargo have not been withdrawn. What has changed is the timing expectation — the rally will likely take longer to play out than the euphoric pre-crash pricing suggested.
What is the most important level for gold this week?#
$4,477 — last week's low. If gold holds above this level through the week, the crash narrative transitions from "is it still falling?" to "where does it stabilize?" If $4,477 breaks on a closing basis, the next support zone at $4,414 and then $4,319 becomes the target, and the market's tone shifts from correction to potential capitulation. On the upside, $4,660 is the first level that signals recovery intent.
Why is the Iran conflict hurting gold instead of helping it?#
Because the conflict is creating a dual dynamic that is unusual in gold's history. The geopolitical risk premium should support gold (safe-haven demand), and it partially does. But the same conflict is elevating oil prices to $94.74, which feeds into inflation expectations, which reinforces the Fed's hawkish stance, which strengthens the dollar — and dollar strength directly pressures gold. When the dollar and gold both act as safe havens, the dollar tends to win because it offers yield. This paradox resolves only when the conflict either de-escalates (reducing the inflation pass-through) or escalates so severely that systemic risk overwhelms monetary policy logic.
Should I buy the dip at these levels?#
This depends entirely on your time horizon and risk tolerance. For longer-term investors, institutional research from J.P. Morgan and others identifies central bank buying as a structural floor that makes the $4,400–$4,500 zone attractive on a 6–12 month basis. For short-term traders, buying an oversold market before confirmation of a floor is a high-risk strategy — the phrase "catching a falling knife" exists for a reason. The safest approach is to wait for price to reclaim $4,660 on a closing basis before treating the dip as a confirmed buying opportunity, and to size any early entries smaller than normal.
What would change the outlook from bearish to bullish this week?#
Two things: a Friday Core PCE reading that comes in softer than expected, and gold reclaiming $4,660 on a closing basis. The soft PCE would undercut the Fed's hawkish narrative and reopen the door to rate-cut expectations later in 2026, directly reducing the opportunity cost of holding gold. The $4,660 close would confirm that selling pressure has been absorbed at the current level and buyers are willing to defend the post-crash range. Both conditions together would likely trigger the relief rally described in the bullish scenario.
How does this crash compare historically?#
The 10.4% weekly decline is the worst since September 2011, when gold fell from approximately $1,920 to $1,535 during a broader commodity and risk-asset liquidation. In that case, gold took roughly six months to find a durable floor but ultimately resumed its longer-term uptrend. The 2013 "flash crash" in gold saw a similar two-day waterfall before a multi-month basing period. The pattern in both cases was: crash → choppy basing → eventual recovery driven by renewed fundamental demand. The key variable this time is whether central bank buying accelerates the recovery timeline compared to prior episodes.
Final Thoughts#
This is the most important week for gold since the post-pandemic rally peaked in 2020. The market is in genuine price-discovery mode after a crash that was both technically severe and fundamentally driven. Last week destroyed complacency; this week tests whether the market can find a floor.
The data say oversold. The fundamentals say the structural bull case is intact. The technicals say the burden of proof is on buyers. And the calendar — with Friday's Core PCE as the defining event — gives the market a clear catalyst to resolve the current ambiguity. Trade the levels. Respect the volatility. Wait for confirmation. The opportunities this week will come from discipline, not prediction.
Disclaimer#
This article is for educational and informational purposes only and is not financial advice, investment advice, or a solicitation to trade. Trading involves risk and gold is highly volatile around inflation data, central-bank decisions, and geopolitical headlines. Always confirm levels with live market conditions and manage risk carefully.
- 🆓 Free Signals: GTMO Trades
- 💬 Support: @gtmobest
- 📺 YouTube: GTMOFX
- 📸 Instagram: mojirjees
- 🌐 Website: Gold Trader Mo