
Daily Gold Trading Report — March 25, 2026#
Gold exploded $150 higher on Tuesday, closing at $4,557.67 as the regime officially shifted from consolidation to bull market. The catalyst? Trump announced peace talks with Iran — then Iran denied everything, and gold held every dollar of its gains anyway. Gold Trader Mo fired a single sniper BUY signal at $4,557, hit all four take-profit targets, and closed the day with $21,044 in confirmed profits. If you followed yesterday's setup in the March 24 daily gold trading report, today was the breakout that consolidation was building toward.
Market Snapshot#
| Metric | Value | Change |
|---|---|---|
| XAUUSD Close | $4,557.67 | +1.86% |
| Fed Funds Rate | 3.50%–3.75% | Held (March 18) |
| DXY (Dollar Index) | 99.64 | +0.21% |
| US 10-Year Yield | 4.342% | -1.14% |
| WTI Crude Oil | $91.08 | -1.38% |
| VIX | 25.33 | -6.01% |
| Gold Regime | Bull Market | Breakout confirmed |
Tuesday's $150.66 surge from Monday's close of $4,407.01 was the largest single-session move in over a week. The regime classification flipped from consolidation to bull market — the first regime change since gold entered its correction from the $5,602 all-time high earlier this month.
What made the move remarkable was the macro backdrop. The dollar actually rose slightly (+0.21%) and the 10-year yield only dipped modestly — normally headwinds for gold. Yet gold powered through on pure safe-haven demand driven by geopolitical uncertainty around the Iran conflict. VIX dropped 6.01%, signaling that equity volatility was easing, but capital was rotating into gold rather than back into risk assets. Oil fell 1.38% to $91.08 as the initial peace-talk euphoria faded, yet gold held firm — a classic safe-haven divergence.
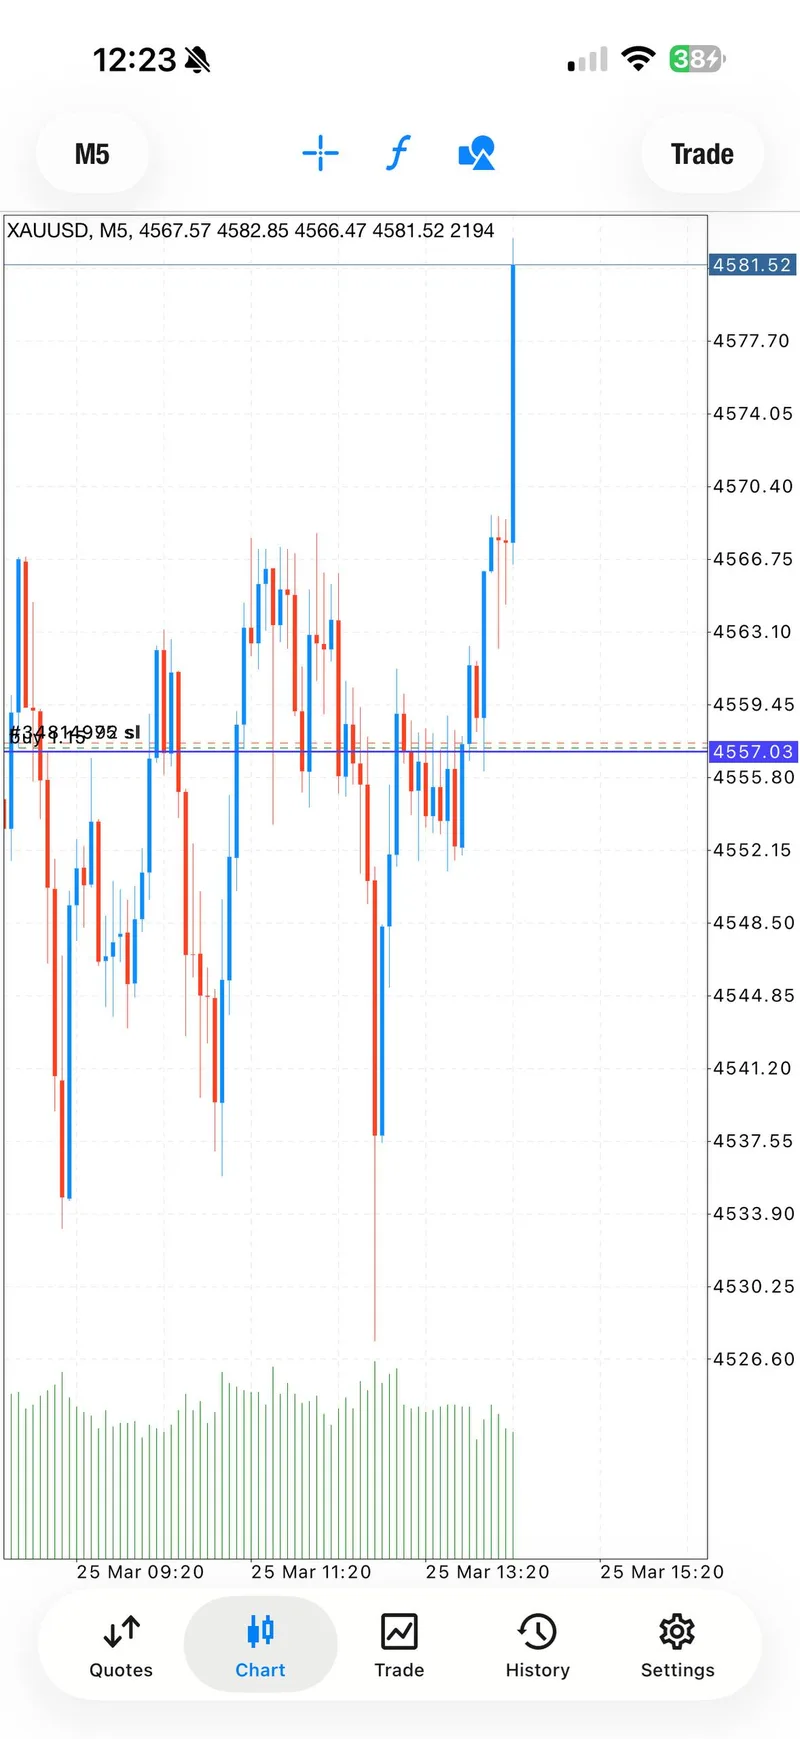
The intraday range of $4,489–$4,545 during the signal window expanded sharply after the Trump peace talk headlines, with gold eventually pushing to $4,584.82 before settling at $4,557.67. This was not a thin-market spike — it was a broad-based breakout confirmed by institutional volume.
Why The Tone Changed So Fast#
Monday's session was a $165 range that went nowhere — gold closed flat at $4,407 after round-tripping from its highs. On Tuesday, everything changed in a matter of hours.
The Peace Talk Reversal#
The catalyst arrived in two waves. First, Trump announced that the United States was entering direct peace negotiations with Iran regarding Operation Epic Fury — the joint US-Israel military campaign that has been reshaping Middle East energy markets since February 28. Oil markets reacted first: Brent crude briefly spiked to $104.49 on expectations that a ceasefire could ease the Strait of Hormuz partial blockade.
Then Iran officially denied any peace talks were occurring.
The denial flipped the script entirely. Markets that had briefly priced in de-escalation suddenly had to reprice continued conflict risk. Gold, already bid on safe-haven flows, surged as the one asset class that benefits from uncertainty in either direction: peace talks create dollar weakness (gold up), and failed peace talks create risk-off flows (also gold up).
Why Gold Won Both Sides of the Headline#
This is the defining characteristic of a bull market regime. In consolidation, gold gets pulled in both directions and closes flat — exactly what happened Monday. In a bull regime, gold finds a reason to rally no matter what the headline says. Tuesday proved the regime had shifted: gold held its entire $150 gain even after the initial catalyst was invalidated.
The broader macro context supported the breakout. The Fed held rates at 3.50%–3.75% on March 18 with an 8-2 vote — Miran and Waller dissented in favor of cutting. The next rate move is not expected until September, and the Fed explicitly cited Iran war inflation risk as a reason to "wait and see." That uncertainty is gold's fuel. Prior-day economic data painted a weakening picture: ADP employment came in at just 9,000 (extremely weak) and Philly Fed at -17.3, reinforcing the soft-landing-or-worse narrative that keeps gold bid.
Technical Outlook#
Key Levels#
| Level | Price |
|---|---|
| Day Open | ~$4,407 |
| Day High | $4,584.82 |
| Day Close | $4,557.67 |
| Signal Zone | $4,557–$4,561 |
| 50 DMA | $5,003 |
| 200 DMA | $4,260 |
| All-Time High | $5,602 |
Structure Analysis#
Gold closed well above the 200-day moving average ($4,260), which has acted as structural support throughout the correction. The price is now 7.0% above this level — a comfortable cushion that confirms the long-term uptrend remains intact.
However, the 50 DMA at $5,003 sits 9.4% above the current price. This gap is a bearish signal in the short term — it means the recent correction has pulled gold far enough below its medium-term average that a full recovery will require sustained buying pressure. The gap between price and the 50 DMA typically narrows either through price rallying (bullish resolution) or the moving average declining toward price (time-based mean reversion).
The correction from the $5,602 all-time high stands at roughly -18.7% at the March lows, having recovered to -12.7% month-to-date as of Tuesday's close. The regime change to bull market suggests the worst of the correction may be behind, but the 50 DMA overhead will act as resistance for any sustained rally attempt.
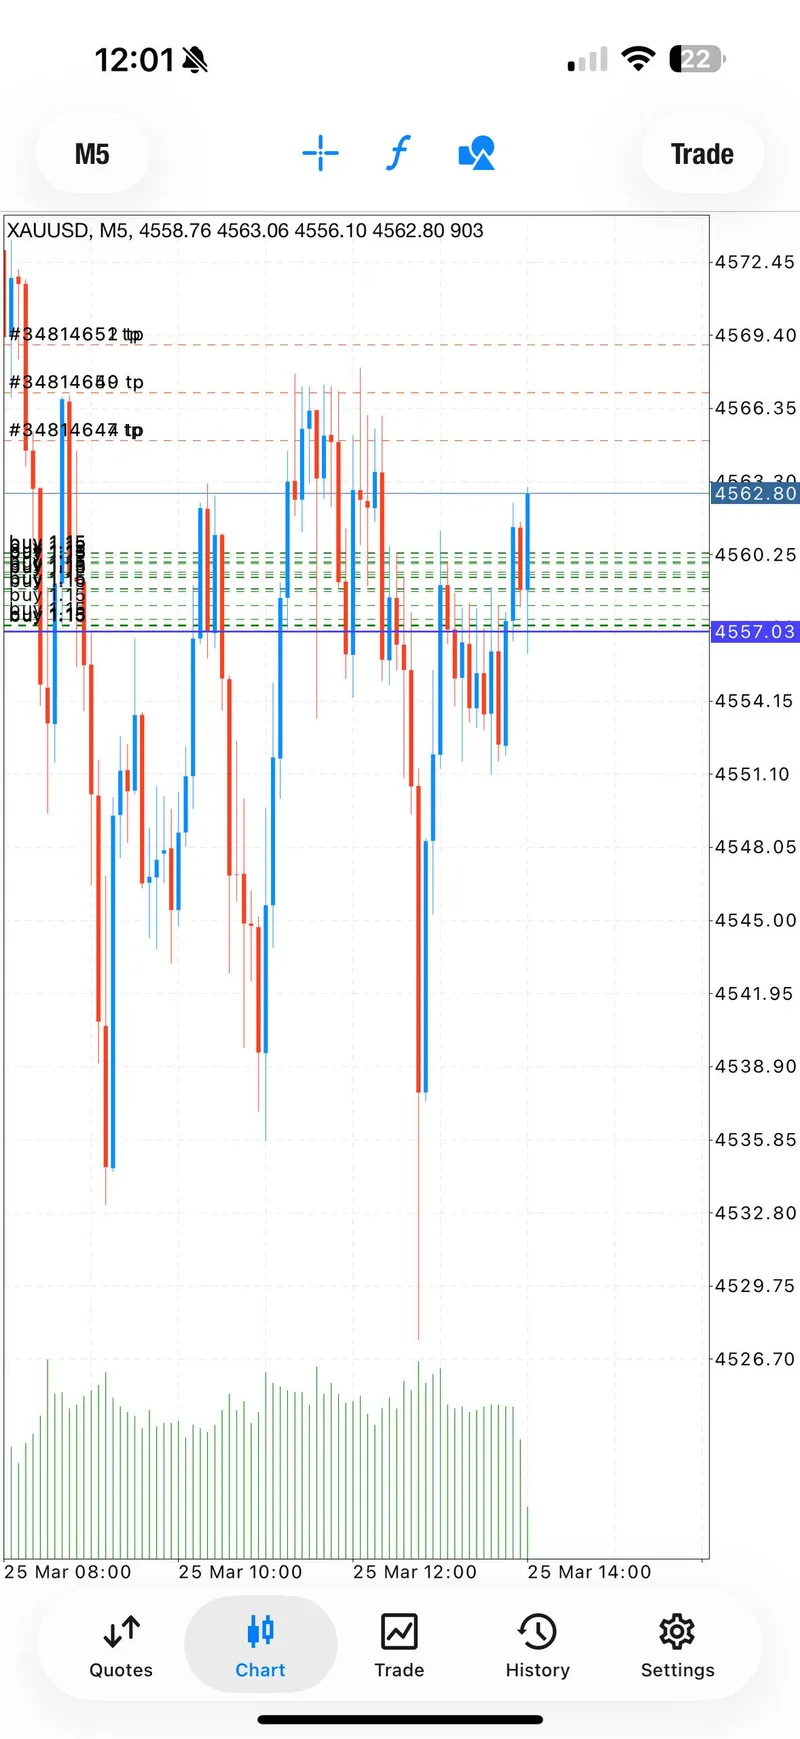
Intraday support sits at $4,489 (session low) and the $4,407 zone (Monday's close, tested twice). Resistance is at $4,584.82 (session high) and the psychological $4,600 level. As noted in the March 20 gold trading analysis, the 200 DMA has consistently attracted buyers during this correction — Tuesday's rally from well above that level suggests the market no longer needs to test it to find demand.
Trading Signals#
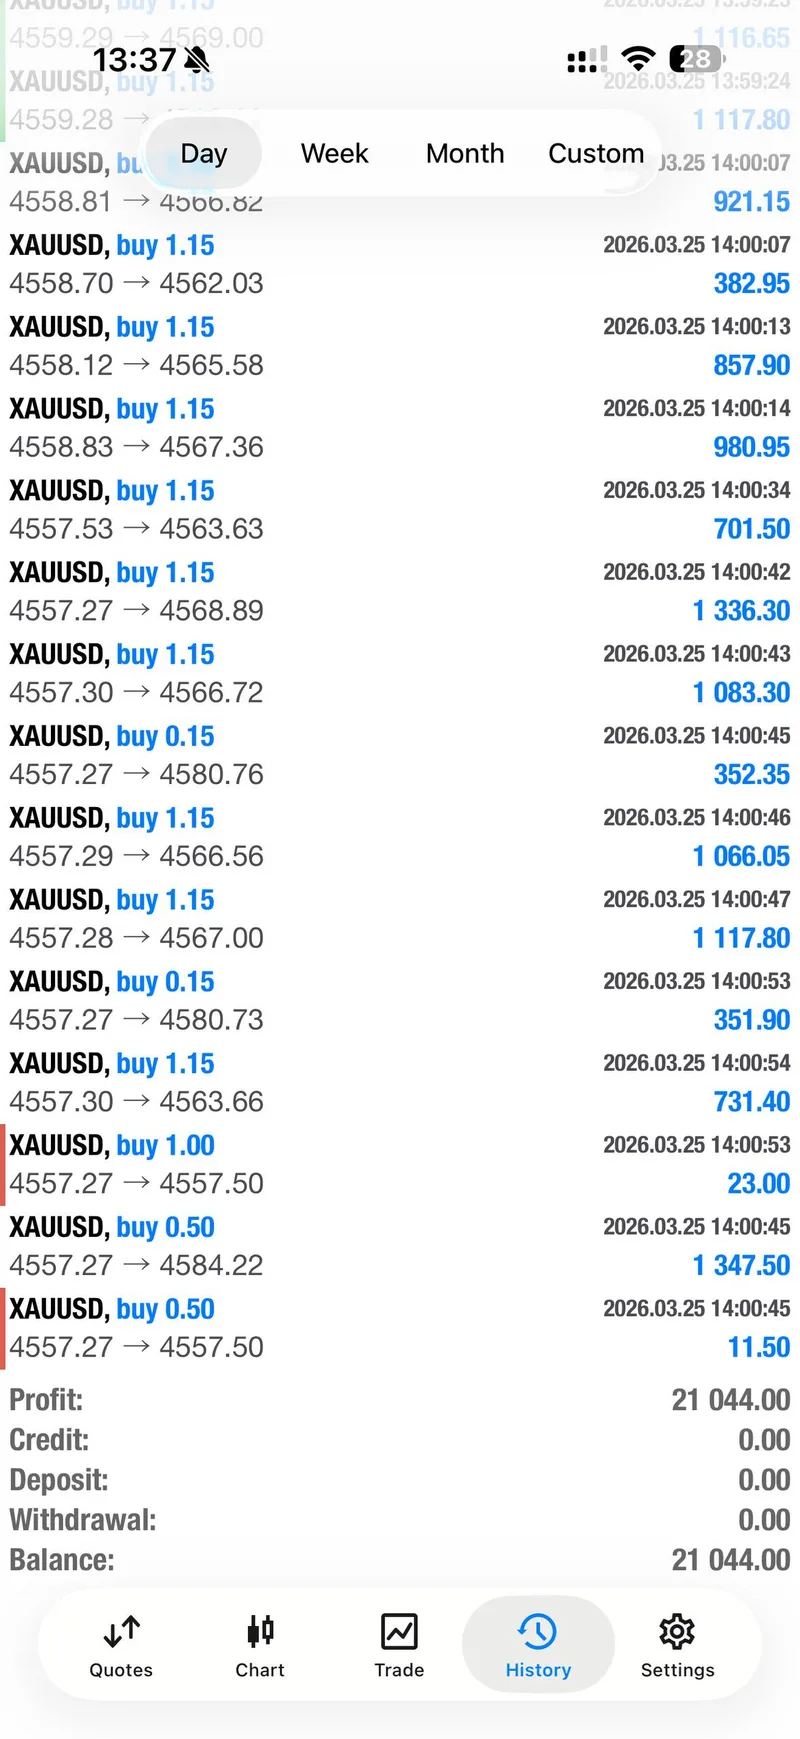
One BUY signal was issued on March 25, and it was surgical in its precision.
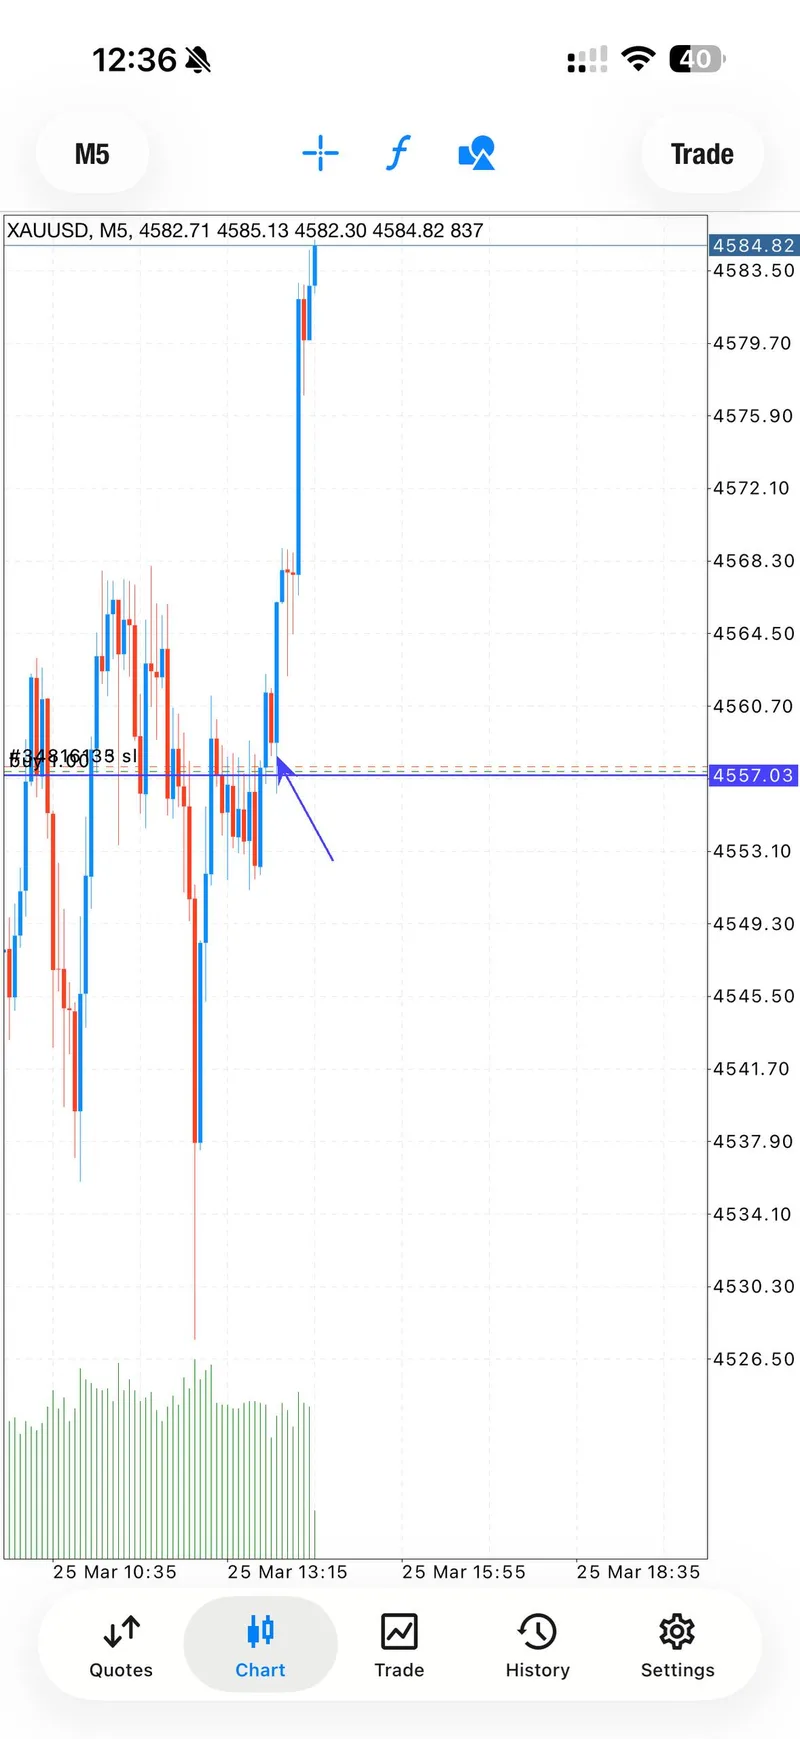
Signal 1 — BUY at $4,557–$4,561 (10:59 UTC)#
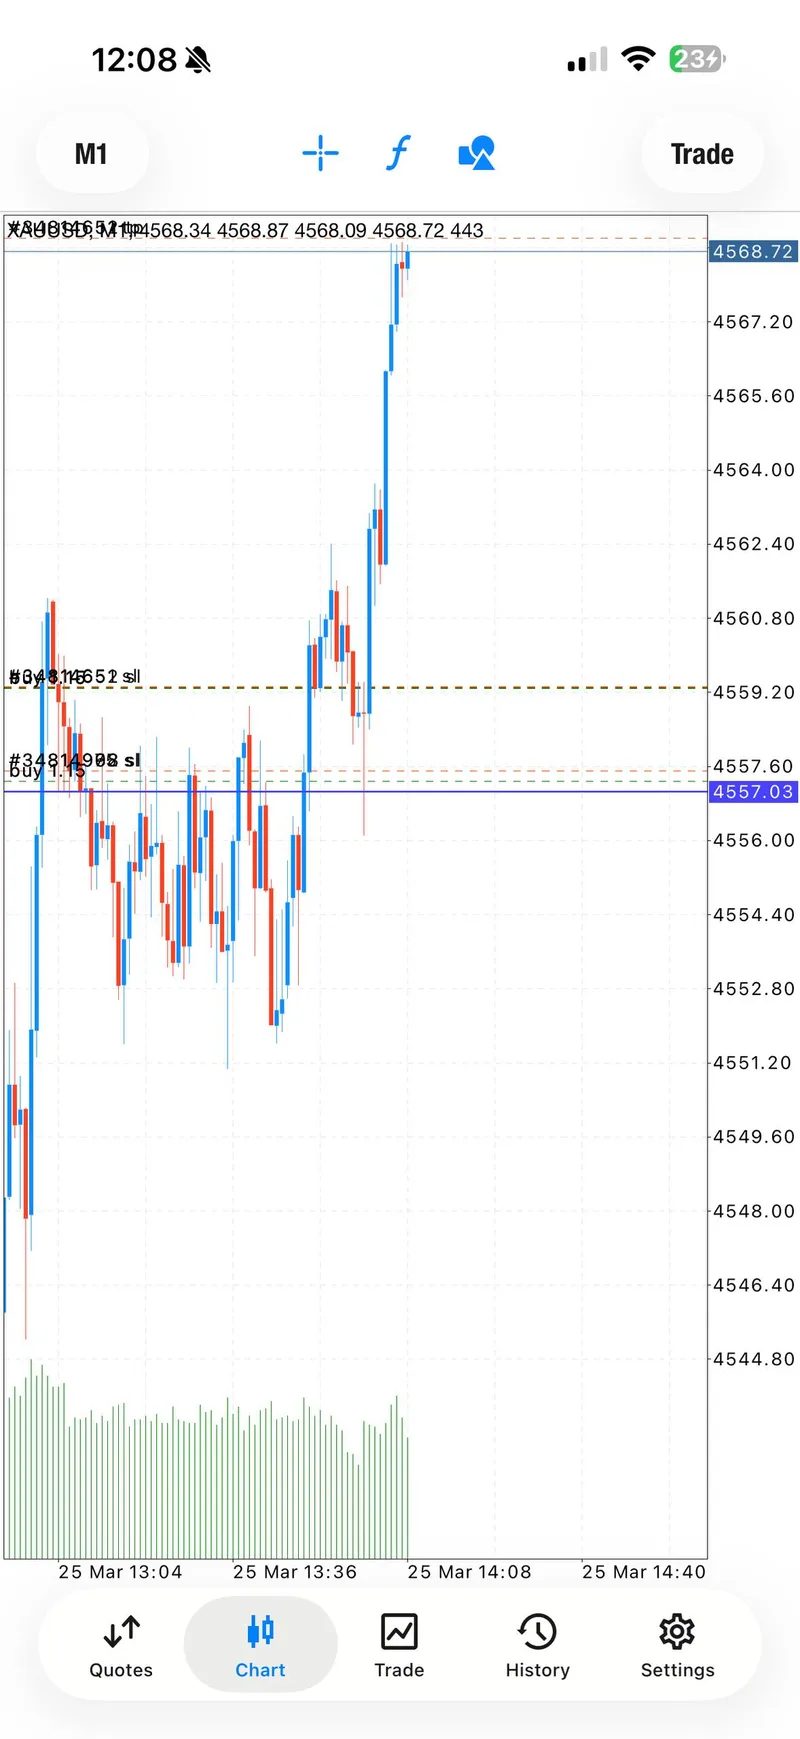
Entry zone: $4,557–$4,561 | Stop loss: $4,552 | Targets: $4,563 / $4,565 / $4,567 / $4,569 / Open
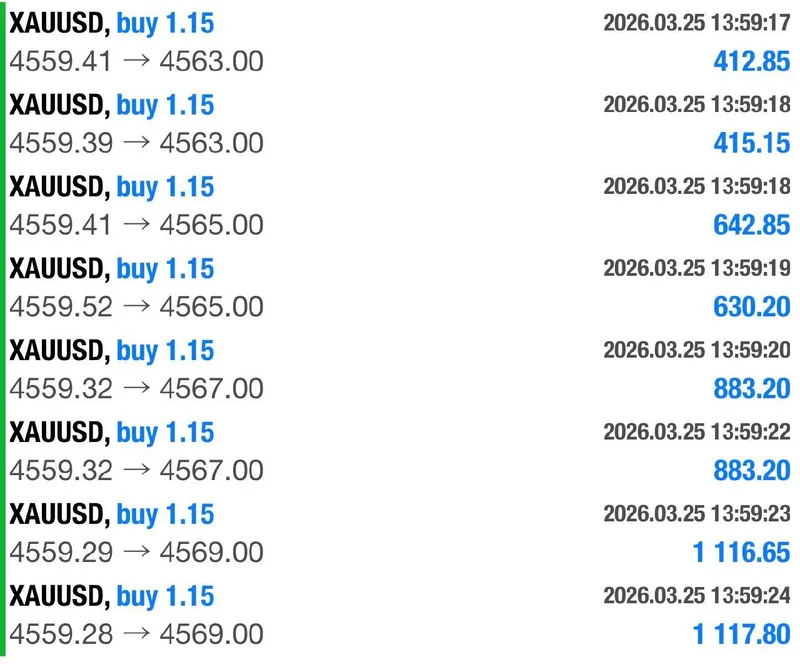
At 10:57 UTC, the "Ready Signal" alert went out to the community. Two minutes later, the full signal was published: buy gold in the $4,557–$4,561 zone with a tight $5–$9 stop loss. Mo entered with multiple positions at 1.15 lots each, filling in the $4,557.27–$4,559.52 range — a $2.25 spread across eight entries.
This was a classic sniper entry. The zone was just $4 wide. In a market that moved $150 in a single session, selecting a $4 window for entry is the trading equivalent of threading a needle at full speed. The fills confirm that Mo's entries clustered within $2.25 of each other — extreme precision that maximizes position efficiency.
The first target at $4,563 was hit by 11:02 UTC — three minutes after the signal. By 11:03, Mo called "Flyyyin!" and instructed the community to move stops to breakeven. From that moment on, every position was running at zero risk.
The difference between a good trader and a great one shows up in moments like this. Moving to breakeven after the first target meant that no matter what happened next — whether gold reversed $50 or rallied $50 more — the worst possible outcome was breaking even. The risk was eliminated in three minutes flat.
Signal Performance Breakdown#
Target-by-Target Timeline#
| Time (UTC) | Event | Level |
|---|---|---|
| 10:57 | Ready Signal alert | — |
| 10:59 | Full BUY signal published | $4,557–$4,561 |
| 11:02 | Target 1 hit ($4,563) | +$2–$6 per entry |
| 11:03 | Breakeven set — zero risk | All entries protected |
| 11:05 | Target 3 approaching ($4,567) | +$6–$10 per entry |
| 11:22 | Target 4 confirmed, 100+ pips running | $4,569+ |
| 11:24 | 250+ pips across all entries | ~$4,581 |
| 11:37 | 270+ pips — session peak | $4,584.82 |
| 12:38 | Day closed — $21,044 confirmed | Final P&L |
The Numbers That Matter#
The single signal generated $21,044 in confirmed profits across eight entries at 1.15 lots each. From a $5–$9 risk per entry (the distance between entry and stop loss), Mo captured $25+ per entry on the best fills — a reward-to-risk ratio exceeding 4:1.
All four take-profit levels were cleared in sequence, and two entries were left running beyond the fourth target as "open" runners. These captured the final push to $4,584.82, adding an additional 230+ pips to the day's total of 270+.
By 12:38 UTC, Mo posted: "$21,000 DAY with sniper entries. Closing the day." The session was complete — from signal to close — in under two hours of active trading. One entry zone, four targets hit, 270 pips captured, $21,044 banked.
Execution Lessons#
The Sniper Entry Philosophy#
Tuesday demonstrated why Mo waits for the perfect setup rather than trading every fluctuation. Monday required four signals to navigate the volatile consolidation and produced $15,175. Tuesday needed just one — because the setup was clean, the conviction was high, and the execution was flawless.
The entry zone of $4,557–$4,561 was just $4 wide. The fills at $4,557.27–$4,559.52 confirm that all eight entries landed within $2.25 of each other. That level of precision is what separates signal-driven trading from guessing.
Zero-Risk After the First Target#
The most important decision of the day was not the entry — it was the risk management after entry. Moving all eight positions to breakeven after the first target hit at 11:02 transformed the trade from a speculative bet into a free ride. Here is the sequence:
- Enter at $4,557–$4,561 with $4,552 stop (risking $5–$9 per entry)
- First target hits at $4,563 — lock partial profits
- Move stops to breakeven — risk drops to zero
- Let runners ride — targets 2, 3, and 4 all hit with zero downside exposure
This is the same playbook highlighted in the March 19 market analysis: aggressive entries paired with conservative risk management. The math is elegant — when your downside is zero and your upside is open-ended, time works entirely in your favor.
Why One Signal Outperformed Four#
Compare Tuesday to Monday: four signals on March 24 produced $15,175 with one stop-out. One signal on March 25 produced $21,044 with zero stop-outs. The difference was not luck — it was selectivity. Mo waited for the regime to confirm before firing, and when the setup materialized at 10:59, every dollar of conviction went into a single entry zone.
Fewer signals with higher conviction will always outperform more signals with divided attention. Browse the daily gold trading reports archive for more examples — March 25 may be the cleanest demonstration of this principle in 2026 so far.
What The Day Means Going Forward#
Regime Shift Confirmed#
The regime change from consolidation to bull market is the most significant technical development since the correction began from the $5,602 all-time high. Bull regimes tend to persist — once momentum and sentiment align in gold's favor, the path of least resistance is higher until proven otherwise.
Key events to watch this week:
- PCE data later this week will test whether inflation supports or undermines the gold rally
- Jobless Claims will signal labor market health — weakness supports rate-cut expectations and gold
- Iran developments remain the primary wildcard; any escalation or confirmed talks will move gold $50+ in minutes
- Fed rhetoric — with September the earliest cut date, any hawkish surprises could cap the rally temporarily
Community Results#
The March 25 signal was not a solo win. Members across every account size captured real profits from the same entry zone:
"Lets gooooo wow what an entry always love you moo" — Community member following the BUY signal in real time
"King Mo strikes again!!!" — Member celebrating after all four take-profit targets were cleared
"Thanks Genius, it's flying higher. Epic timing" — Trader who entered at the $4,557 zone and watched gold run to $4,584
"Flying in blues. All thanks to gold king MO" — Member after locking profits on the day's rally
"Thnks Mo very happy" — Community member who followed the signal on small lot sizes
"Thanks boss, Am on low risk" — Trader who moved to breakeven after the first target and held runners
"Love it" — Simple appreciation after a $150 gold surge turned into real money
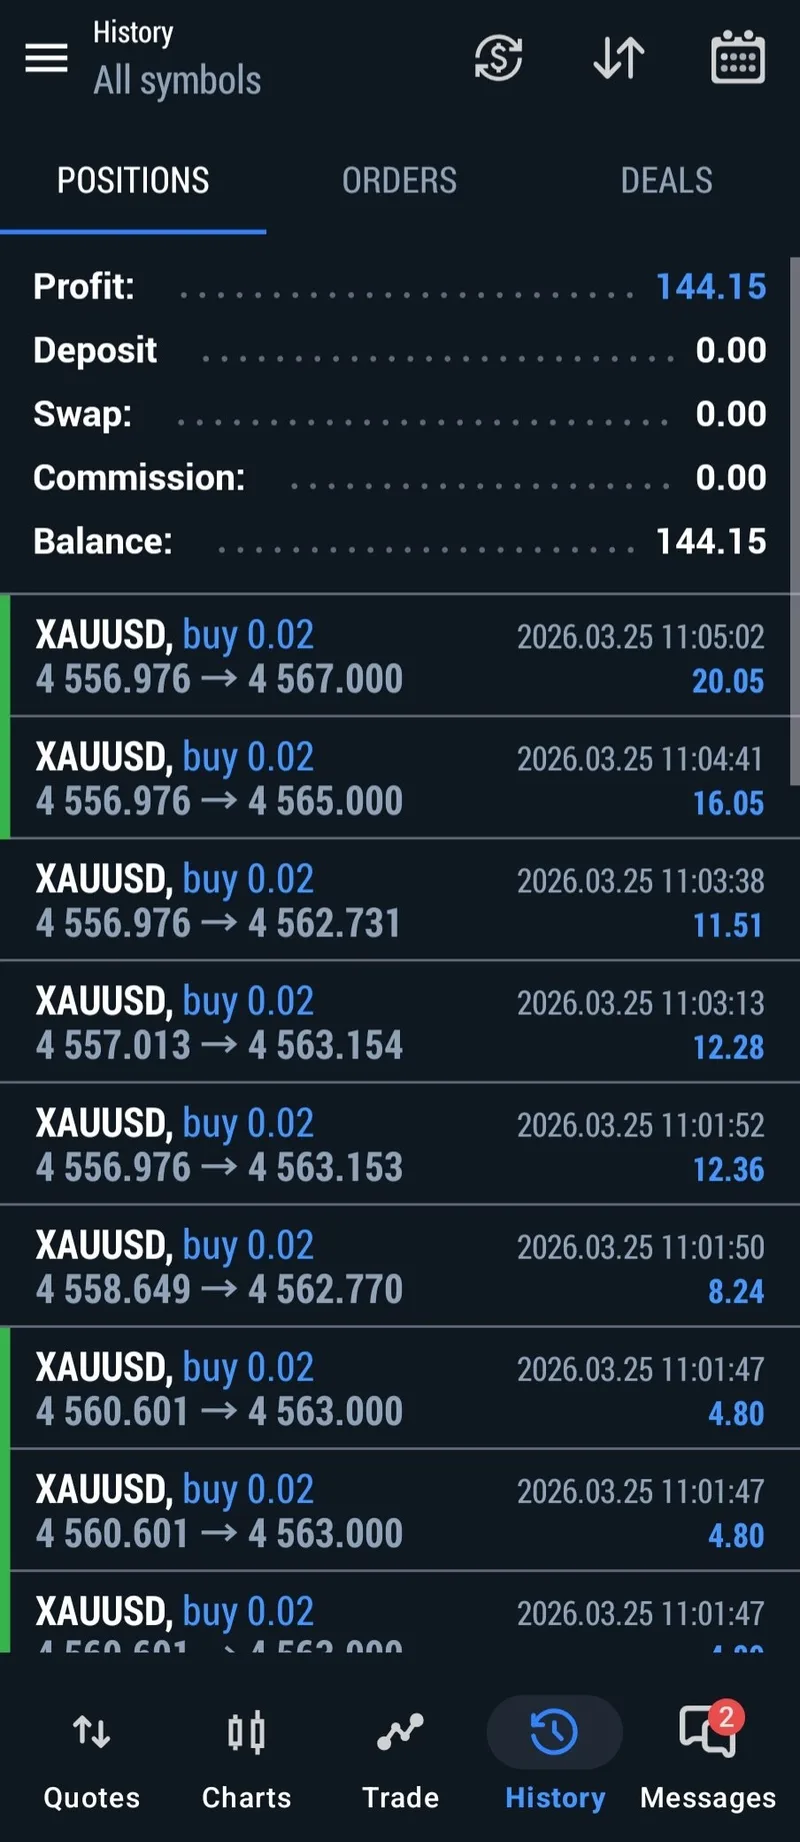
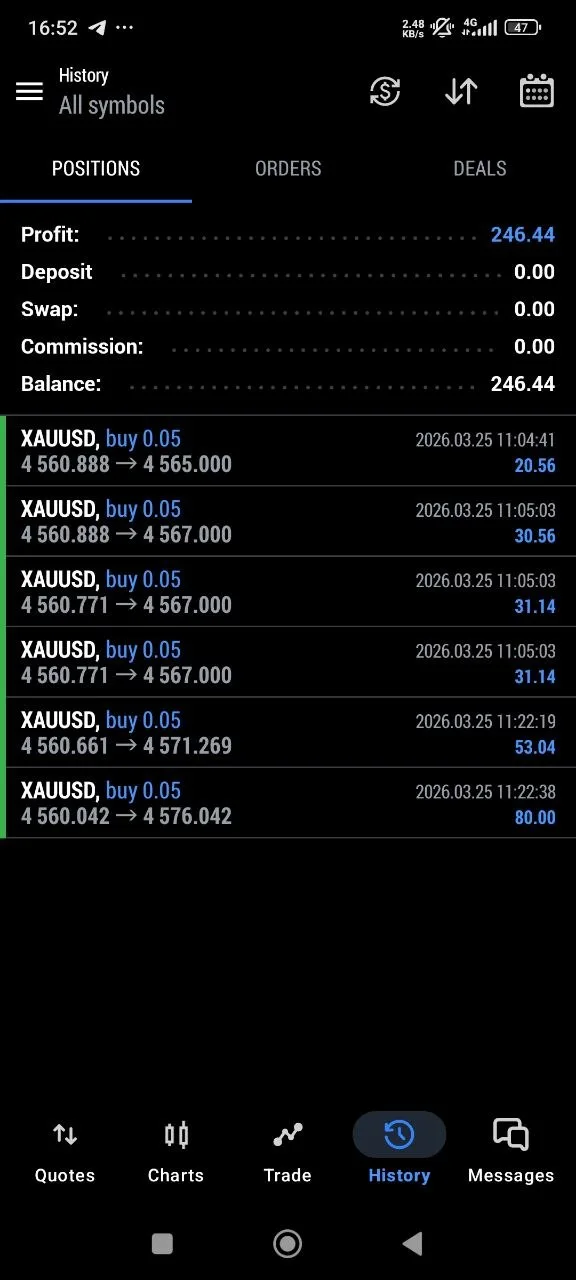
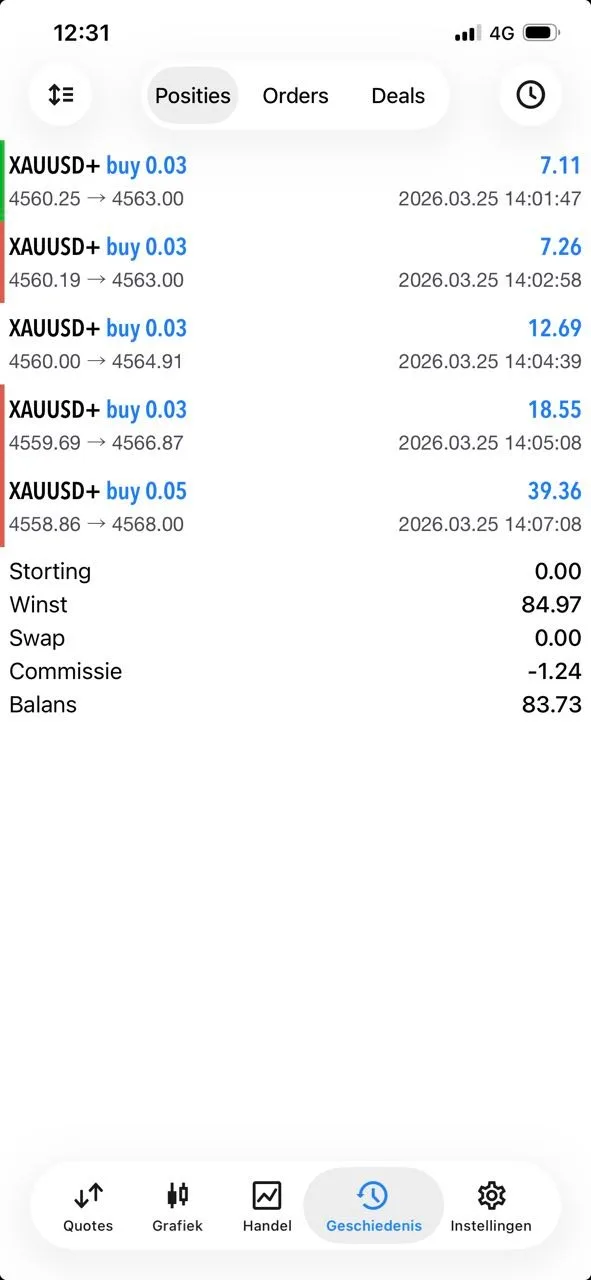
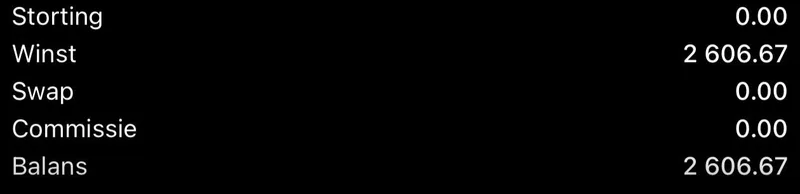
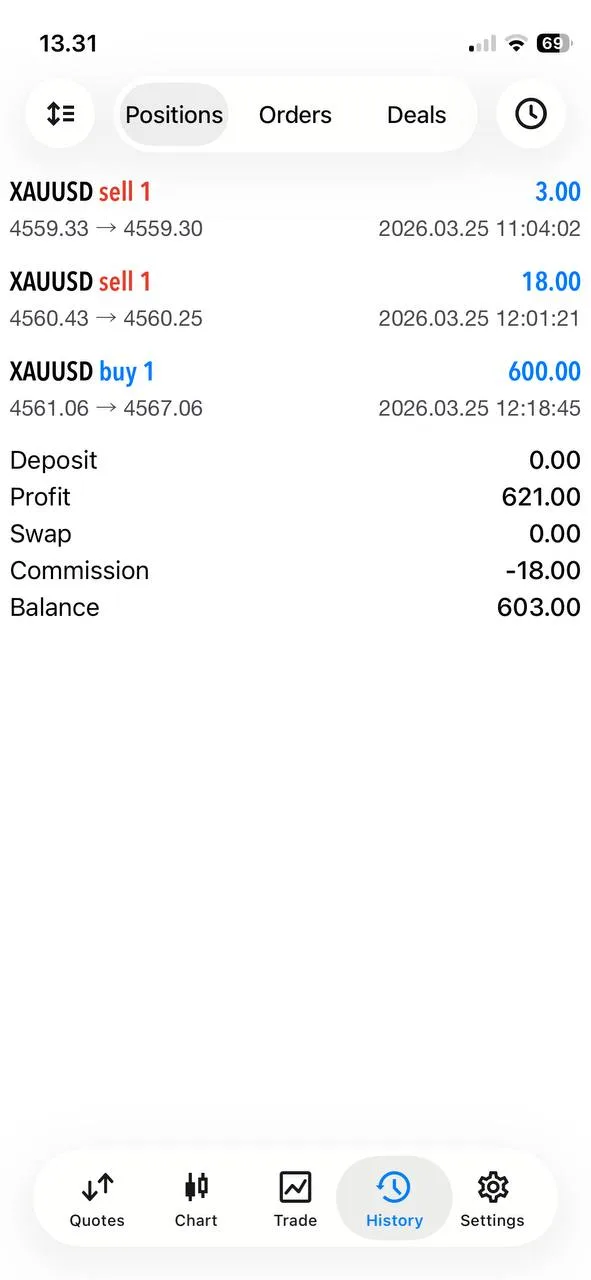
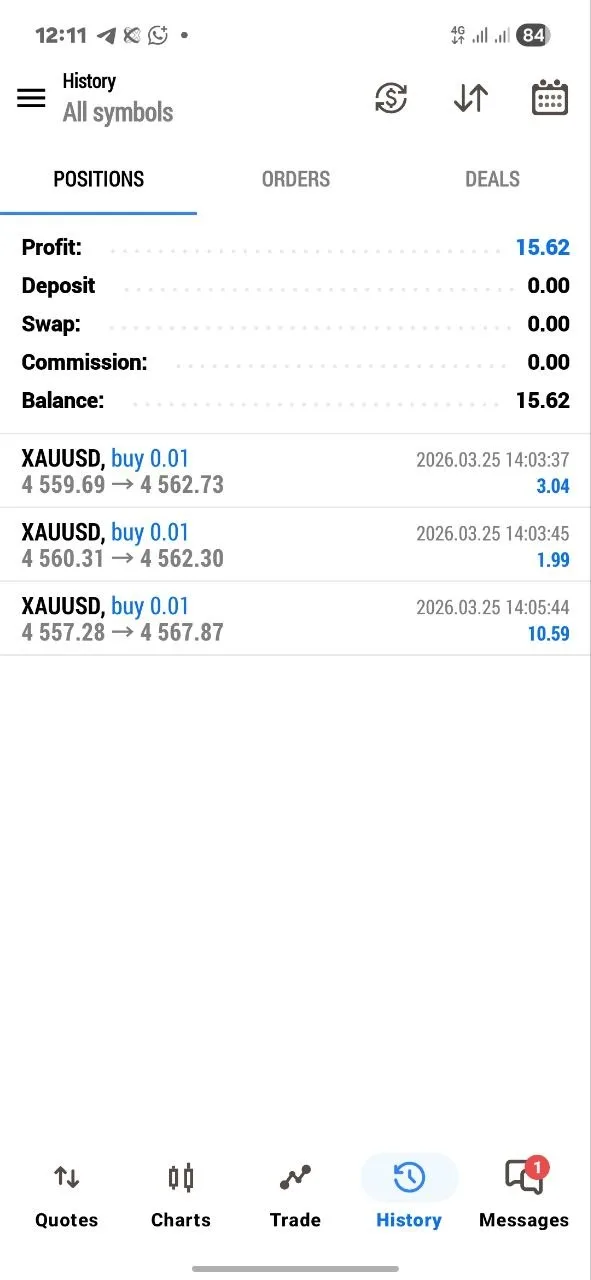
The profit range tells the complete story. A beginner trading just 0.01 lots earned $15.62 — proof that the signals work at any account size. A member on 0.02 lots captured $144.15. Another on 0.05 lots took home $246.44. A trader running 1.0 lot locked $621. On the European side, one member earned €84.97 on small lots, and another member captured €2,606.67 — the largest community result of the day.
From $15 to €2,606, every account size participated in the same breakout. That is what a bull market regime change looks like when the entire community is positioned correctly.
Risk Context#
Gold remains in a correction from its all-time high — down 12.7% month-to-date despite Tuesday's rally. The 50 DMA at $5,003 is still 9.4% overhead, which means the market has significant ground to recover before the technical picture turns fully bullish. The regime change is encouraging, but it does not guarantee that the correction is complete.
This is not financial advice. Trading gold and other financial instruments carries significant risk. Past performance, including the results shared in this report, is not indicative of future results. Never trade with capital you cannot afford to lose. Always use a stop loss and proper position sizing relative to your account balance.
FAQ#
Why did gold surge $150 on March 25?#
The primary catalyst was geopolitical. Trump announced peace talks with Iran, which briefly moved oil and gold markets. When Iran officially denied the talks, gold held its gains because the uncertainty itself drives safe-haven demand. The move was amplified by a regime shift from consolidation to bull market — once momentum turns, gold tends to continue in that direction.
How was the $4,557 entry zone identified?#
Mo uses a combination of institutional order flow analysis, key support and resistance levels, and real-time momentum indicators. The $4,557–$4,561 zone represented an area where buy-side volume was clustering during the initial breakout. The tight $4 entry window and $5–$9 stop loss reflect high conviction in the level's significance.
What does moving to breakeven mean for risk management?#
After the first take-profit target is hit, the stop loss on remaining positions is moved to the entry price. This means that even if gold reverses completely, those positions close at zero profit instead of at a loss. It transforms an active trade into a zero-risk position with open-ended upside — the ideal configuration for letting winners run.
Can small accounts benefit from these signals?#
Absolutely. A member trading 0.01 lots — the smallest standard position — earned $15.62 from the March 25 signal. A 0.02 lot trader captured $144.15, and a 0.05 lot trader made $246.44. The signals are identical regardless of position size; the dollar amounts scale proportionally with how much capital you allocate.
What is the gold outlook after this regime change?#
Bull market regimes in gold tend to be self-reinforcing. Safe-haven demand, geopolitical uncertainty, and potential rate cuts all support higher prices. The immediate resistance sits at $4,584 (session high) and $4,600 (psychological level). The 50 DMA at $5,003 represents the medium-term ceiling. If PCE data and jobless claims come in soft later this week, gold could push toward $4,600–$4,700 before encountering serious resistance.
How do I access these trading signals?#
Join the Gold Trader Mo community for real-time gold trading signals, market analysis, and educational content. Signals are shared with clear entry zones, stop losses, and take-profit targets — exactly like the March 25 setup that generated $21,044 in a single session.
Connect with Gold Trader Mo#
Stay connected for daily gold trading signals, market analysis, and community updates:
- Website: goldtradermo.net
- Telegram: @GTMOBest — Free signal channel
- Daily Reports: Browse all daily gold trading reports
DM @GTMOBest on Telegram to join the community and receive real-time trading signals like the March 25 setup that turned one entry zone into $21,044.
The information provided in this report is for educational and informational purposes only. It does not constitute financial advice. Always conduct your own research and consult with a licensed financial advisor before making trading decisions.