Daily Gold Trading Report — March 24, 2026#
Gold closed flat at $4,407 on Monday — but the session was anything but quiet. A $165 intraday range after the Eid weekend gap created the perfect conditions for Mo to issue four BUY signals, ride the morning rally, survive a stop-out, re-enter three times, and lock $15,175 in confirmed profits before gold drifted back to where it started. If you missed Friday's $15,249 session during the Eid crash, this report picks up exactly where that one left off.
Market Snapshot#
| Metric | Value | Change |
|---|---|---|
| XAUUSD Close | $4,407.01 | -0.01% (flat) |
| Fed Funds Rate | 3.50%–3.75% | Held (March 18) |
| DXY (Dollar Index) | 99.34 | +0.39% |
| US 10-Year Yield | 4.39% | +0.05% |
| WTI Crude Oil | $91.38 | +3.66% |
| VIX | 26.90 | +2.87% |
| Gold Regime | Consolidation | Below 50 DMA, above 200 DMA |
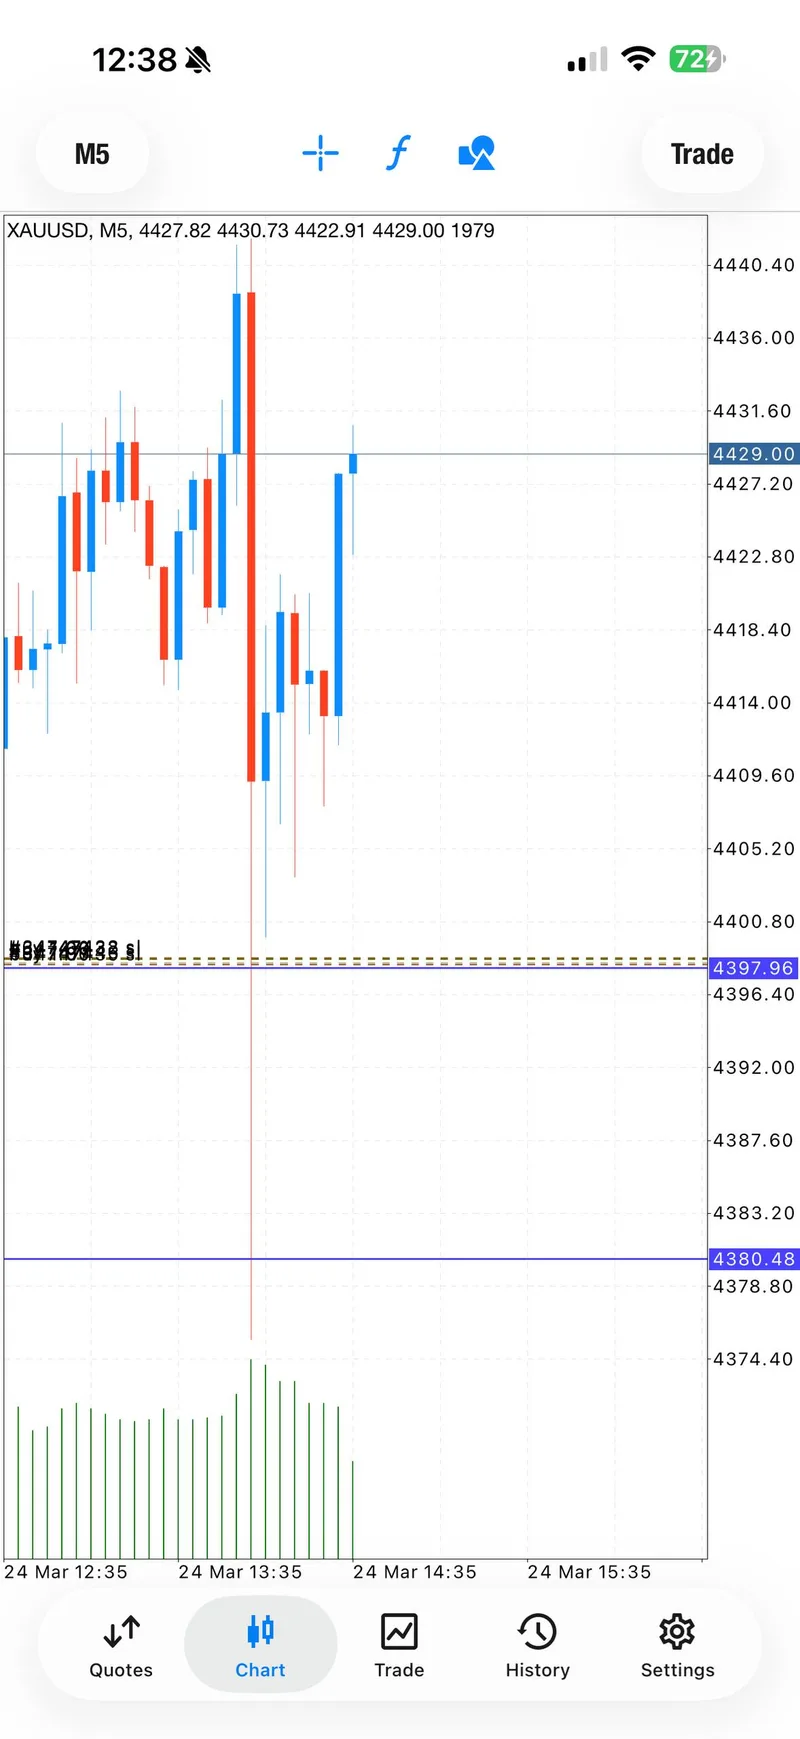
Gold opened the week after a punishing $87 weekend gap — down from Friday's $4,494 close to the $4,407 zone. During the session, gold rallied sharply to an intraday high near $4,572 before fading all the way back to close at $4,407.01 — essentially unchanged from the previous session. The intraday range exceeded $165, creating extreme volatility that rewarded precise timing and punished overholding.
The macro setup explained the wild swings: VIX at 26.90 (+2.87%) signaling elevated fear, WTI crude surging 3.66% to $91.38 on renewed energy concerns, and the March 18 FOMC hold at 3.50%–3.75% keeping rate uncertainty alive. The dollar firmed slightly at 99.34 (+0.39%) with the 10-year yield ticking up to 4.39% — headwinds that ultimately pulled gold back from its intraday highs. The regime classification is consolidation: gold is stuck between war-driven safe-haven demand and dollar/yield pressure.
Why The Tone Changed So Fast#
Friday's $239 crash dropped gold from $4,733 to $4,494. Over the Eid weekend, gold gapped down another $87 to the $4,407 zone. Yet on Monday, gold temporarily rallied $165 intraday before fading back to flat.
What drove the wild swings? The Iran war was still raging, Strait of Hormuz still partially blocked, and oil surged 3.66% to $91.38 — all gold-supportive forces. But dollar strength at 99.34 and rising yields at 4.39% provided constant gravitational pull downward. The result was a tug-of-war: safe-haven demand pushed gold up during active trading hours, while rate headwinds dragged it back by close.
Trump's "5-day clock" diplomatic delay on March 24 created the initial optimism that drove the morning rally. But the manufacturing PMI beat at 52.4 reminded markets that the economy was resilient enough to keep rates elevated — and gold gave back its gains.
The lesson for traders: in a consolidation regime, intraday momentum is your friend but the close is your enemy. Mo made $15,175 by trading the moves and closing before the fade. Traders who held expecting a breakout close got nothing.
Technical Outlook#
Key Levels#
| Level | Price |
|---|---|
| Day Open | ~$4,407 |
| Day High | ~$4,572 |
| Day Low | ~$4,395 |
| Pivot | $4,347 |
| R1 | $4,514 |
| R2 | $4,617 |
| 50 DMA | $5,015 |
| 200 DMA | $4,254 |
Structure Analysis#
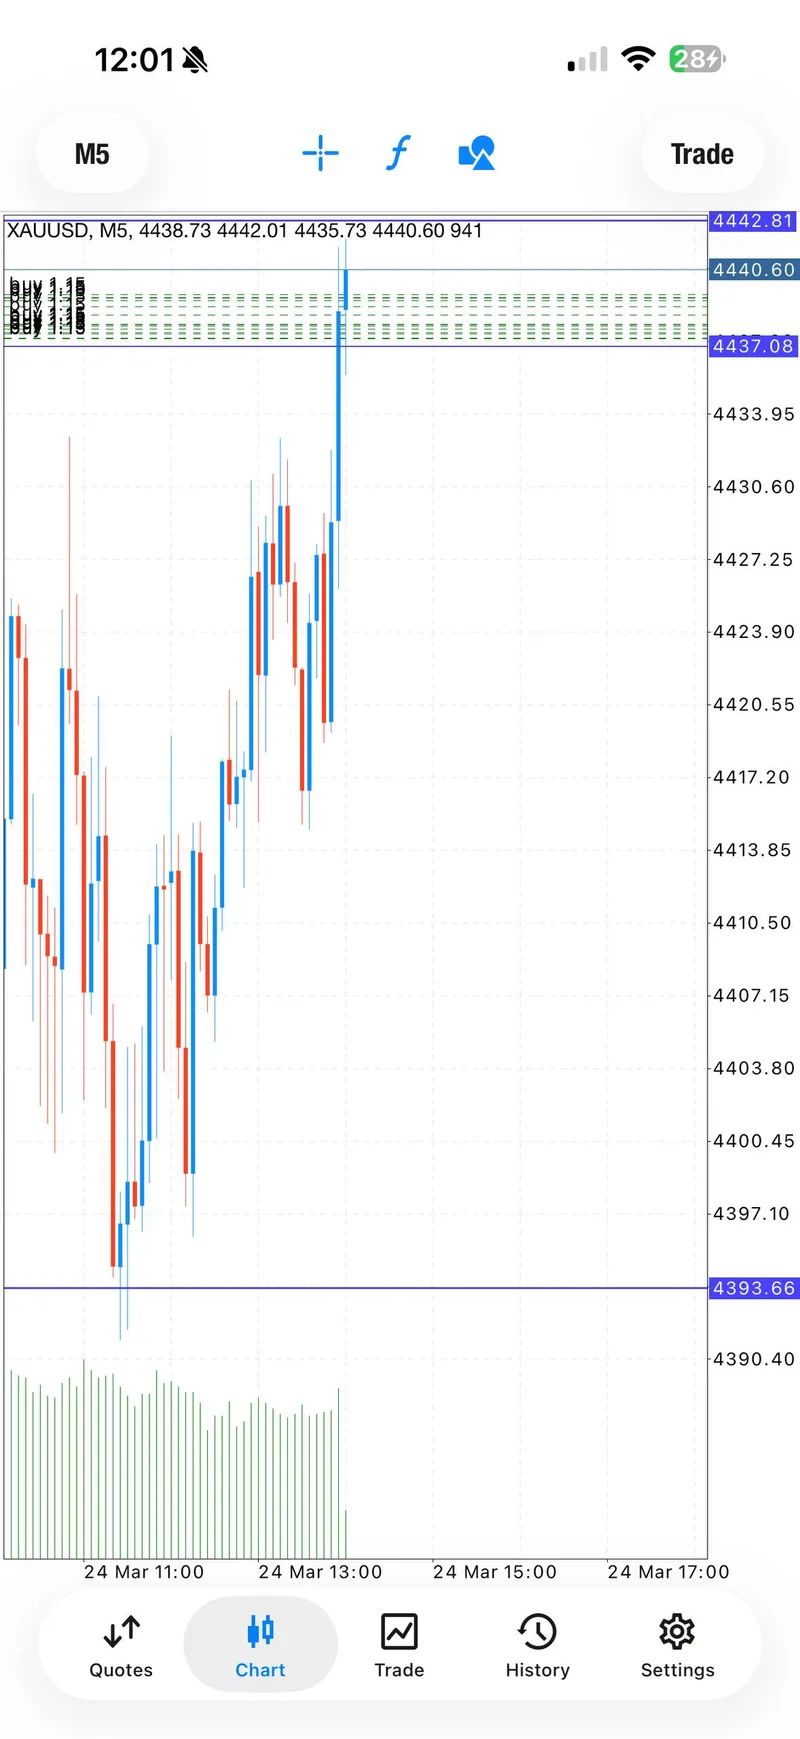
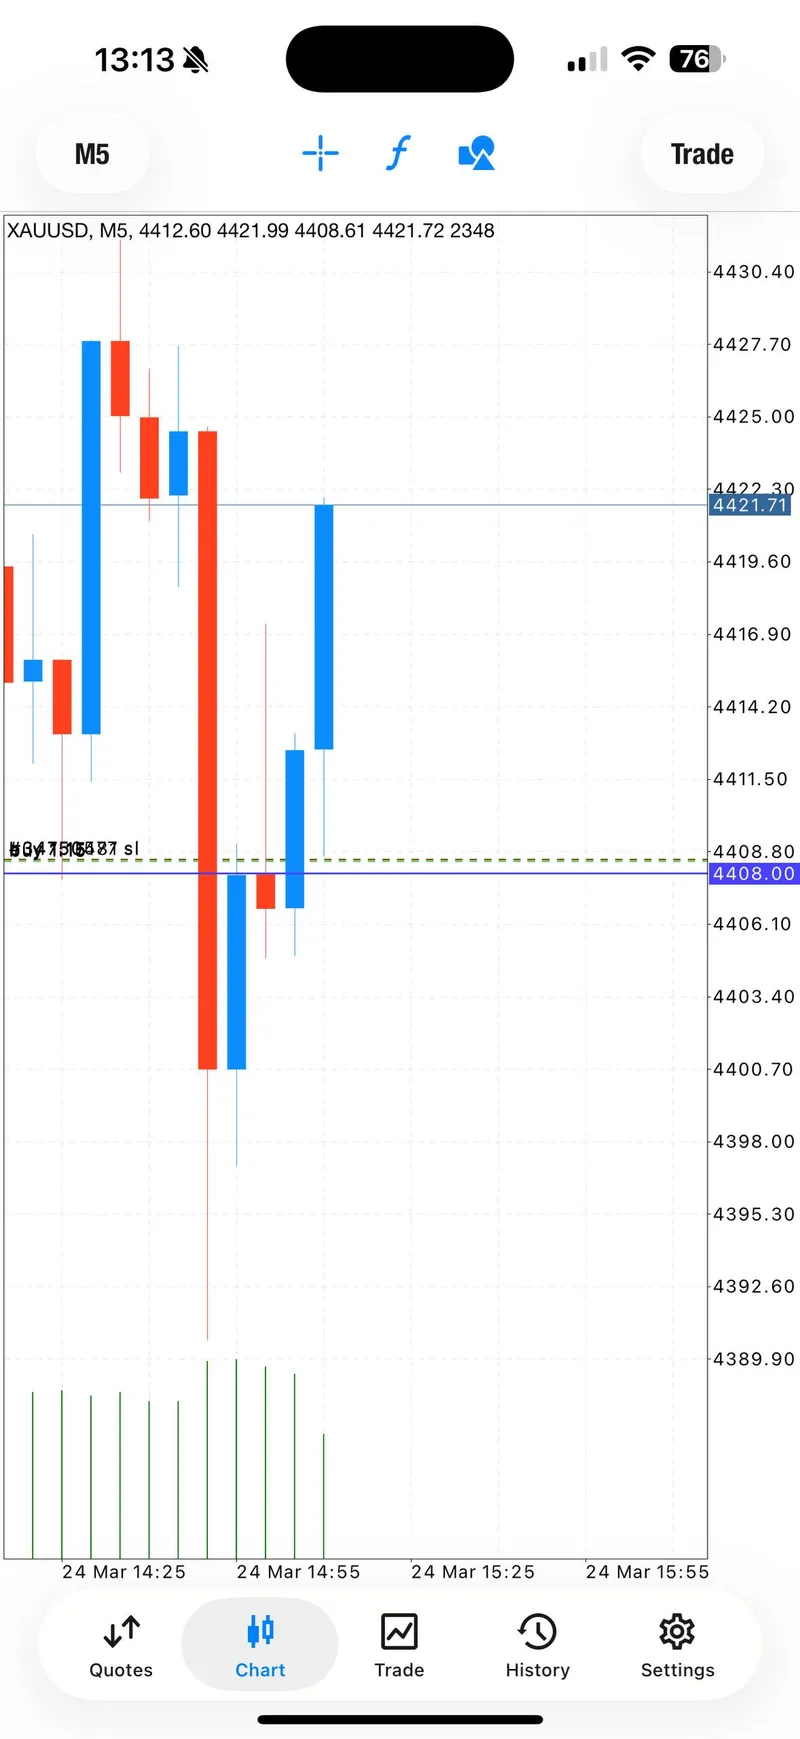
Gold broke above R1 ($4,514) during the morning session, finding initial resistance near $4,572 before reversing hard. The session printed a classic intraday reversal: a strong rally followed by a complete round-trip back to the open. The close at $4,407 sat right on the previous session's close — a consolidation signal, not a breakout.
Volume was exceptional. Mo described the 1-minute candlesticks as "What a volume" — aggressive institutional flows created both opportunity and danger on the shortest timeframes. The $165 intraday range on a flat-close day is characteristic of a market where bulls and bears are in equilibrium with maximum disagreement.
The immediate resistance zone remains at $4,572 (session high). A daily close above $4,514 (R1) would signal genuine bullish momentum. Support sits at $4,395–$4,407 — the zone where gold found buyers on Monday. Below that, $4,347 (pivot) is the next structural level.
Trading Signals#
Four BUY signals were issued on March 24, all following the bullish fundamental bias. No SELL signals — Mo read the momentum correctly and stayed directional all day.
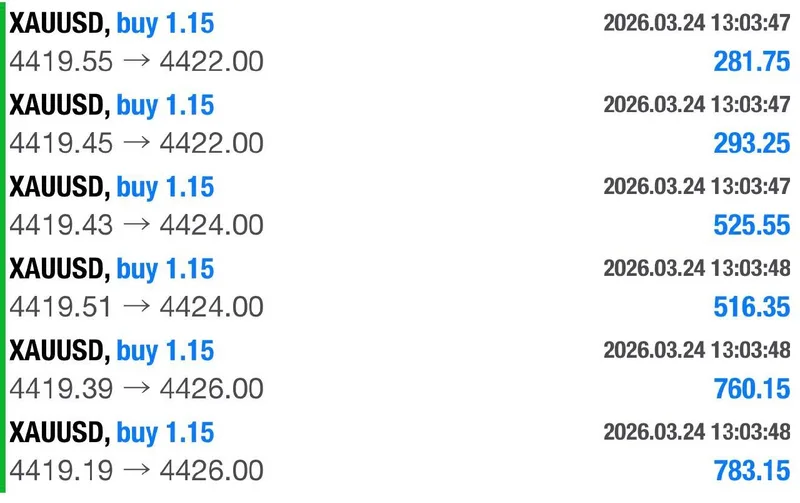
Signal 1 — BUY at $4,419 (10:03 UTC)#
Entry: $4,419.40–$4,416 | SL: $4,413 | TP1: $4,422 | TP2: $4,424 | TP3: $4,426 | TP4: Open
The morning's first signal caught gold at the start of its rally. All three take-profit targets were hit within five minutes — TP1 at 10:06, TP2 at 10:07, TP3 at 10:08. By 10:10, the trade was running 100+ pips from entry.
Mo closed $10,000 in profits from this single signal before the remaining entries hit breakeven at 10:32 UTC. The entry at $4,419 was near the session low, catching the exact moment momentum shifted from consolidation to breakout.
Result: $10,000 realized — all 3 TPs hit
Signal 2 — BUY at $4,439 (10:58 UTC)#
Entry: $4,439–$4,436 | SL: $4,432 | TP1: $4,442 | TP2: $4,444 | TP3: $4,446 | TP4: Open
The second signal came higher, buying into existing momentum. TP1 was hit almost immediately at 11:01, but the extreme 1-minute candle volatility triggered the stop loss at $4,432 just moments later.
This is the reality of high-volume sessions — a wick can take out your stop even when the trend is correct. Mo's risk management was tight: the stop was only $4–$7 from entry, limiting the damage. The lesson is not that the entry was wrong — it is that momentum entries in extreme volatility demand wider stops or faster partial closes.
Result: TP1 hit, then SL hit — partial win, net loss on position
Signal 3 — BUY Re-Entry (11:02 UTC)#
Entry: Market price (low risk, reduced lot size) | SL: Not specified | TP: Open
Immediately after the stop-out, Mo re-entered with lower risk. "Only a few entries, not much, low risk" — this is textbook resilience. Rather than tilting or stepping away, he recognized the trend was still intact and re-entered with discipline.
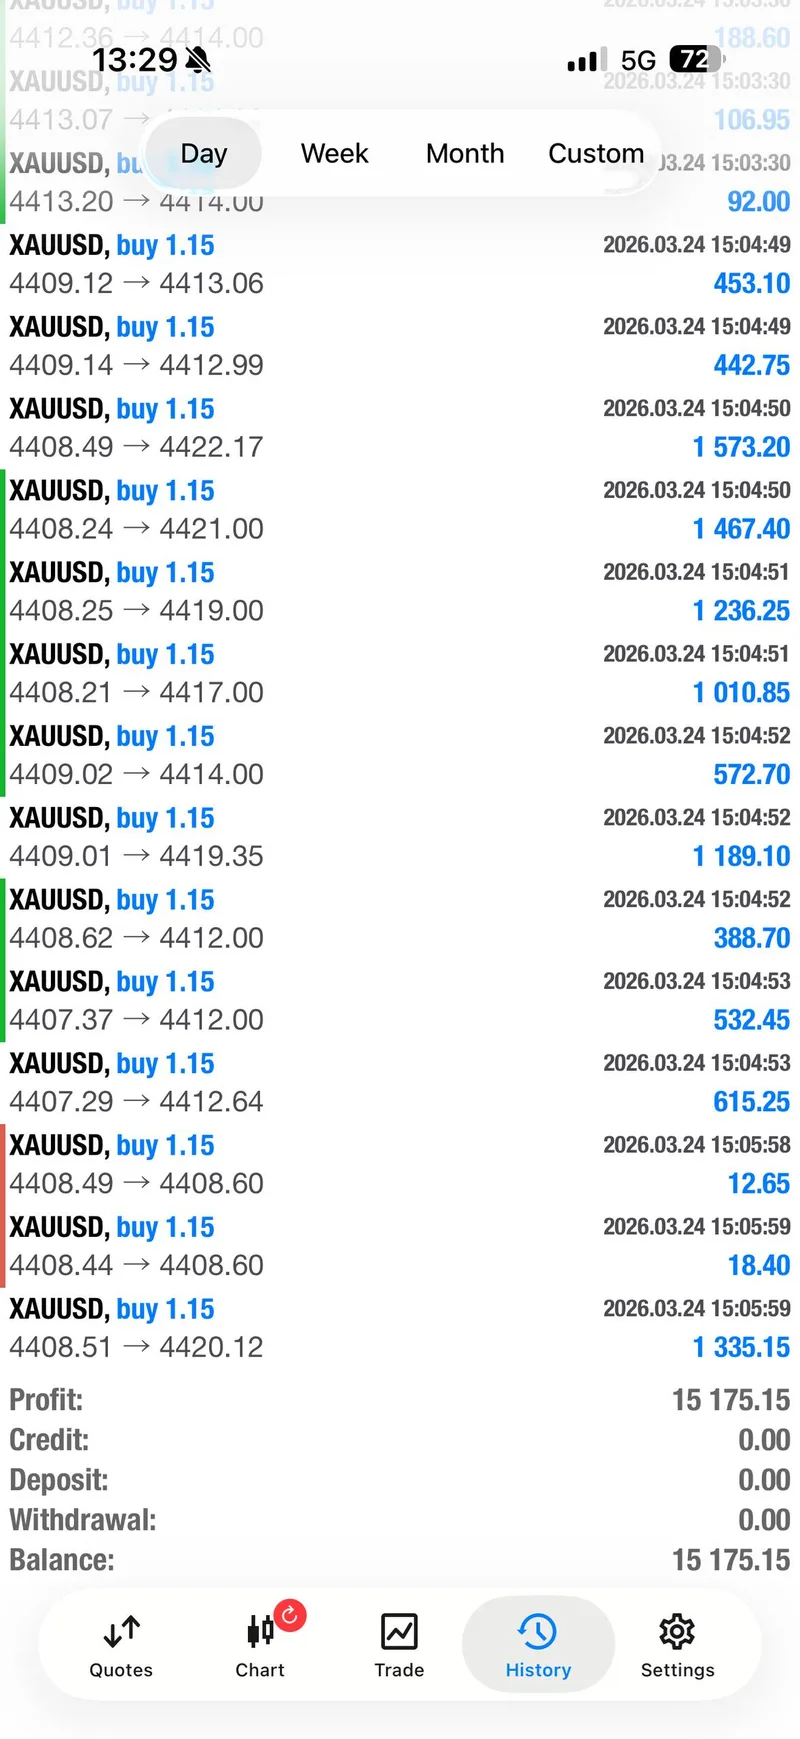
The re-entry caught the next leg of the rally: 100+ pips by 11:04, 150+ pips by 11:04, 200+ pips by 11:10, and ultimately 300+ pips by 11:38. Mo took partial profits along the way, closing multiple entries at $4,428 for approximately 300 pips each.
However, a sharp 1-minute candle drop "wiped my profits" on the remaining positions — Mo described it as "This 1 minute candle that dropped wiped my profits, but I didn't give up!" The remaining entries eventually hit breakeven, leaving Mo roughly where he started Signal 3: net neutral, but with conviction that the bullish thesis was correct.
Result: 300+ pips on partial closes, breakeven on remaining — net approximately flat
Signal 4 — BUY at $4,412 (12:03 UTC)#
Entry: $4,412–$4,408 | SL: $4,402 | TP1: $4,414 | TP2: $4,417 | TP3: $4,419 | TP4: $4,421 | TP5: Open
The final signal of the day — and the one that turned everything around. Mo entered at $4,412 with a tight $10 stop and called it: "One more round, use lower risk."
All four take-profit levels were systematically hit: TP1, TP2, TP3, and TP4 in rapid succession. By 12:14, the trade was running 130+ pips from the lowest entry. At 12:16, it reached 200+ pips. Mo's final confirmation: "And the last one of today went also flying 200+ pips and hit 4 TakeProfits for us!"
This trade's entry at $4,412 was actually lower than Signal 1's entry at $4,419 — suggesting the market had pulled back to offer a better entry. Patience and persistence paid off.
Result: All 4 TPs hit, 200+ pips — the trade that made the day
Signal Performance Breakdown#
| Signal | Direction | Entry | Result | Pips | Dollar Impact |
|---|---|---|---|---|---|
| Signal 1 | BUY | $4,419 | 3 TPs hit, BE on rest | 100+ | +$10,000 |
| Signal 2 | BUY | $4,439 | TP1 hit, then SL | Mixed | Small net loss |
| Signal 3 | BUY | Market | 300+ pips partial, BE | 300+ | ~Flat |
| Signal 4 | BUY | $4,412 | 4 TPs hit | 200+ | +$5,175+ |
| Total | 3 wins, 1 mixed | $15,175 |
Day Type: Resilient recovery
Win Rate: 3 out of 4 signals profitable (75%)
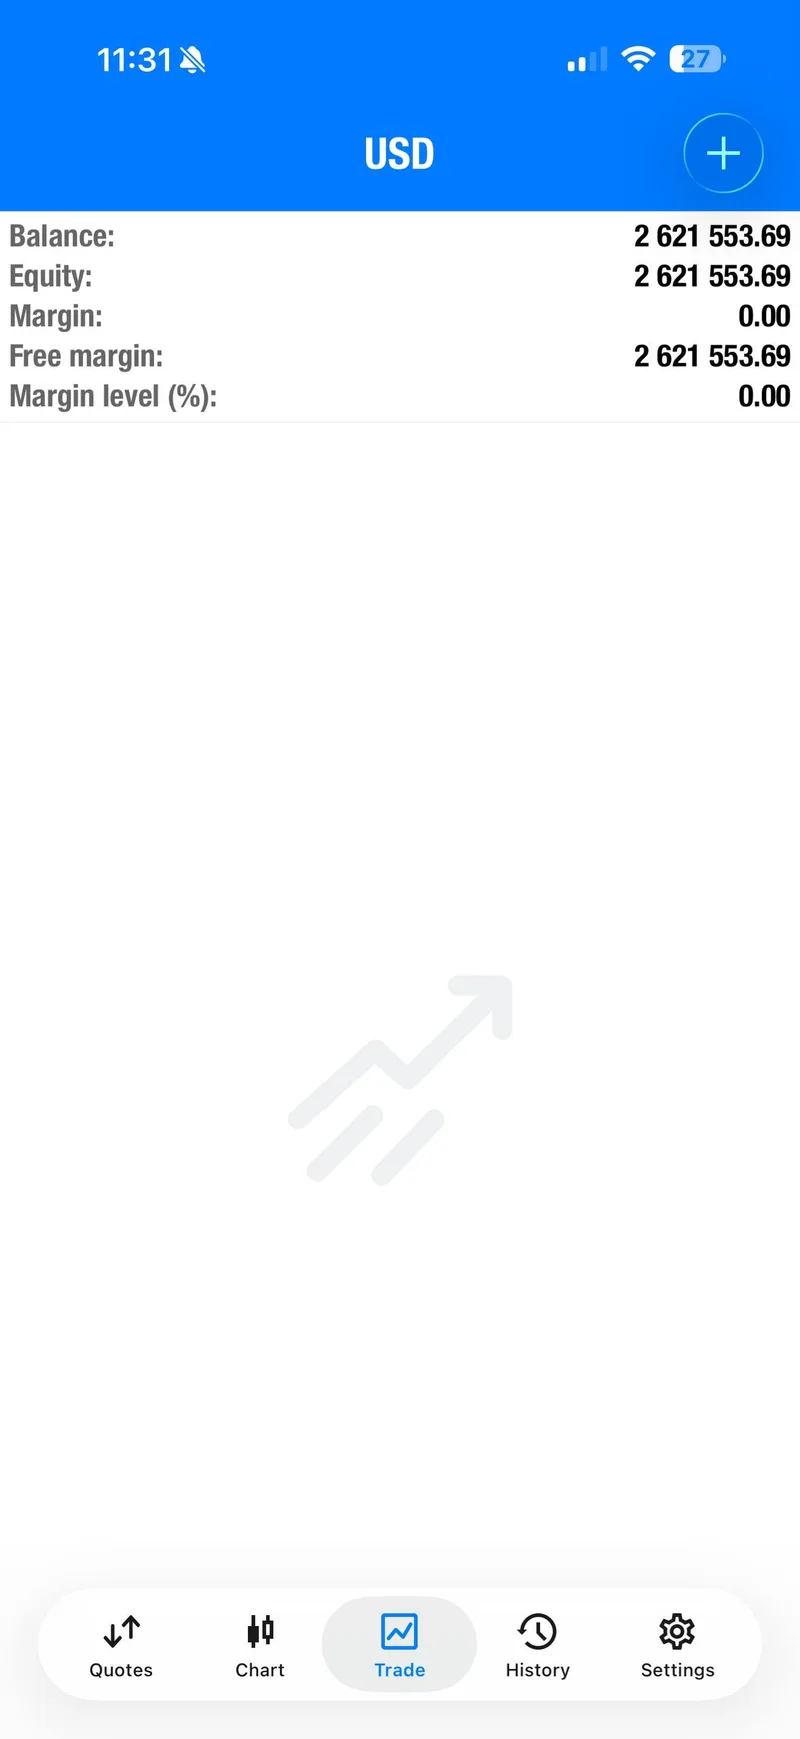
Key Stat: $15,175 closed profit on a day that included a stop-out and a breakeven wipeout. The account balance moved from $2,570,360 to approximately $2,585,535.
Mo's own summary captured it perfectly: "Only bought gold today, followed the current fundamentals and structure! Had ups and downs but at the end the last 2 trades made it all back up!"
Execution Lessons#
Lesson 1: Resilience Is a Strategy#
Signal 2 stopped out. Signal 3's profits were partially wiped by a 1-minute candle. Most traders would have stepped away or switched to SELL out of frustration. Mo re-entered with lower risk each time, trusting his read on the bullish structure. The $15,175 result came not from one perfect trade, but from refusing to quit when the thesis was correct.
Lesson 2: Volume Creates Both Opportunity and Risk#
The extreme 1-minute candle movements created the conditions for 200+ pip runs — but also for stop-outs during temporary reversals. Mo adapted by using lower lot sizes on re-entries and taking partial profits earlier. "Make sure you're on zero risk or low risk, I'm also not opening that much lots as usually" was the explicit guidance.
Lesson 3: Fundamental Conviction Drives Directional Bias#
All four signals were BUY. Zero SELL signals. In a session with VIX at 26.90, ongoing Iran conflict, and WTI surging 3.66%, Mo committed to the bullish thesis during active hours and never wavered. The result validated that conviction: gold rallied from $4,407 to $4,572 intraday, and Mo locked profits before the fade.
Lesson 4: The Best Entry of the Day Was the Last#
Signal 4's entry at $4,412 was lower than Signal 1's entry at $4,419. After the midday volatility, the market offered a better price to patient traders. Mo's willingness to take "one more round" with reduced risk turned what could have been a break-even day into a $15,000 winner.
What The Day Means Going Forward#
March 24 was a consolidation day disguised as a volatile one. Gold ranged $165 intraday but closed flat at $4,407 — down $87 from Friday's $4,494 after the Eid weekend gap. The market is searching for direction between war-driven safe-haven demand and dollar/yield headwinds.
Key takeaways for the week ahead:
- Consolidation at $4,407: Gold is building a base in the $4,395–$4,440 zone. A breakout above $4,514 (R1) signals the next leg up toward $4,572 and $4,617.
- $165 intraday range on a flat close: This level of volatility with no directional resolution suggests institutional repositioning, not a trend decision. Expect similar range-bound sessions until a catalyst breaks the pattern.
- Watch Wednesday's EIA Crude Inventories: WTI at $91.38 (+3.66%) is already pricing energy stress. Any supply disruption news could reignite the gold bid.
- Thursday Jobless Claims and Friday UMich Sentiment: Consumer sentiment at a weak 55.5 prelim reading supports the risk-off narrative that keeps gold's floor intact.
- Iran de-escalation signals are capping gold's upside — but oil at $91+ signals the market does not believe the conflict is winding down.
Mo's intraday read was 100% correct: gold was bullish during active trading hours, and all four BUY signals caught genuine moves. The $15,175 came from reading momentum, not direction. That is the edge in a consolidation market — trade the swings, close before the fade. For more on how Mo navigates these complex sessions, see the March 19 report where three SELL signals all hit their targets and the weekly summary covering the full March 9–13 trading week.
FAQ#
How much profit was made on March 24, 2026?#
Mo closed $15,175 in confirmed profits from four BUY signals. The largest single contributor was Signal 1, which closed $10,000 before breakeven, while Signal 4 added the remaining profits with all four take-profit levels hit.
Why were all signals BUY on March 24?#
The macro setup was overwhelmingly bullish during trading hours: gold was oversold after a 19% correction from all-time highs, VIX was elevated at 26.90 signaling risk-off demand, and the Iran conflict kept safe-haven bids active. Gold closed flat at $4,407 by end of day, but the intraday rally to $4,572 was the window Mo exploited.
What happened with Signal 2 that hit stop loss?#
Signal 2 entered at $4,439 during high momentum with a tight stop at $4,432. TP1 was hit, but extreme 1-minute candle volatility triggered the stop loss moments later. This is typical of high-volume sessions where price wicks can exceed normal ranges. Mo re-entered immediately at lower risk (Signal 3) and recovered.
What is the current account balance?#
After March 24's $15,175 profit, the account balance moved from $2,570,360 to approximately $2,585,535. All positions were closed by end of session. Gold itself closed flat at $4,407.01. All positions were closed by end of session.
Is gold still in a bull market?#
Yes. Gold is above the 200-day moving average ($4,254), which defines the structural bull trend. The 19% correction from the $5,602 high is an intermediate pullback within the larger uptrend driven by the Iran conflict, elevated inflation expectations, and central bank gold purchases. The flat close at $4,407 with a $165 intraday range signals consolidation — the market is building a base, not breaking down.
How do I join Gold Trader Mo's signal channel?#
DM @GTMOBest on Telegram to join the FREE signal channel. Gold Trader Mo shares real-time trading signals with entry prices, stop-loss levels, and take-profit targets — exactly like the four signals detailed in this report.
Connect with Gold Trader Mo#
The GTMO community is not just signals — it is a global trading family. On March 24, even during extreme volatility, members were celebrating together in real time.
Member Testimonials#
"When you listen to Mo King, then profit waits for me! You are the King!" — GTMO community member who followed the BUY signals and closed in profit
"Mooooo the gold king, the zen, the master — flyyyyyy baby flyyyyyy!" — Community member reacting to Signal 4's 200+ pip run
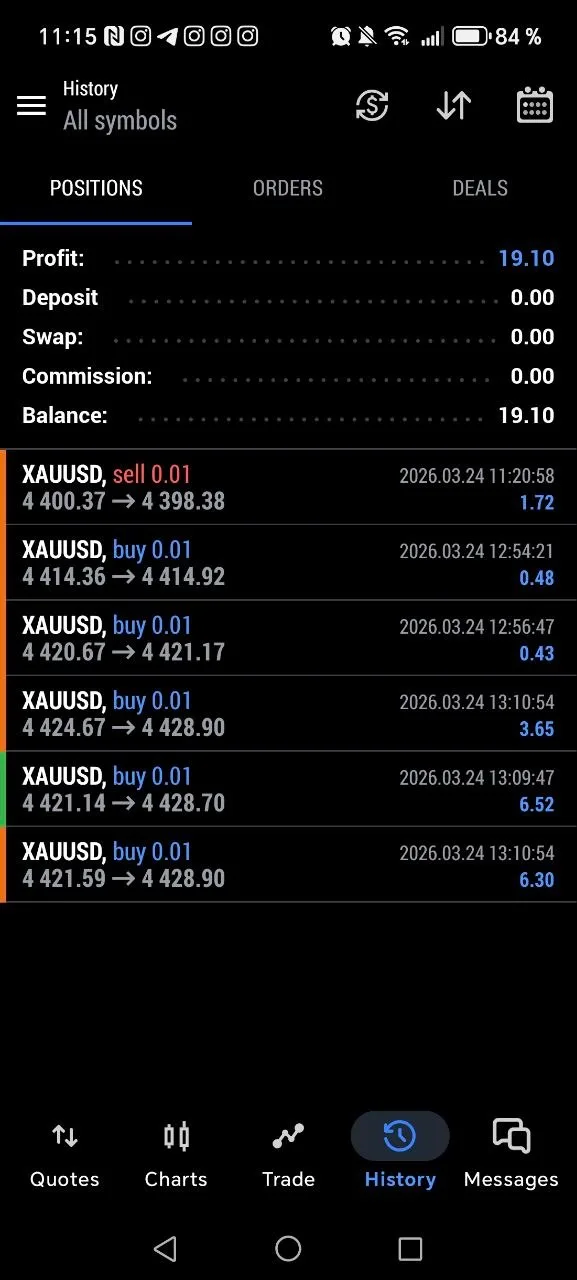
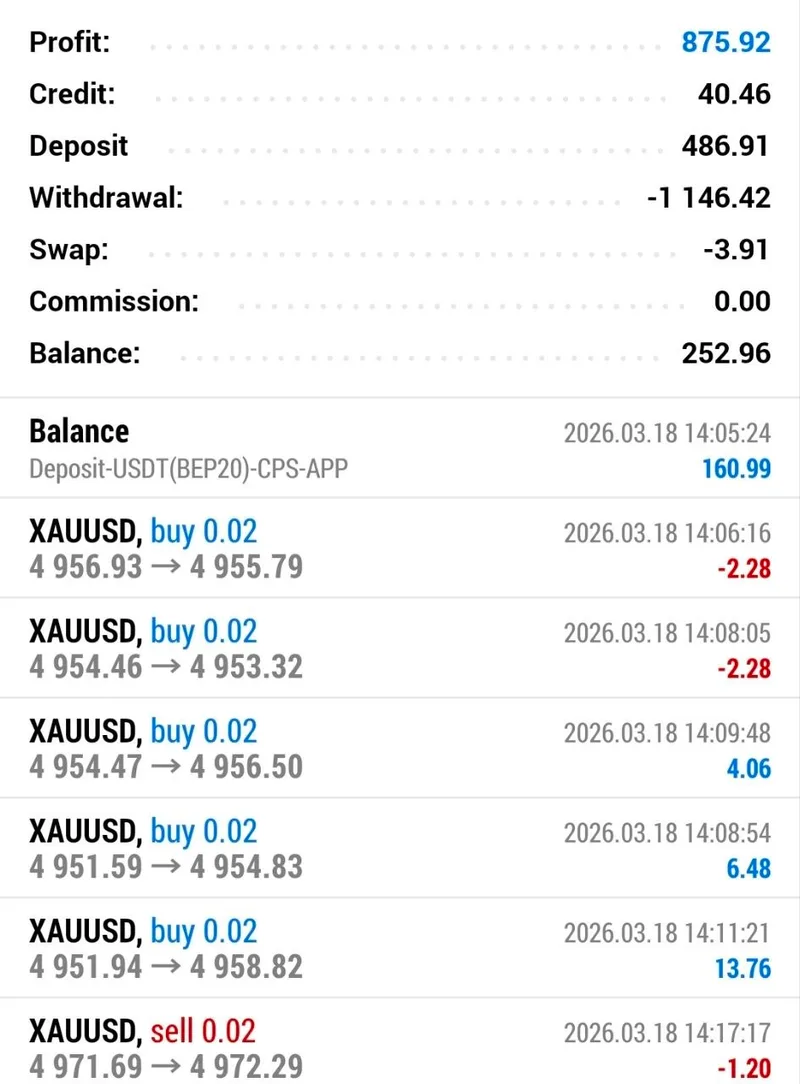
"From 1.3k loss into 160 euro win, 1 position still running. What a day!" — Community member who recovered from early drawdown by following Mo's re-entry calls
"Thanks to Mo and his team." — FREE channel member who followed Signal 1's morning setup to all three take-profit levels
"When Mo speaks, Gold obeys!" — Community member after watching gold hit all three TPs within five minutes of Mo's first signal
"Nice entry!" — Community member commenting on Signal 4's $4,412 entry that went on to hit all four take-profit targets and 200+ pips
"NICE ONE MO!" — Community celebration after the final trade of the day closed 200+ pips in profit
Join 15,000+ traders who follow Gold Trader Mo's daily signals. Whether you are a beginner learning risk management or an experienced trader looking for institutional-grade analysis, the GTMO community delivers real results with real transparency.
Ready to trade with us? DM @GTMOBest on Telegram for FREE access.
Browse all daily gold trading reports to see consistent performance across every market condition — bullish rallies, volatile corrections, and everything in between.
Disclaimer: This report is for educational and informational purposes only. This is not financial advice. Trading gold and other financial instruments involves risk of loss and capital at risk may exceed initial deposits. Past performance is not indicative of future results — results may vary. Always do your own research and consult a licensed financial advisor before making trading decisions.