
Market Snapshot#
Gold closed Friday April 10 near $4,778 after a volatile session driven by US March CPI data and a continuation of the US-Iran ceasefire narrative. The session saw a sharp intraday recovery from early losses, with a massive spike at 12:30 UTC when CPI data hit the wires.
| Metric | Value |
|---|---|
| XAUUSD Close | ~$4,778 |
| Fed Funds Rate | 3.75% |
| DXY (Dollar Index) | ~98.70 |
| US 10-Year Yield | ~4.06% |
| WTI Crude Oil | ~$68 |
| VIX | ~20 (elevated) |
| Gold Regime | Consolidation — bullish correction from ATH |
The dollar weakened into the weekend as the DXY dropped toward 98.70, extending its weekly decline. The US-Iran two-week ceasefire — including a partial reopening of the Strait of Hormuz — pulled oil back from the $120 spike earlier in the week, removing some geopolitical premium from commodities. But gold held its ground, bouncing from a dip near $4,743 to close above $4,770. The CPI release at 8:30 AM Eastern was the catalyst, pushing gold more than $20 higher in minutes and capping a third consecutive weekly gain.
Why The Tone Changed So Fast#
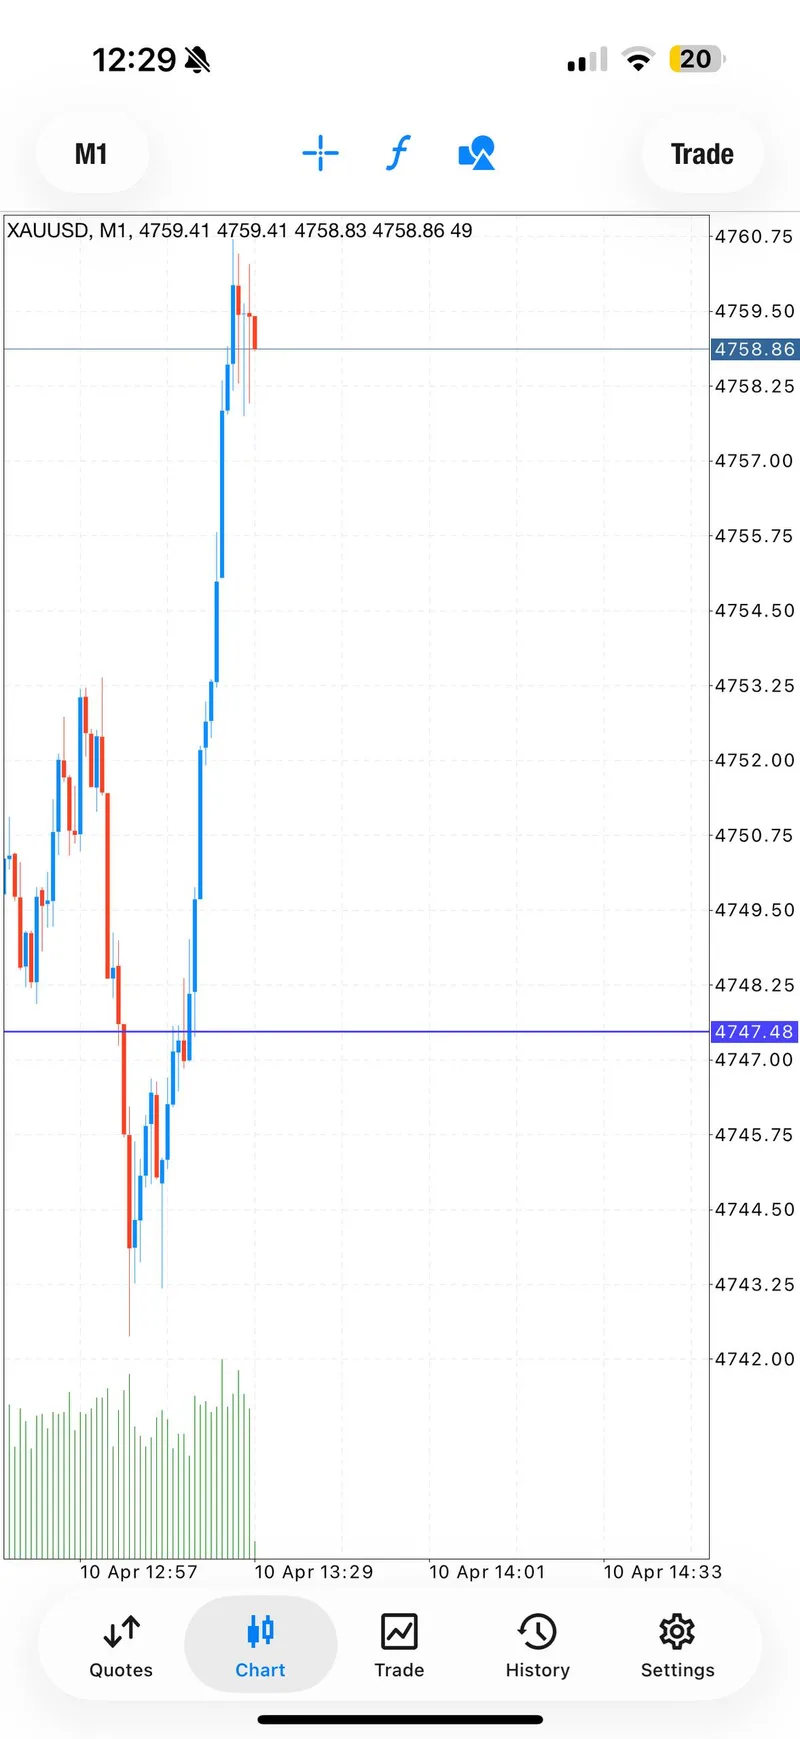
The session opened with gold trapped in a narrow zone around $4,750. After the previous day's recovery rally, price was consolidating and drifting sideways — a common setup before high-impact data releases.
The first buy signal entered the $4,747–$4,750 zone, and initial price action cooperated with quick moves to the first two profit targets. But the setup failed. Gold pulled back through the entry zone and triggered the stop at $4,743, catching positions that had not yet been reduced.
What happened next is what defined the day. Instead of waiting for a new structure to form, Gold Trader Mo re-entered with a second buy signal at a slightly higher zone — $4,753–$4,757 — and this time the price never looked back. The second entry caught the base of an accelerating move that would carry gold through every profit target and eventually spike past $4,773 on the CPI print.
Three factors converged. First, the failed first trade established that $4,743 was the day's hard floor — the stop loss level was never violated again, confirming it as enforced support. Second, the CPI data released at 12:30 UTC showed March inflation at 3.3% year-over-year, adding urgency to the gold trade as dollar weakness accelerated. Third, the ceasefire news had already softened oil and the dollar, creating a structural tailwind for gold that the data release amplified.
The tone shifted because the first loss created the map for the recovery. The failed trade told the market exactly where gold would not go — and everything above $4,750 became the opportunity.
Technical Outlook#
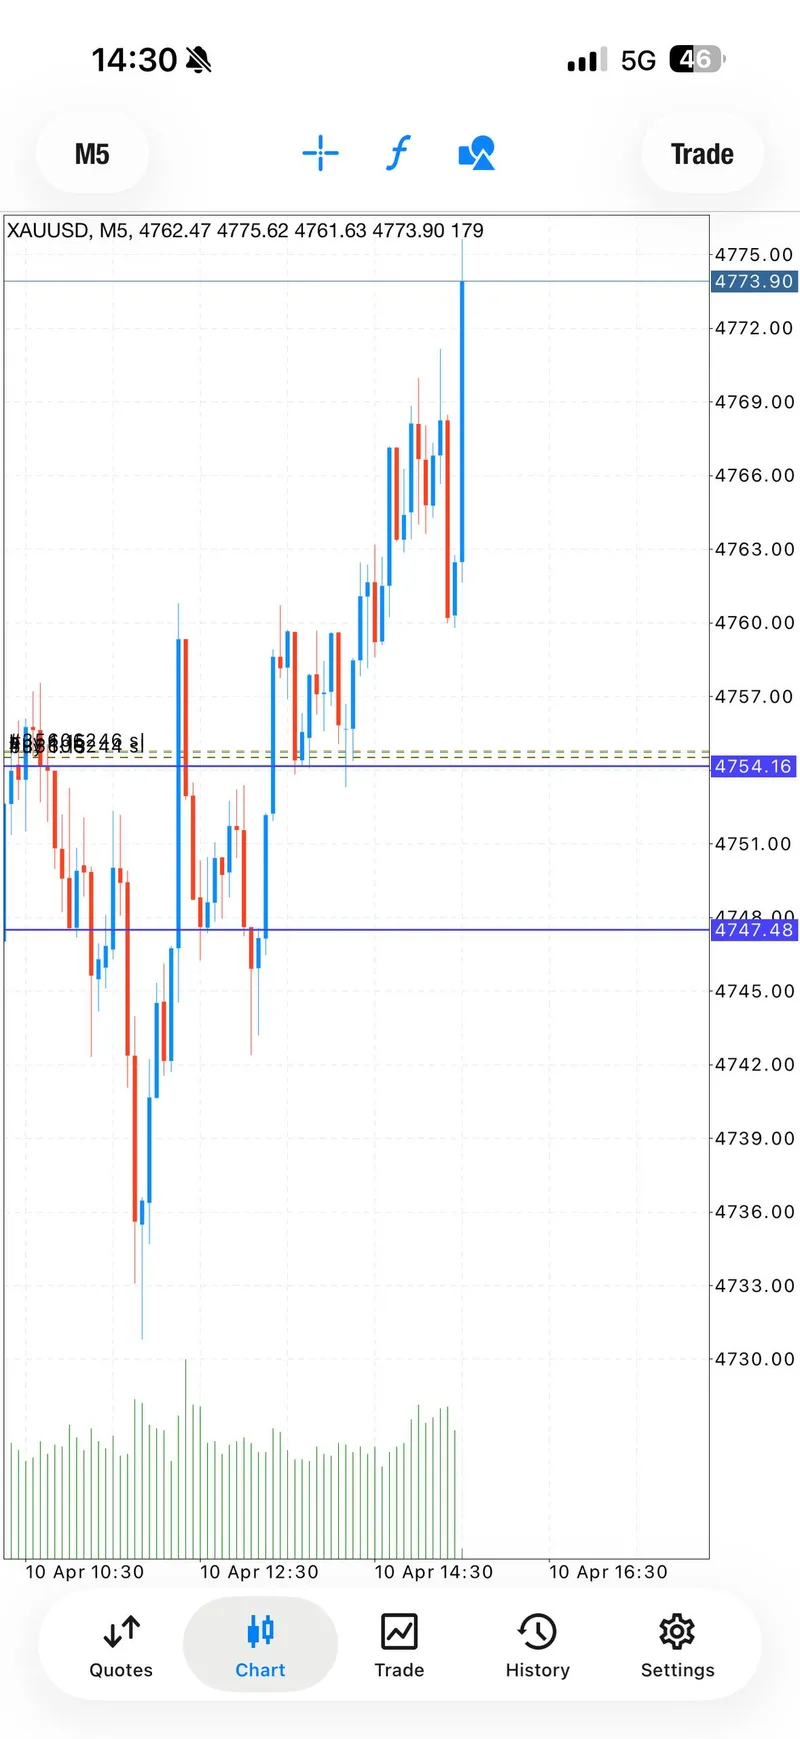
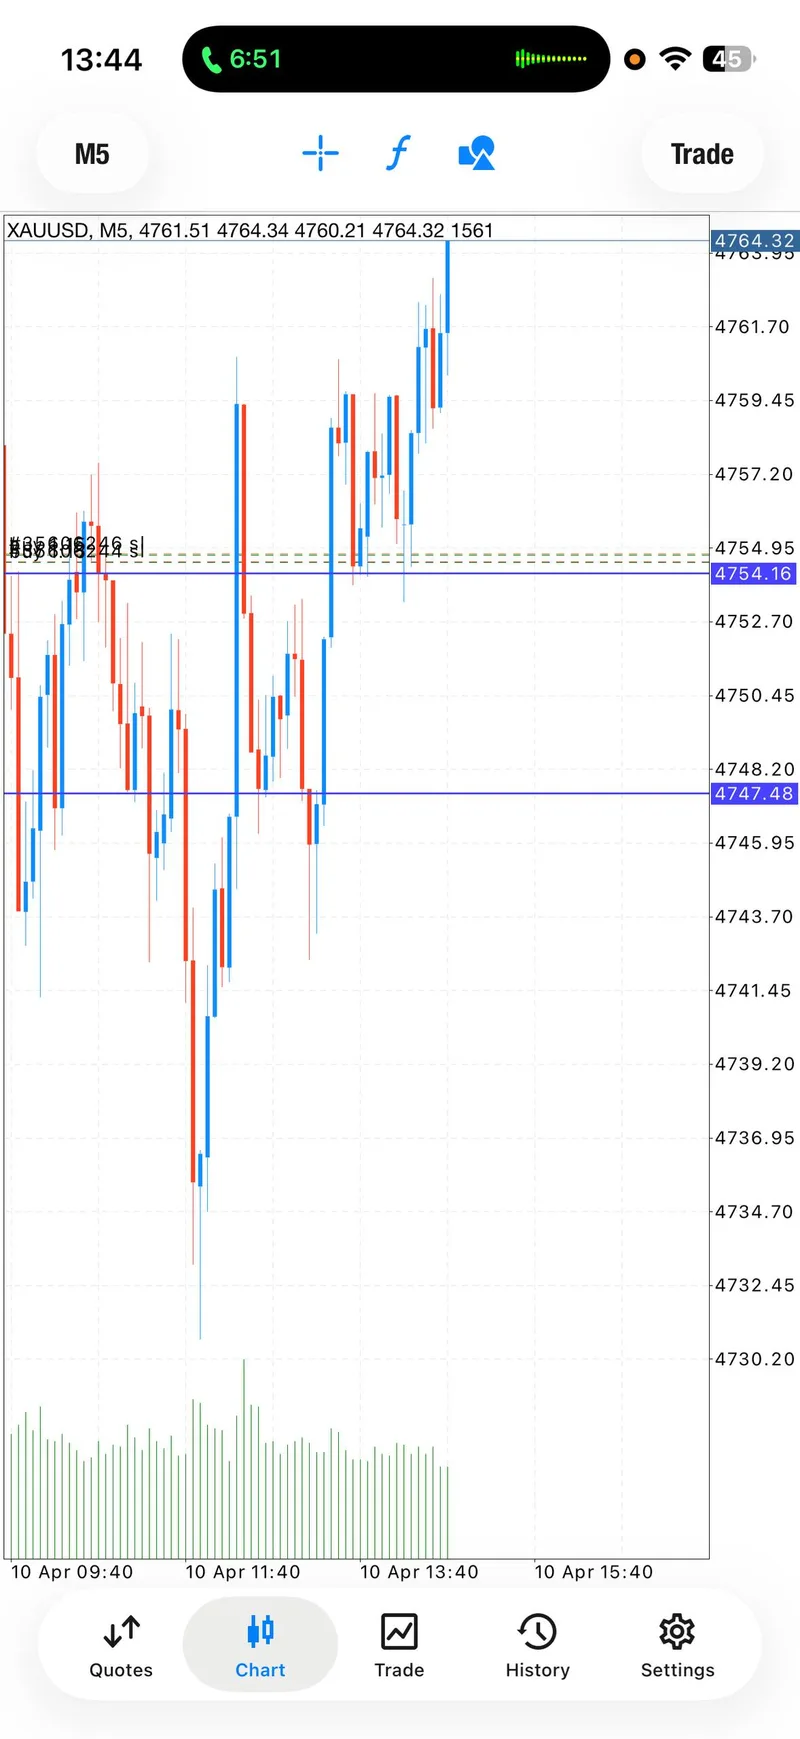
Gold formed a key reversal on April 10, bouncing from a session low near $4,743 to print above $4,773 during the CPI-fueled spike. The intraday swing of more than $30 confirms that the $4,740 zone has become enforced support for the near term.
Key levels to watch:
- Support: $4,743 (session low / SL zone), $4,700 (psychological), $4,673 (100-day SMA)
- Resistance: $4,778 (session close), $4,821 (upper consolidation range), $4,914 (50-day SMA)
The M5 chart showed a clear base-building pattern between 09:00 and 11:00 UTC, followed by a breakout above $4,760 that accelerated into the CPI release. Volume surged on the spike candle, confirming real buying pressure rather than a sentiment-driven wick.
Gold remains approximately 15% below its January 28 all-time high of $5,602. With the RSI near 60 and the DXY under pressure, the technical setup favors continued upside if gold can clear $4,821. A failure to hold $4,743 would open a retest of the $4,700 psychological level and potentially the 100-day SMA at $4,673.
The upcoming FOMC meeting on April 29–30 is the next major event risk. With the Fed holding at 3.75% and markets pricing zero chance of an April cut, gold will likely remain range-bound between $4,700 and $4,821 unless new headline risk emerges from the US-Iran negotiations in Pakistan this weekend.
Trading Signals#
Two signals were issued on April 10, 2026.
Signal 1 — Buy (Stop Loss Hit)#
Gold Trader Mo identified a buy opportunity in the $4,747–$4,750 zone during the early European session.
- Direction: Buy
- Entry: $4,750.00 – $4,747.00
- Stop Loss: $4,743.00
- Take Profits: $4,752 / $4,754 / $4,756 / Open
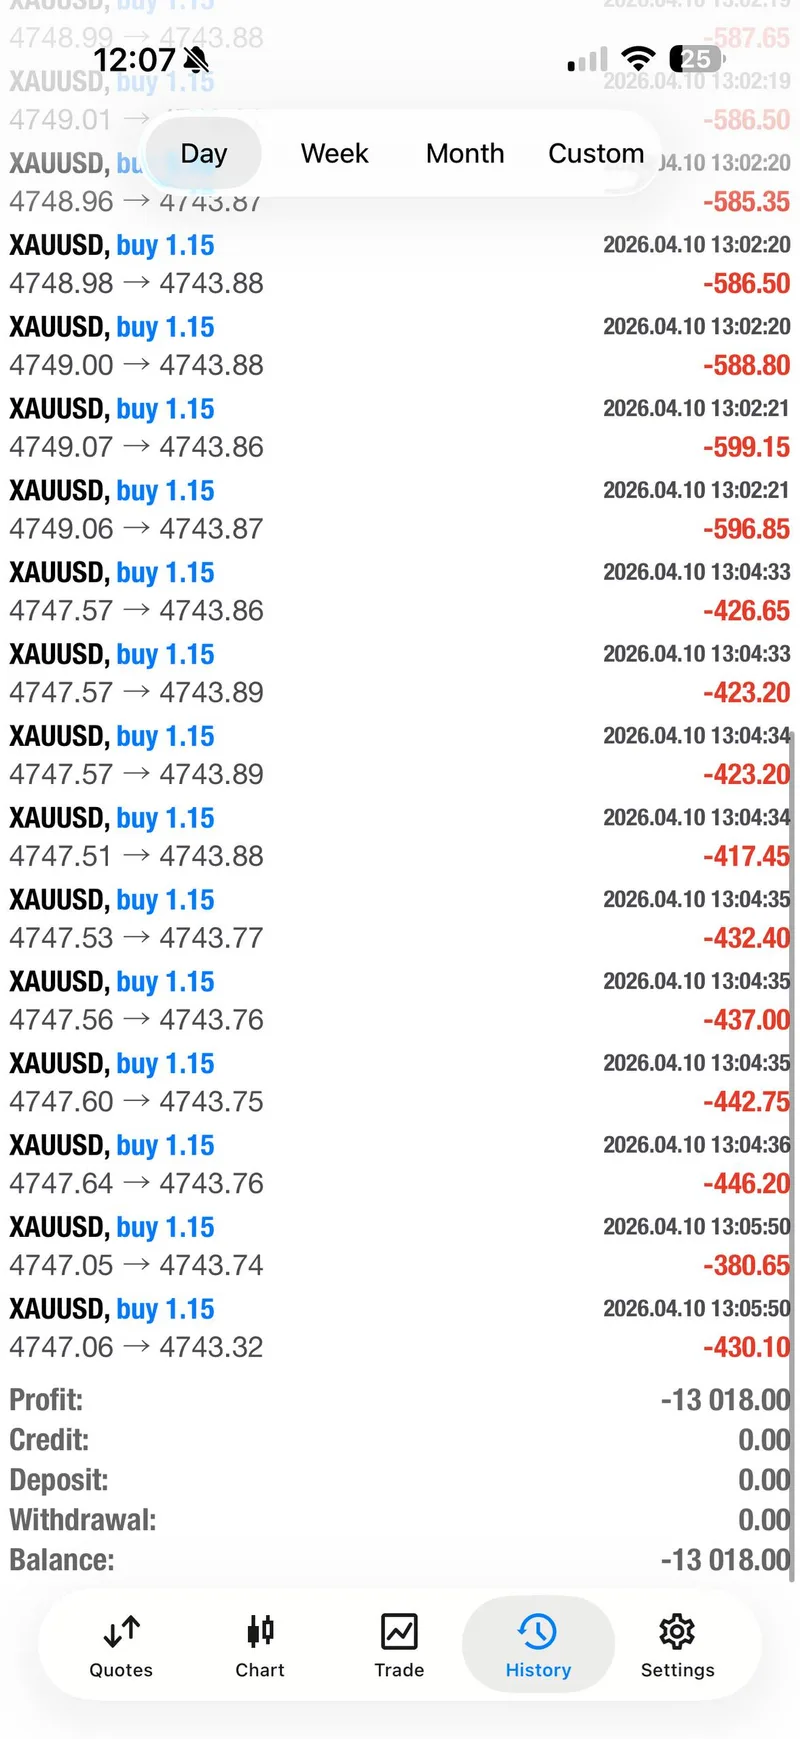
- Result: TP1 and TP2 approached, then stop loss hit at 10:06 UTC. Recorded loss of $13,018.
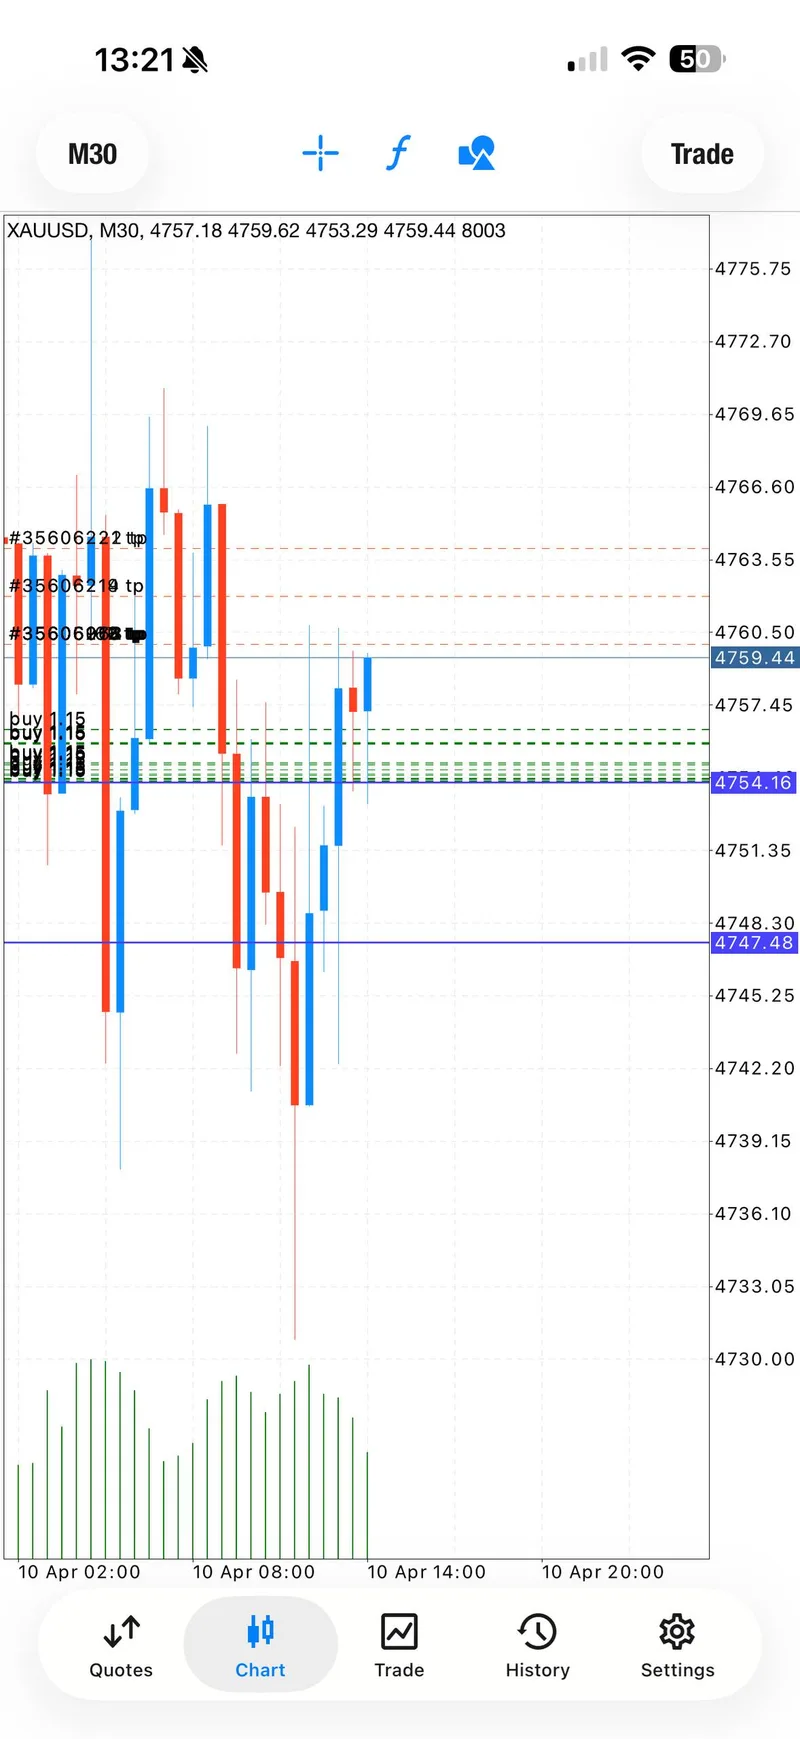
Signal 2 — Buy (All Targets Hit + 200-Pip Close)#
After the failed first trade, Mo re-entered with a buy signal at a higher zone.
- Direction: Buy
- Entry: $4,757.00 – $4,753.00
- Stop Loss: $4,749.00
- Take Profits: $4,760 ✓ / $4,762 ✓ / $4,764 ✓ / Open (200+ pips) ✓
- Result: All three targets hit progressively between 11:20 and 11:44 UTC. Final two entries closed at 200+ pips at 12:30 UTC on the CPI spike.
Community Adaptation on Signal 1#
While Signal 1 hit its stop loss on the original parameters, several community members read the chart independently and adjusted their stop losses lower before the reversal. Multiple members reported profitable exits from Signal 1's entry zone after gold recovered past all profit targets. This divergence between the official signal result and community outcomes is a recurring pattern in Gold Trader Mo's channels — experienced followers learn to adapt signals based on live chart context.
Signal Performance Breakdown#
| Signal | Direction | Entry | Result | Pips |
|---|---|---|---|---|
| Signal 1 | Buy | $4,750–$4,747 | Stop Loss Hit | -7 |
| Signal 2 | Buy | $4,757–$4,753 | All 3 TPs + Open | +200 |
Day highlights:
- Win rate: 1 out of 2 official signals (50%)
- Signal 1 loss: $13,018 (verified from trading history)
- Signal 2: All three profit targets hit, final entries closed at 200+ pips on CPI spike
- Pattern: Recovery — loss on first trade, full recovery and profit on second trade
- Community adaptation: Multiple members profited on Signal 1 by adjusting their risk management independently
The $13,018 setback on Signal 1 was significant in absolute terms but represented less than 0.5% of the account balance. Mo acknowledged the loss transparently: "Small loss, as I didn't risk very much at this trade. We were in profits already too." He then followed with: "I should have just adjusted SL" — showing the specific adjustment that would have turned the losing trade into a winner.
This recovery pattern mirrors the April 9 session where a failed sell became a $10,245 profit day, and the April 7 session where a $24,000 loss was recovered with $19,147 in profits. The consistency of the recovery approach — accept the loss, re-enter with better positioning, manage risk aggressively — is what separates this from random chance.
Execution Lessons#
1. The first loss is a scouting report. Signal 1 confirmed that $4,743 was the day's hard floor. That information shaped Signal 2, which entered higher and set a stop loss above the proven support level. A failed trade provides actionable intelligence when you know how to read it.
2. Adjusting the stop loss matters more than being right on direction. Mo entered the correct direction on Signal 1 — gold ended the day well above the entry zone. The trade failed not because the analysis was wrong but because the stop loss was too tight for the pre-CPI volatility. He acknowledged this publicly: "I should have just adjusted SL." Several community members who made that adjustment in real time turned the same trade into a winner.
3. Breakeven stops convert uncertainty into free exposure. On Signal 2, Mo set breakeven immediately after TP1, reducing the remaining position to zero-risk exposure. This meant the worst case after the first target was a breakeven exit — not a second loss. The remaining entries then rode the CPI spike for 200+ pips with no downside risk.
4. High-impact news requires presence, not avoidance. The US March CPI at 12:30 UTC created a $20+ move in minutes. Instead of closing before the data, Mo held positions with breakeven stops set — capturing the full upside of a favorable release while limiting downside to zero. The discipline was in the risk structure, not in avoiding the event.
What The Day Means Going Forward#
April 10 closed the trading week with gold above $4,770 and the recovery narrative intact. Across the final three sessions of the week — April 8, April 9, and April 10 — gold traded in a defined range but consistently rewarded buying dips to the $4,700–$4,750 zone.
The US-Iran ceasefire moves into its critical next phase this weekend, with the first formal negotiations in Pakistan. Any breakdown in talks or escalation over the Strait of Hormuz could send gold back toward $4,900+ early next week. Conversely, progress toward a broader agreement could extend the consolidation or push gold toward a test of the 100-day SMA at $4,673.
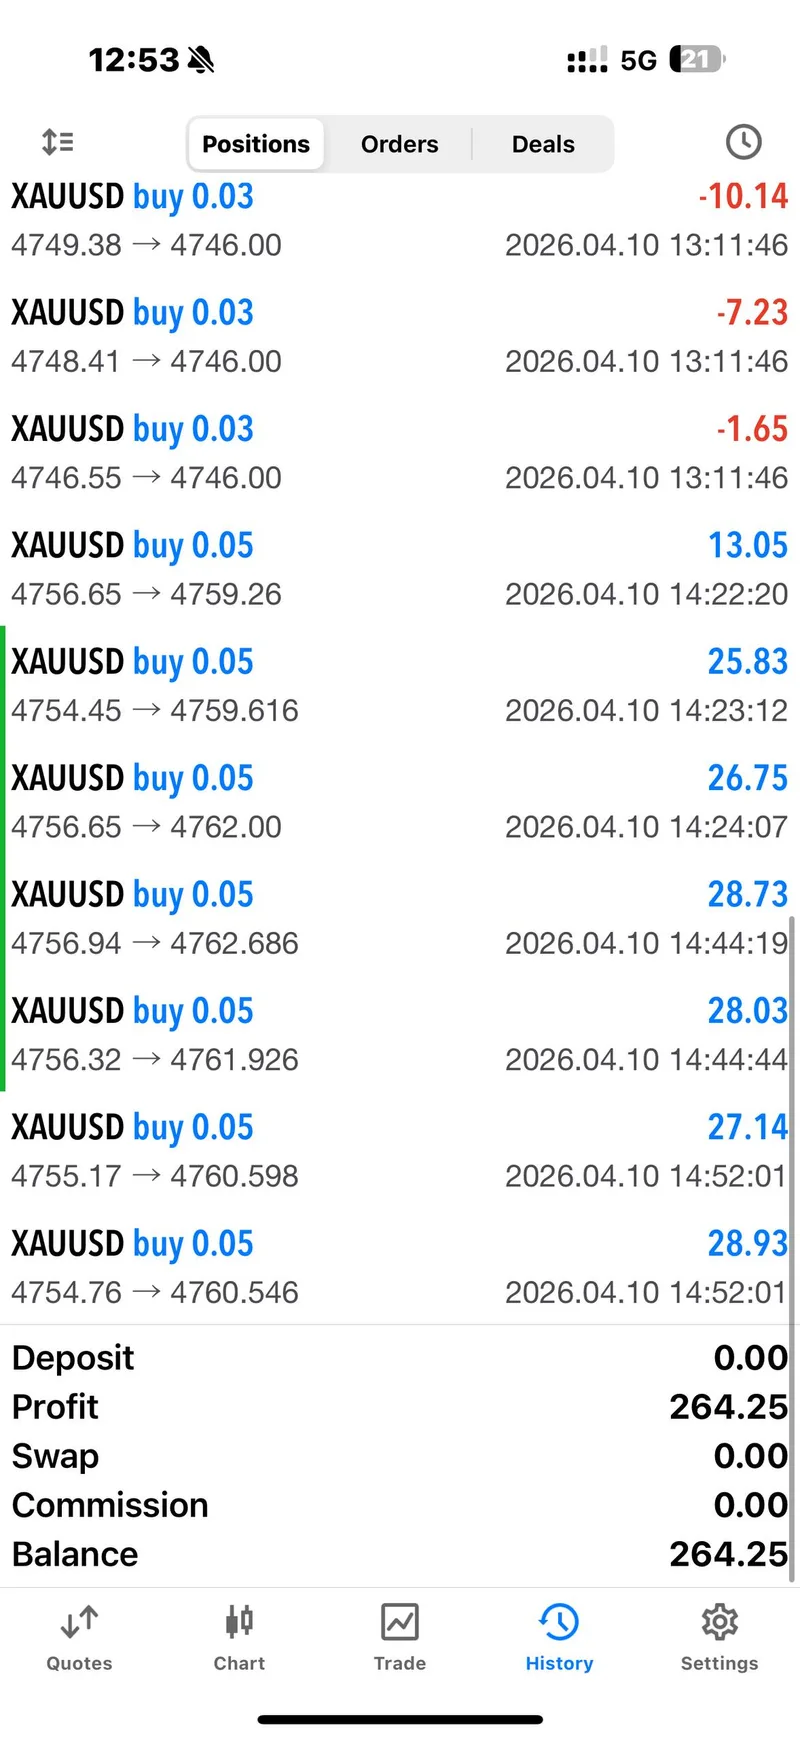
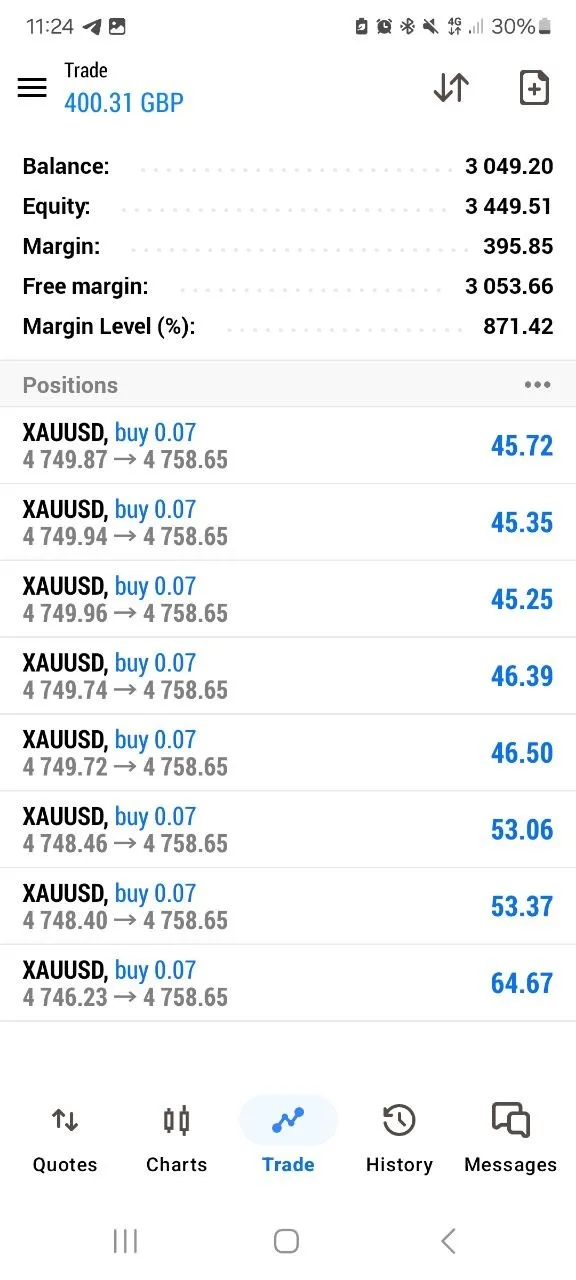
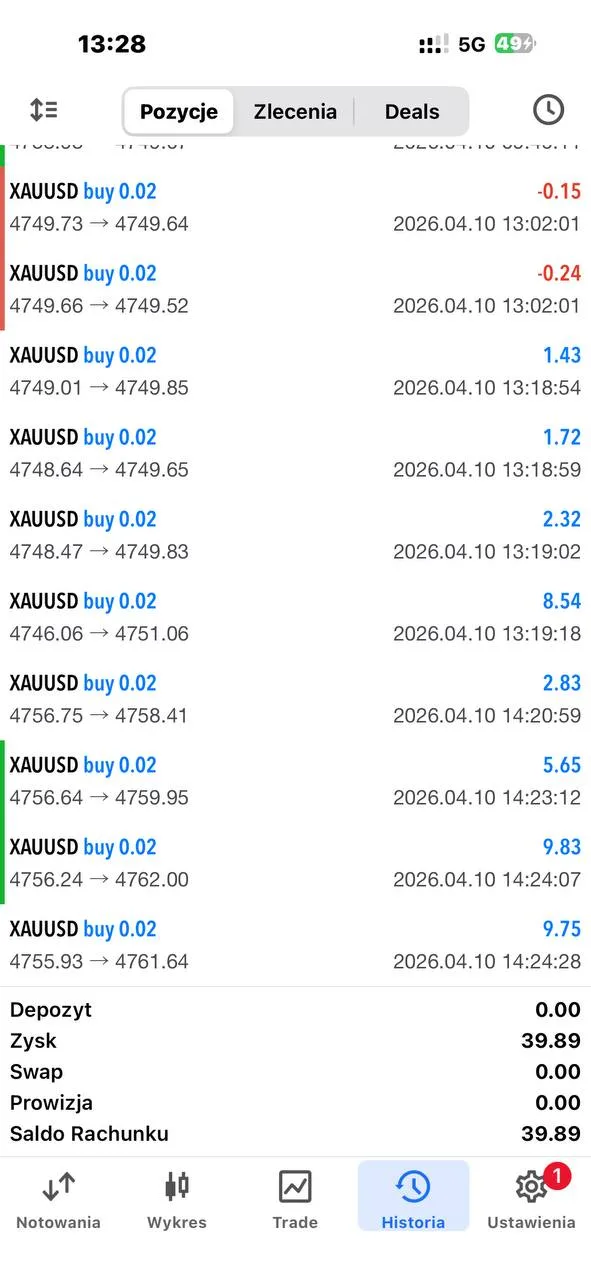
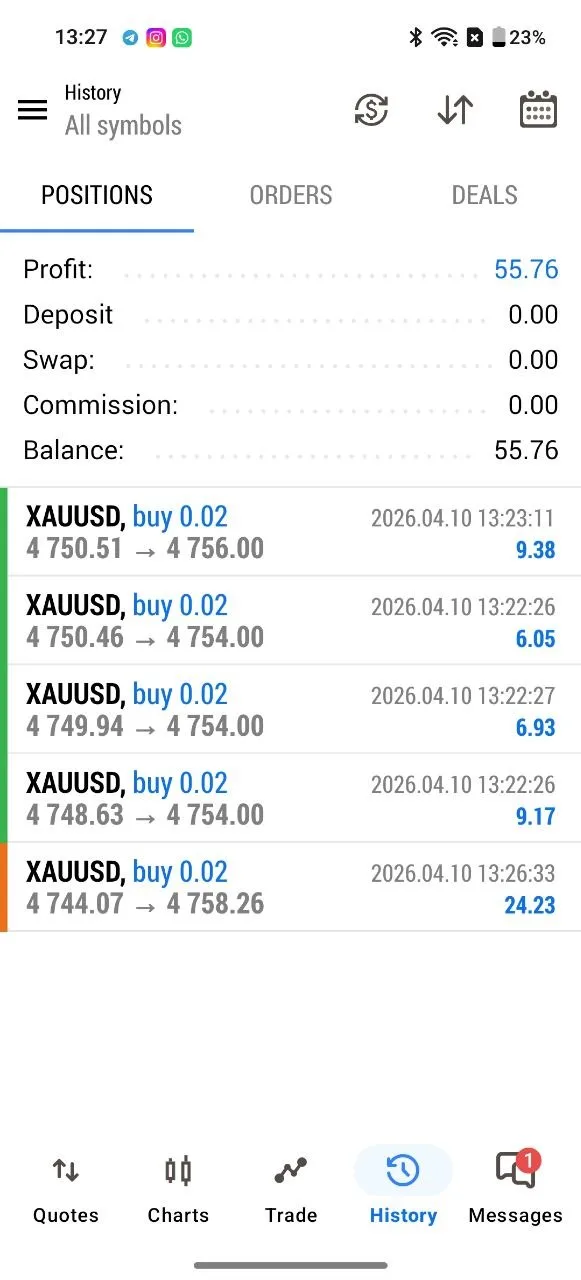
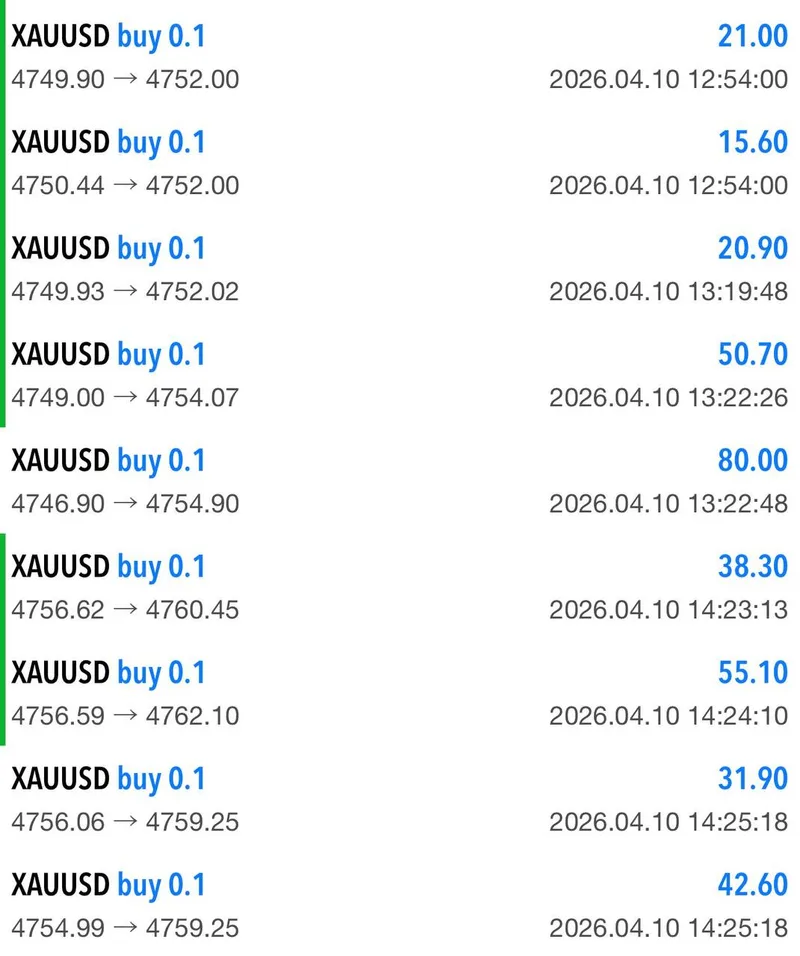
For the community, April 10 was one of the most instructive sessions of the year. The mix of a failed first trade, real-time community adaptation, and a clean recovery on the second signal demonstrated both the risks and the rewards of live signal trading. Several community members shared verified profit results — from $55 to $264 in account gains — while others documented how they adjusted their stop losses and entry sizing to improve on the original signal parameters.
The broader lesson: professional trading is not about avoiding losses. It is about defining the size of each loss, learning from what it reveals about the market, and then positioning the next trade with that intelligence. Gold Trader Mo did exactly that on April 10, and so did the community.
FAQ#
Did Gold Trader Mo lose money on April 10?
The first trade of the day hit its stop loss, recording a loss of $13,018. The second trade recovered with all three profit targets hit and the final entries closed at 200+ pips on the CPI data spike at 12:30 UTC.
What was the CPI data that moved the market?
US March CPI was released at 8:30 AM Eastern (12:30 UTC) on April 10, showing inflation at 3.3% year-over-year. Gold spiked more than $20 in minutes as the data reinforced expectations that the Fed will hold rates longer, weakening the dollar and supporting gold demand.
Why did community members profit on Signal 1 when it hit the stop loss?
Several experienced community members adjusted their stop losses below the original $4,743 level. When gold reversed and moved back through the entry zone and beyond all profit targets, those members captured the recovery move. This is a documented pattern in the community — live chart analysis sometimes creates better exits than the original signal parameters.
Is it normal to have a $13,000 loss on a single trade?
On a $2.8 million account, $13,018 represents approximately 0.46% of account equity. Professional traders typically risk 0.5–2% per trade. Mo's risk on Signal 1 was within that range and was intentionally sized to leave room for recovery.
What is the account balance after April 10?
The exact account balance after the session was not disclosed. Prior to April 10, the balance was $2,827,388 after the April 9 session. Signal 1 reduced it by $13,018, and Signal 2 recovered with 200+ pips of profit on the remaining entries.
Connect with Gold Trader Mo#
Follow live gold trading signals and join a community of traders from more than 50 countries. Access the free signal channel on Telegram at @GTMOBest for daily analysis, real-time entries, and community support.
Visit Gold Trader Mo for the full daily report archive and to explore the GTMO School program, where over 1,700 students learn gold trading with daily live analysis.
This is not financial advice. Gold trading carries significant risk, and past performance does not guarantee future results. Always use proper risk management and never trade with money you cannot afford to lose.