Market Snapshot#
April 7 was the last active gold session before an extended market break, and the closing dashboard only tells part of the story. XAUUSD settled at $4,668.42, up 0.20%, while the Federal Reserve held rates at 3.50%-3.75%, the DXY closed at 99.98, the US 10-year yield climbed to 4.348%, WTI crude added 0.95% to $113.48, and the VIX jumped 6.66% to 25.78. On paper that looks mixed. In practice it was a high-volatility day that punished hesitation and rewarded the trader who accepted that buyers had lost control.
Market Dashboard#
| Metric | Value | Change | Source |
|---|---|---|---|
| XAUUSD Close | $4,668.42 | +0.20% | Google AI Mode |
| Fed Funds Rate | 3.50% - 3.75% | Unchanged | Google AI Mode |
| DXY Index | 99.98 | Flat reading | Google AI Mode |
| US 10-Year Yield | 4.348% | +0.30% | Google AI Mode |
| WTI Crude Oil | $113.48 | +0.95% | Google AI Mode |
| VIX Index | 25.78 | +6.66% | Google AI Mode |
| Gold Regime | Bearish short-term | - | Google AI Mode |
That bearish short-term label matters more than the modest positive close because the day was defined by a failed early push and a sharp reversal lower. Gold spiked, rejected, and then broke hard enough for one losing idea to be replaced by three winning ones. That is the real April 7 takeaway.
For nearby context, the April 2 session showed how quickly bullish momentum can collapse into a sell-heavy tape, while the March 30 report showed a cleaner reset day earlier in the same stretch. The broader tone from the weekly review also fits: gold has been rewarding flexibility far more than stubborn bias.
Why The Tone Changed So Fast#
The session opened with the kind of volatility that tempts traders into believing the first move will hold. Mo opened with a buy zone around $4,677.4 to $4,674, looking for continuation higher after the early push. Instead, London-session sellers overwhelmed that idea almost immediately. Gold slipped through the protective stop, the trade closed automatically, and the account went roughly $24,000 underwater before the room had any reason to feel comfortable.
That could have been the emotional end of the day. It was not. Thirteen minutes after the loss was confirmed, Mo publicly flipped direction and went with the sellers. That decision was the whole session. The market was no longer paying buyers for optimism above the high-$4,670s, and the repeated wicks higher were beginning to look less like strength and more like exhaustion.
The most important part of the narrative is not that the first call lost. The important part is that the read changed fast enough to matter. Mo's closing message captured the tone best: the room did not give up, emotions were turned off, and the loss was recovered with profit still left over. April 7 became a recovery day because the losing idea was abandoned quickly, not defended emotionally.
Technical Outlook#
Technically, April 7 was a failed squeeze followed by a waterfall move. The one-minute chart pushed toward the $4,690 area in the early European session, but once price started rejecting the high-$4,680s the tape changed character. Buyers could still force short bursts upward, but they could no longer hold those gains. That loss of follow-through created the opening for the sell-side sequence that followed.
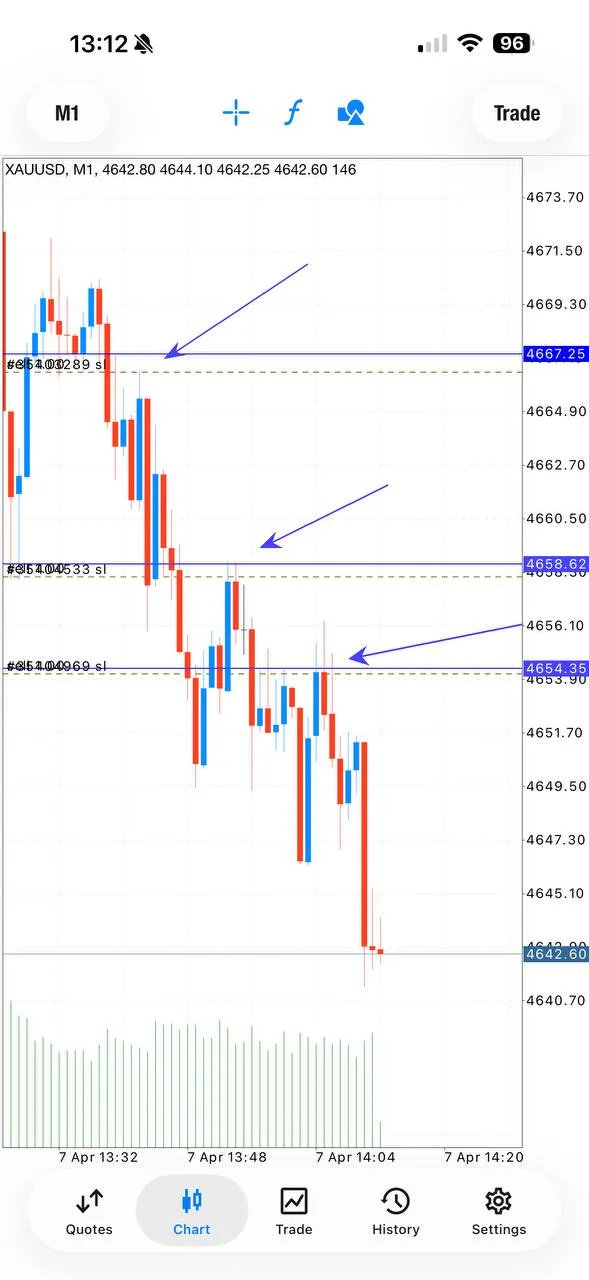
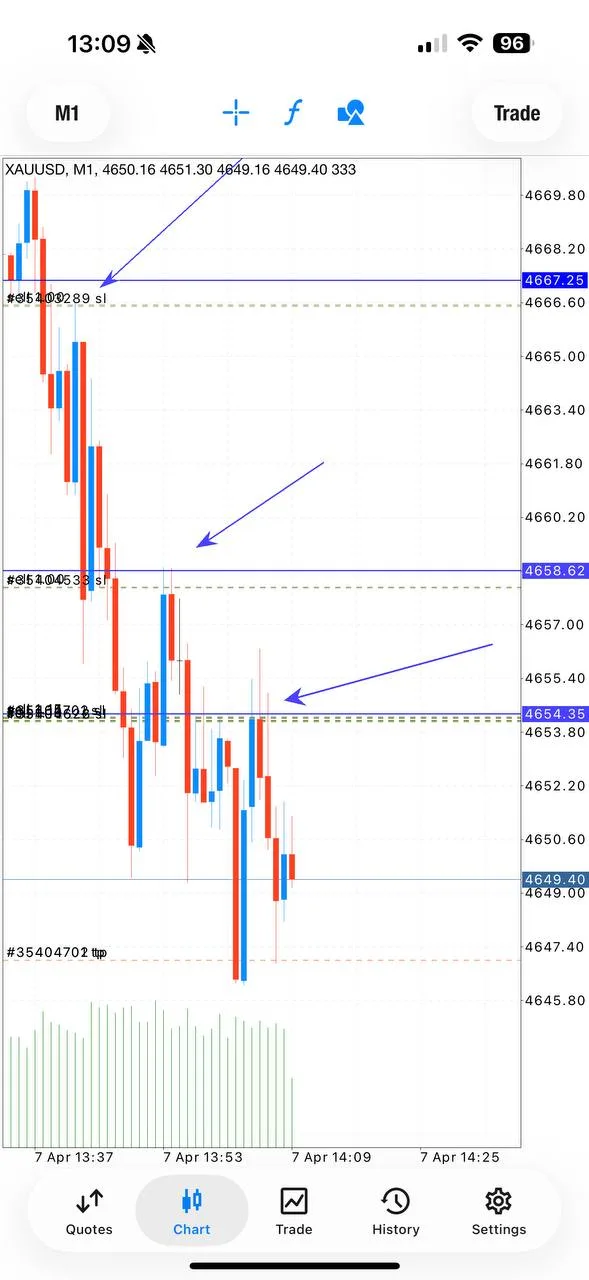
The Three Levels That Mattered#
Three intraday levels defined the entire move: $4,667, $4,658, and $4,654. The first level mattered because it marked the area where Mo made the initial reversal call after the stop-out. The second level mattered because it confirmed that the drop was not a one-wave flush but a continuation move. The third level mattered because it showed the market was still giving fresh downside opportunity even after the recovery was already in motion.
The simplest read is this: buyer exhaustion developed above $4,680, seller pressure accelerated once gold lost the mid-$4,660s, and the short-term bearish regime stayed intact even though the official close later stabilized. Compared with the steadier tone described in the March 30 report, April 7 was far more violent and far more dependent on fast adaptation.
Trading Signals#
- Signal 1 - Buy, loss. Gold was bought around $4,677.4 to $4,674 with a protective stop at $4,671. The stop was tightened to $4,669 as volume developed, but the market failed to hold the upside and the trade closed for a loss.
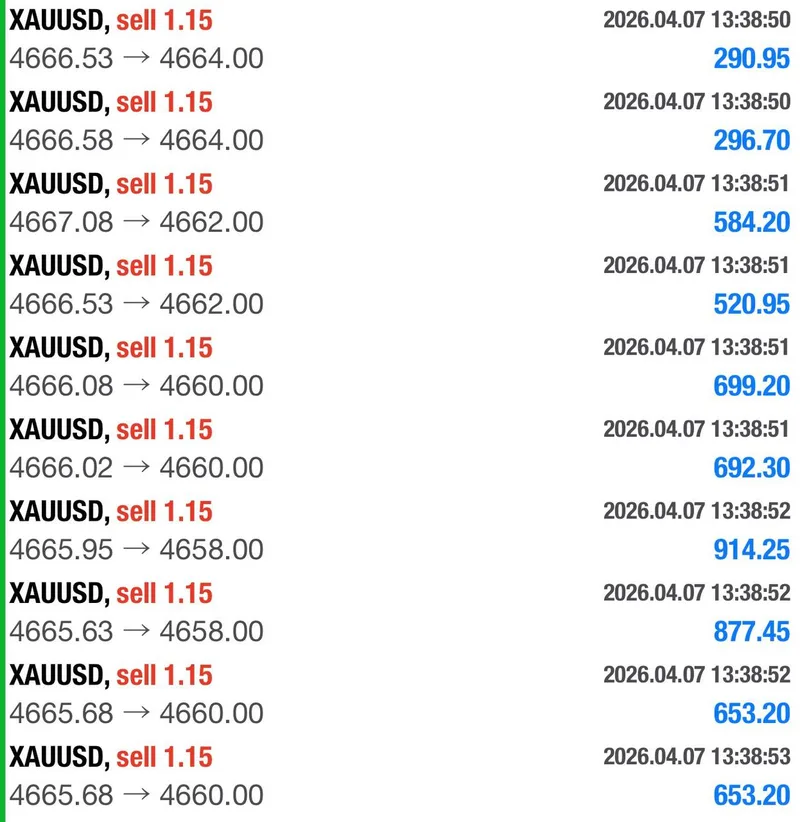
- Signal 2 - Sell, win. Mo flipped bearish and sold around $4,667 to $4,670 with a protective stop at $4,674. Gold then dropped through four profit targets at $4,664, $4,662, $4,660, and $4,658. Additional positions were closed later as the move kept extending.
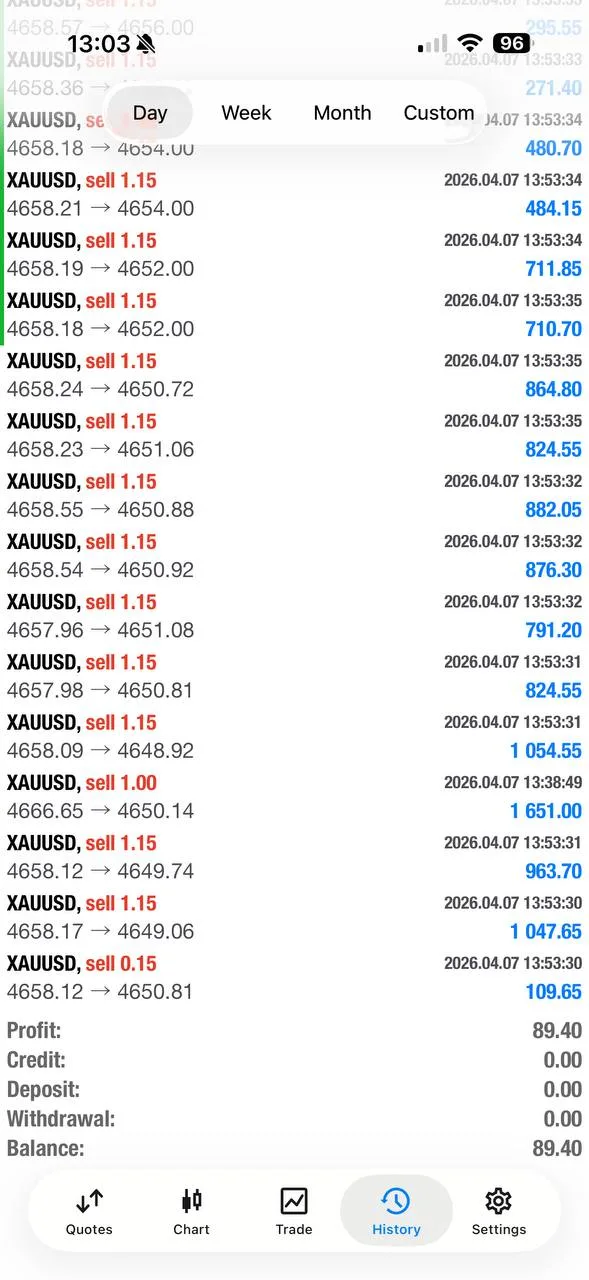
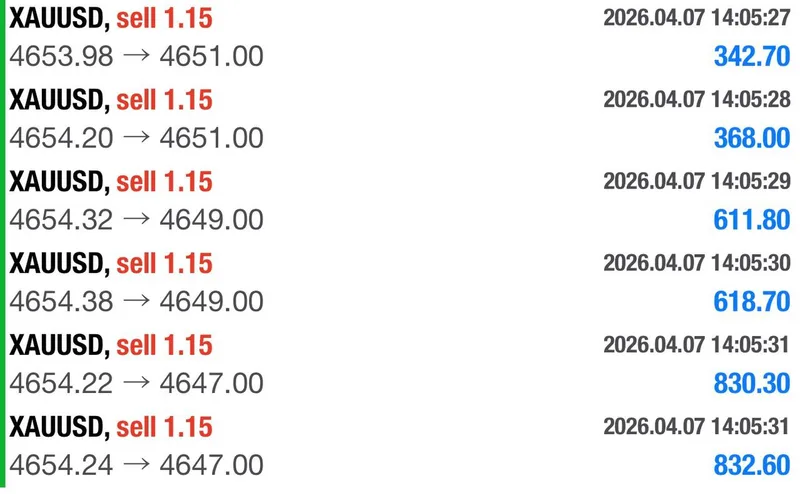
- Signal 3 - Sell, win. The second sell wave opened around $4,658.6 to $4,662 with a protective stop at $4,665. Three profit targets at $4,656, $4,654, and $4,652 were hit within two minutes, and the remaining positions were held deeper into profit before being closed.
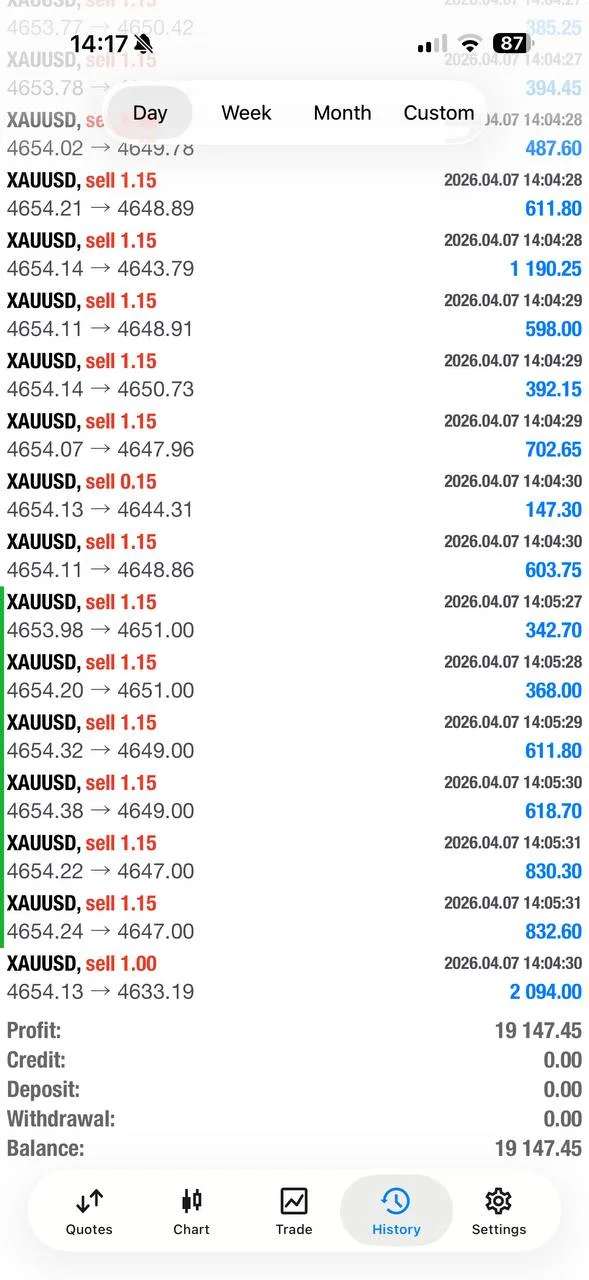
- Signal 4 - Sell, win. A third sell wave was stacked around $4,653.7 to $4,657 with a protective stop at $4,661. That final sequence reached another three profit targets at $4,651, $4,649, and $4,647.
Across the full day, one losing buy was followed by three winning sell sequences. That is the complete structure of the recovery.
Signal Performance Breakdown#
The first trade did real damage. The buy idea near $4,677 closed below $4,671 and put the room roughly $24,000 in the red. There is no clean way to soften that. April 7 only became special because what happened next was stronger than the first mistake.
The first sell wave repaired the tone immediately. Once the $4,667 to $4,670 area gave way, all four profit targets were cleared and more positions were closed as the decline accelerated. This was the moment the room stopped thinking about survival and started thinking about recovery.
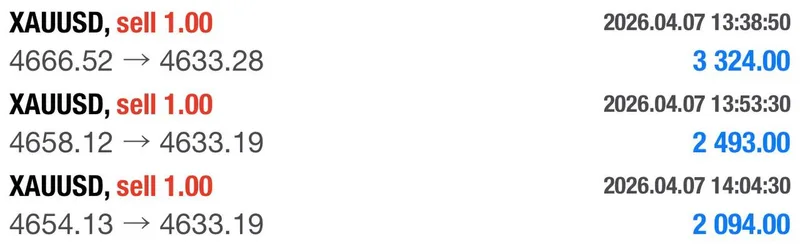
The second sell wave turned recovery into momentum. Gold sold off again from the $4,658 zone, three profit targets were hit inside two minutes, and the remaining positions were held long enough to finish at $3,324, $2,493, and $2,094 in profit per core position. That is the screenshot sequence that gave April 7 its identity.
The third sell wave finished the job. Another set of downside targets was cleared from the $4,653.7 to $4,657 zone, bringing the daily count to 10 profit targets across the three winning sell setups. By the time the final recap was posted, the account had gone from negative $24,000 to positive $19,147.45. That is not just a recovery. It is a full directional reset executed in real time.
The comparison to the April 2 session is useful here. April 2 was a reversal day because the market tone changed from the prior close. April 7 was even harsher because the tone changed during the session itself. The profitable edge came from recognizing that shift fast enough to trade the next three legs instead of mourning the first one.
Execution Lessons#
- Speed only matters after acceptance. The 13-minute pivot mattered because the first trade was accepted as wrong quickly. There was no long period of denial.
- Scaling worked because the market kept confirming the same idea. This was not random overtrading. It was one bearish read expressed through three separate waves as price kept breaking lower.
- Transparency helped discipline. The room saw the loss, saw the promise to recover it, and then saw the recovery happen live. That public pressure can expose weak discipline, but here it reinforced process.
- Recovery did not come from emotion. The closing message made that explicit. The session improved after emotion was removed, not because confidence suddenly returned.
There is also a broader lesson for anyone reviewing the screenshots after the fact. A comeback day can look glamorous when you only see the final profit number. The process is harder than the headline. It requires taking a real loss, changing the read without ego, and still executing cleanly while everyone else is watching.
What The Day Means Going Forward#

April 7 was the last active session before an extended break, with markets closed until next Tuesday. That matters because strong recovery days can create false certainty if traders treat them like a permanent regime shift. The closing dashboard still labeled gold bearish in the short term, and the intraday structure supported that caution. Buyers lost control once the early squeeze failed, and the best opportunities all came from trading with that downside pressure rather than against it.
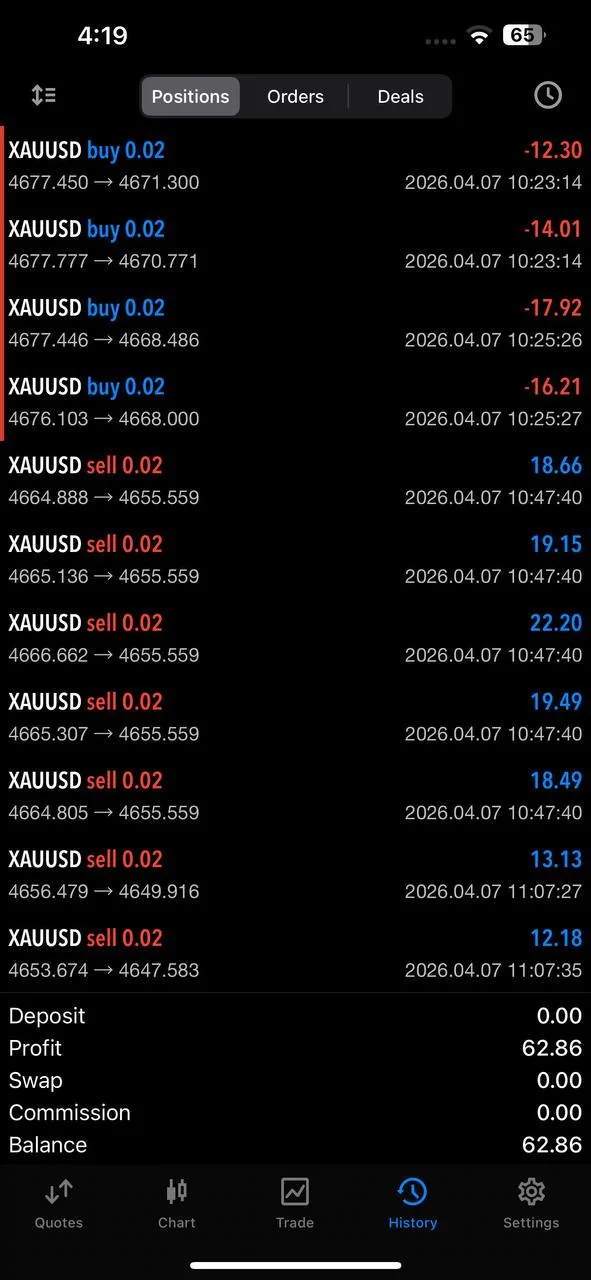
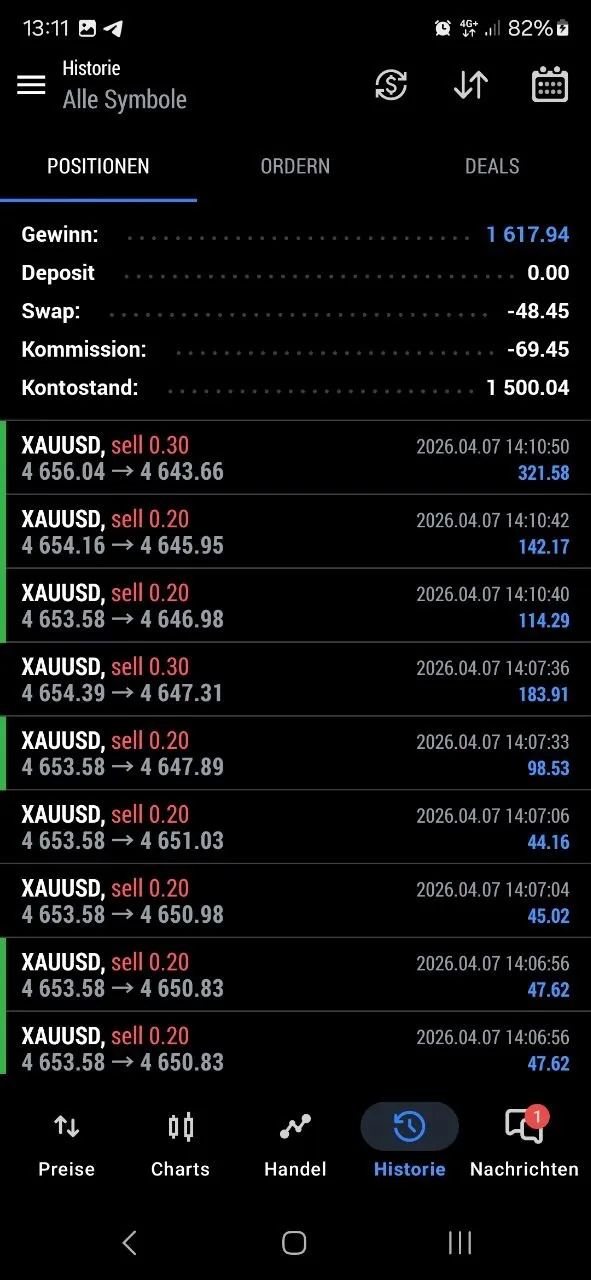
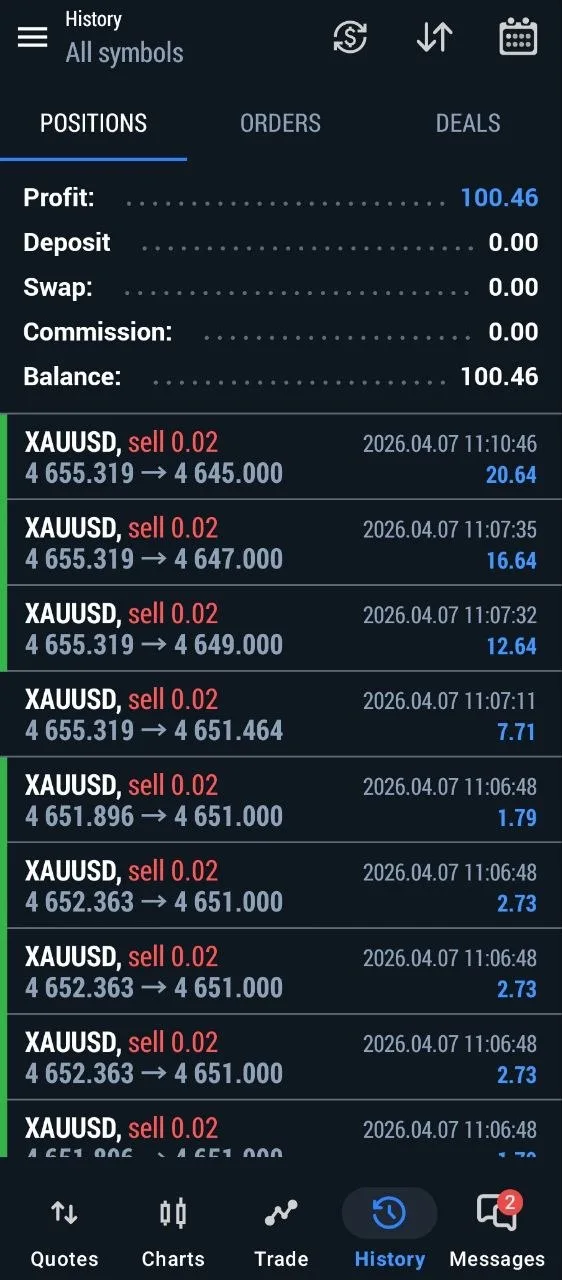
The community side of the day matters too. The recovery was not limited to Mo's own screenshots. Members posted their own before-and-after results, including smaller-account recoveries and larger wins such as EUR1,617.94. The pattern was the same: early pressure, a directional switch, then relief once the drop kept extending.
The $1,000 giveaway completed the mood of the session. Five community members received $200 each after the comeback day, which turned the close into more than a profit recap. It became a statement about resilience, generosity, and the kind of loyalty that gets built when the room sees the hard part as well as the winning part.
Use the break well. Revisit the March 30 report, compare it with the April 2 session, and then step back through the weekly review. The thread connecting them is not perfection. It is adaptation.
FAQ#
Why did the first trade lose?
The early buy failed because London-session selling pressure hit the market before gold could build stable momentum above Mo's buy zone. The protective stop did its job by cutting the trade once the upside thesis broke.
How did one session go from negative twenty-four thousand to positive nineteen thousand?
The recovery came from three consecutive sell setups after the buy failed. Each setup targeted the same downside move, and all three produced profit as the drop kept extending. The key was changing direction quickly instead of trying to force the original idea.
What happens while markets are closed?
No new signals are expected until markets reopen next Tuesday. The best use of the break is review: study the transition from the first loss to the sell-side recovery and compare it with the other recent reports linked above.
Connect with Gold Trader Mo#
- Free Signals: GTMO Trades
- Support: @GTMOBest
- YouTube: GTMOFX
- Instagram: mojirjees
- Website: Gold Trader Mo
Risk Disclaimer: Trading gold and other financial instruments carries substantial risk. Past results shown in this report are not a guarantee of future performance. You should only trade with money you can afford to lose. Gold Trader Mo provides educational analysis, not financial advice. Always consult a licensed financial advisor before making trading decisions.