Market Snapshot#
April 2 was the kind of session that punishes traders who assume yesterday's trend will survive one more day. On April 1, gold closed at $4,784.26 and the tone across the dashboard had already flipped bullish. Twenty-four hours later, XAUUSD closed at $4,645.05, down 2.91%, the regime read Bearish, and the market had rejected the $4,800 area decisively. That makes April 2 more than another profitable report. It was a reversal day, and the edge came from recognizing the reversal early instead of trading yesterday's story.
Market Dashboard#
| Metric | Value | Change | Source |
|---|---|---|---|
| XAUUSD Close | $4,645.05 | -2.91% | Investing.com |
| Fed Funds Rate | 3.50% - 3.75% | Unchanged | Trading Economics |
| DXY Index | 100.02 | +0.37% | Yahoo Finance |
| US 10-Year Yield | 4.311% | -0.011 pts | WSJ |
| WTI Crude Oil | $111.54 | +11.41% | Investing.com |
| VIX Index | 23.87 | -2.73% | Yahoo Finance |
| Gold Regime | Bearish | - | DailyForex |
That dashboard matters because it shows how fast the tape changed. The Daily Gold Trading Report April 1, 2026 described a strong bullish day with two winning buy sequences and roughly $25,000 in profit. April 2 erased that comfort. Gold did not consolidate quietly after strength. It reversed hard, lost almost 3% on the close, and punished anyone who came into the day emotionally attached to the previous session's upside.
The broader sequence also fits the recent rhythm covered in the Daily Gold Trading Report March 31, 2026, the Daily Gold Trading Report March 30, 2026, and the Gold Trading Weekly Forecast March 30-April 3, 2026. March 30 was a reset, March 31 started the rebound, April 1 extended it, and April 2 became the reminder that a strong trend day can still flip into a sharp sell day when macro pressure and stretched positioning collide.
Why The Tone Changed So Fast#
The macro backdrop gave traders several reasons to stay alert. April 2 marked the one-year anniversary of the "Liberation Day" tariff shock, so uncertainty was already part of the session mood. At the same time, WTI crude oil exploded 11.41% in its largest daily surge since 2020 as Middle East tension and Strait of Hormuz blockade fears rattled markets. Normally, traders like to reduce that kind of environment to a lazy headline such as "geopolitical stress equals gold up." April 2 was a better lesson than that.
Gold had already stretched into the $4,800 zone after April 1's bullish close. Once that area failed, the market stopped rewarding late buyers. The dollar firmed by 0.37%, which removed some of the easy upside support gold had enjoyed the day before. The VIX actually eased by 2.73%, which told traders that this was not a classic panic bid into gold. It was a crowded long market being forced to unwind while the dollar recovered and oil's shock created a different kind of macro pressure.
That is why the tone changed so quickly. Most traders were still reading April 1 and looking for another buy continuation. Mo read April 2 in real time. He did not marry the previous day's bias. He saw the rejection, accepted that bullish momentum was no longer the clean story, and flipped from buy-side execution to sell-side execution. That adaptability is the real headline behind the $17,048.75 day result.
There is also a trading psychology point here. Many traders think discipline means staying loyal to the previous bias until the chart feels safe again. In practice, that often means reacting too late. April 2 rewarded the opposite behavior. The traders who waited for emotional comfort watched the cleanest move disappear in the first minute. The trader who accepted the reversal and acted on it captured both sell waves almost immediately.
Technical Outlook#
Technically, April 2 is best read as a rejection day after an overheated close. Gold failed near the $4,800 zone, reversed into a Bearish regime, and closed at $4,645.05. The active execution windows inside the room were the sell zones at 4622-4625 and 4626-4629, which is where Mo and the community took advantage of the reversal rather than waiting for end-of-day confirmation.
| Lens | Reading |
|---|---|
| Prev. day close | $4,784.26 on April 1 |
| Current close | $4,645.05 on April 2 |
| Session character | Bearish reversal after rejection from the $4,800 area |
| Active execution zones | Sell 4622-4625 and sell 4626-4629 |
| Macro overlay | Stronger dollar, steady Fed, oil shock, lower VIX |
| Short-term bias | Bearish while rallies keep failing after the April 1 blow-off |
| What bulls need next | A convincing recovery in tone, not just a small bounce |
| What bears want | More failed rebounds and continued pressure after the reversal close |
One detail worth keeping straight is the difference between the dashboard close and the live trading feed. The report dashboard uses the authoritative external close from Google AI Mode sources, while Mo's signals came from the live trading feed used for execution. That difference does not change the story. The close says gold reversed sharply lower from the April 1 strength. The signals show that the cleanest money was made by selling into that reversal early.
For traders following the recent sequence, the message is simple: April 1 proved Mo could press the long side when the market rewarded buys, and April 2 proved he could reverse just as fast when that read stopped working. That is a more useful form of technical discipline than repeating the same bias across every session.
Trading Signals#
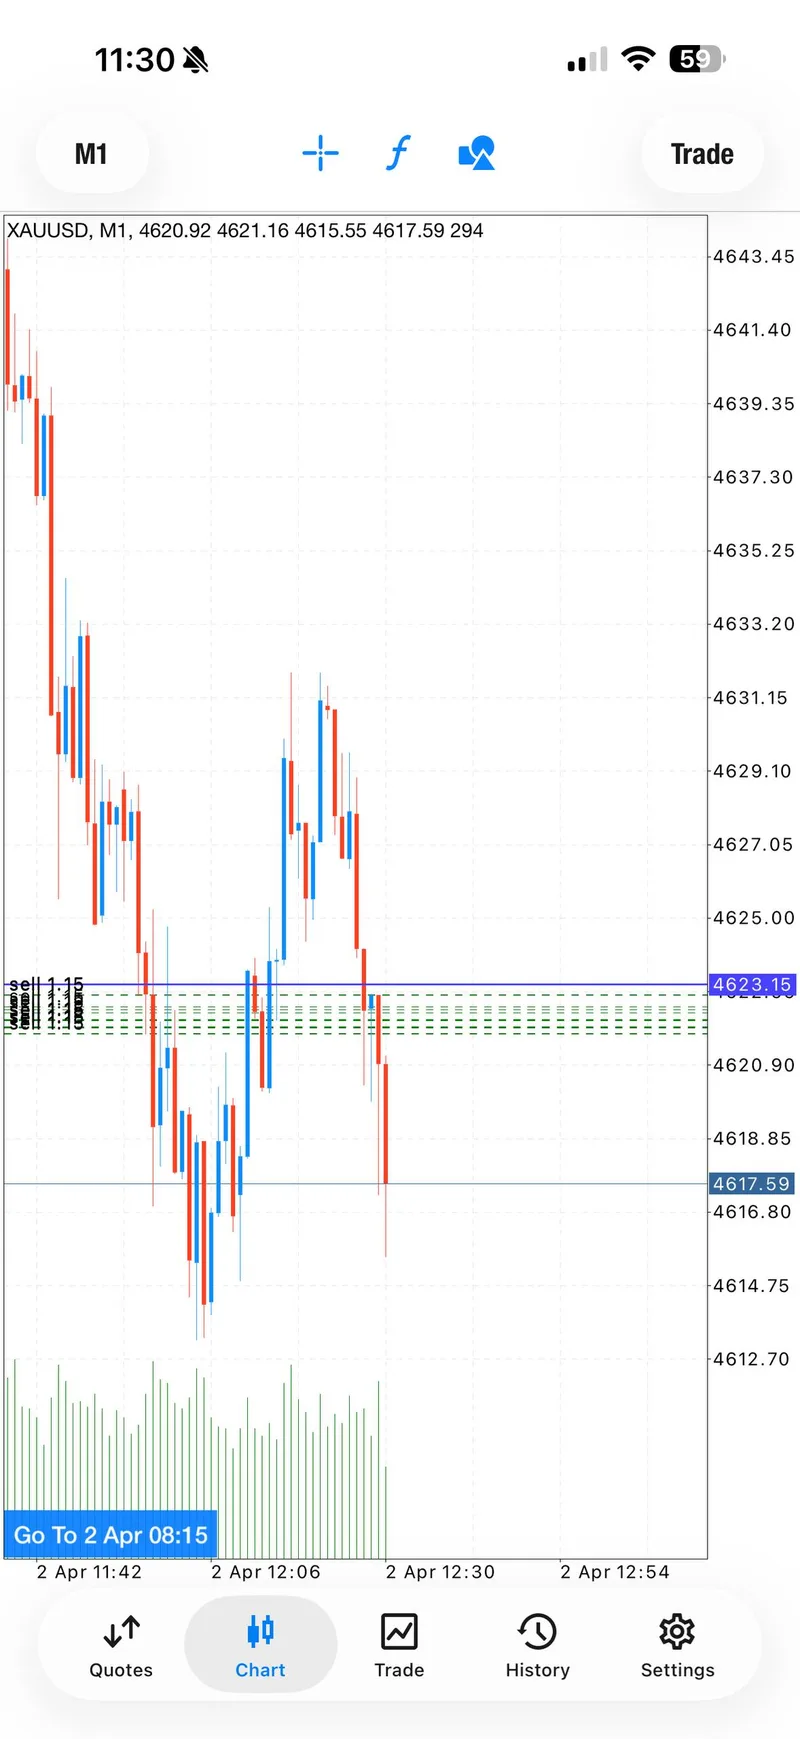
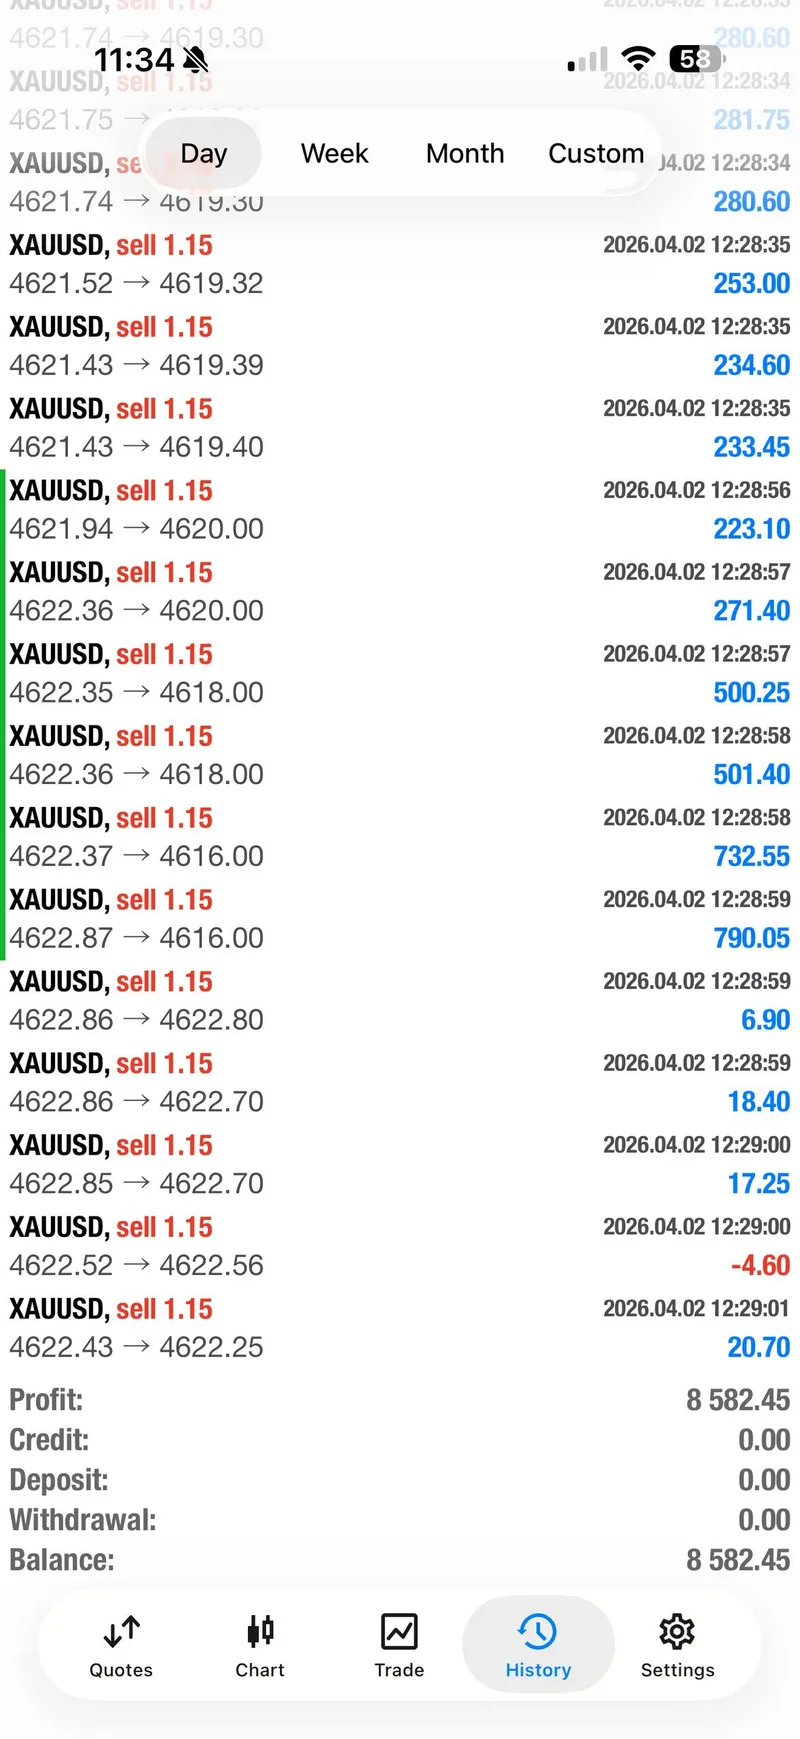
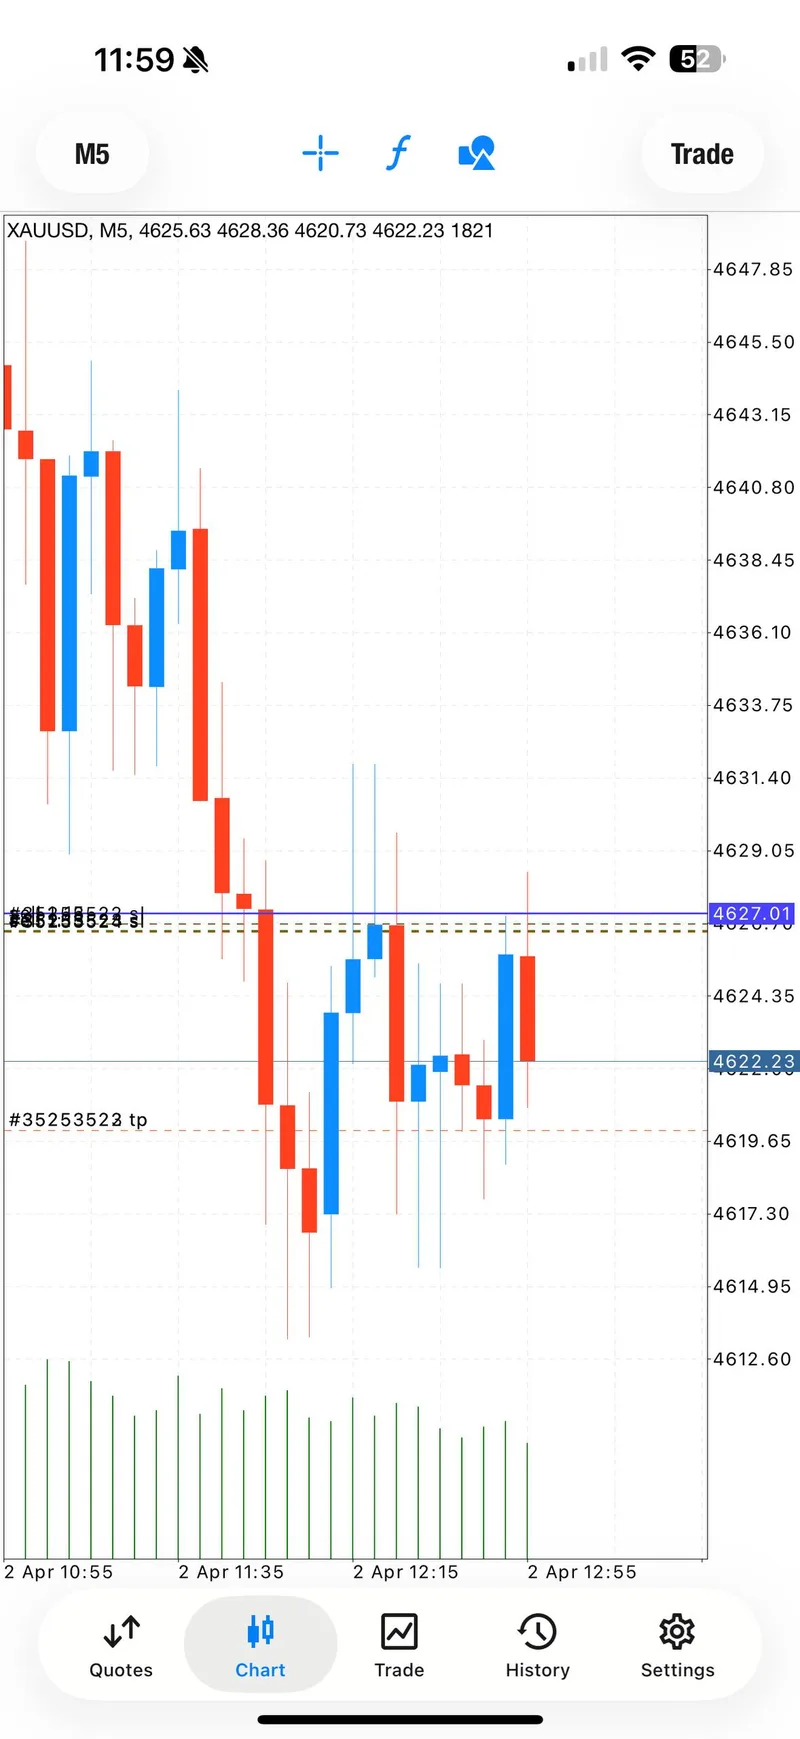
April 2 delivered two sell trades, and both of them were fast. Signal 1 was SELL 4622-4625 with a stop above 4628 and targets at 4620, 4618, and 4616. All three targets were hit in 60 seconds. The room update was blunt: "3 TP'S IN 60 SECONDS!!" Most entries were closed into the flush, two remaining entries were later closed deeper in profit, breakeven protection was applied, and the trade was fully managed without hesitation.
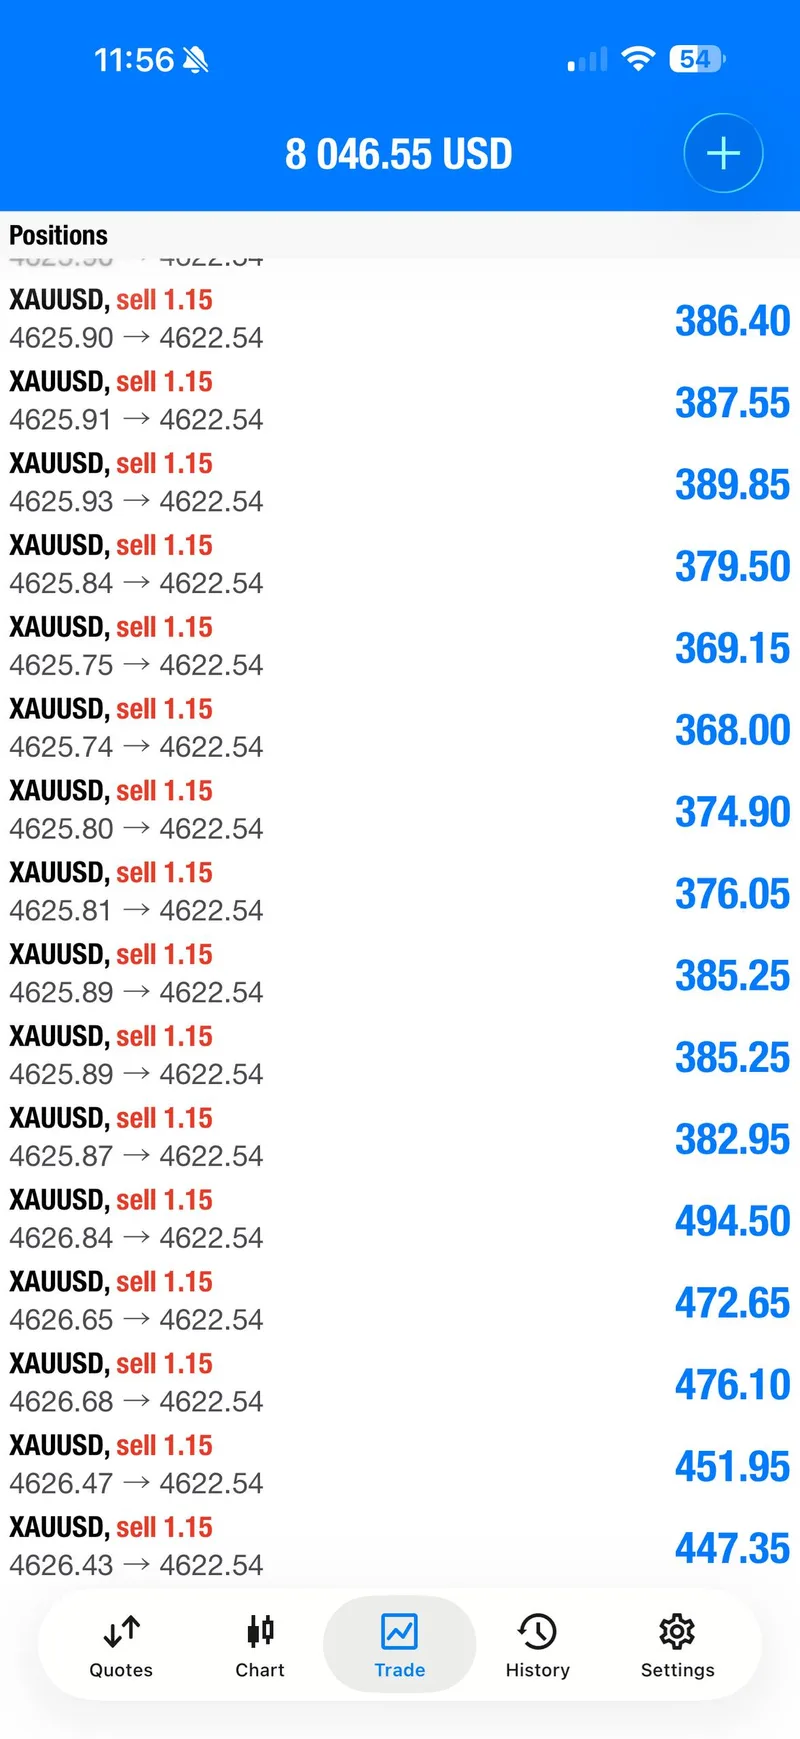
Signal 2 came from the same mindset, not from greed. After the first sell worked, Mo did not force a random re-entry. He waited for a second valid setup and posted SELL 4626-4629 with a stop above 4633 and targets at 4624, 4622, and 4620. Once again, all three targets were hit in under 60 seconds, and the final remaining entry was protected and closed at breakeven after the move had already paid.
The important distinction is that this was not a slow grind where traders had all afternoon to make up their mind. The speed was the edge. On both signals, the best part of the opportunity was over almost immediately. That is where the FOMO contrast becomes honest rather than dramatic: most traders who needed more confirmation were still thinking about another April 1 buy while the April 2 sell money had already been booked.
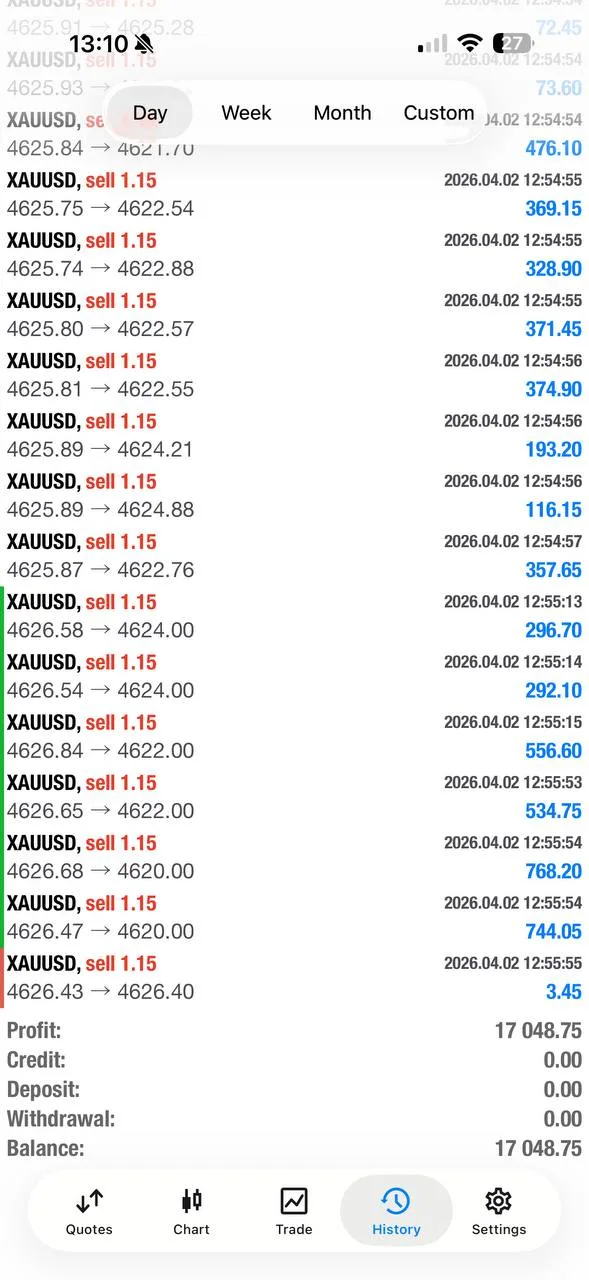
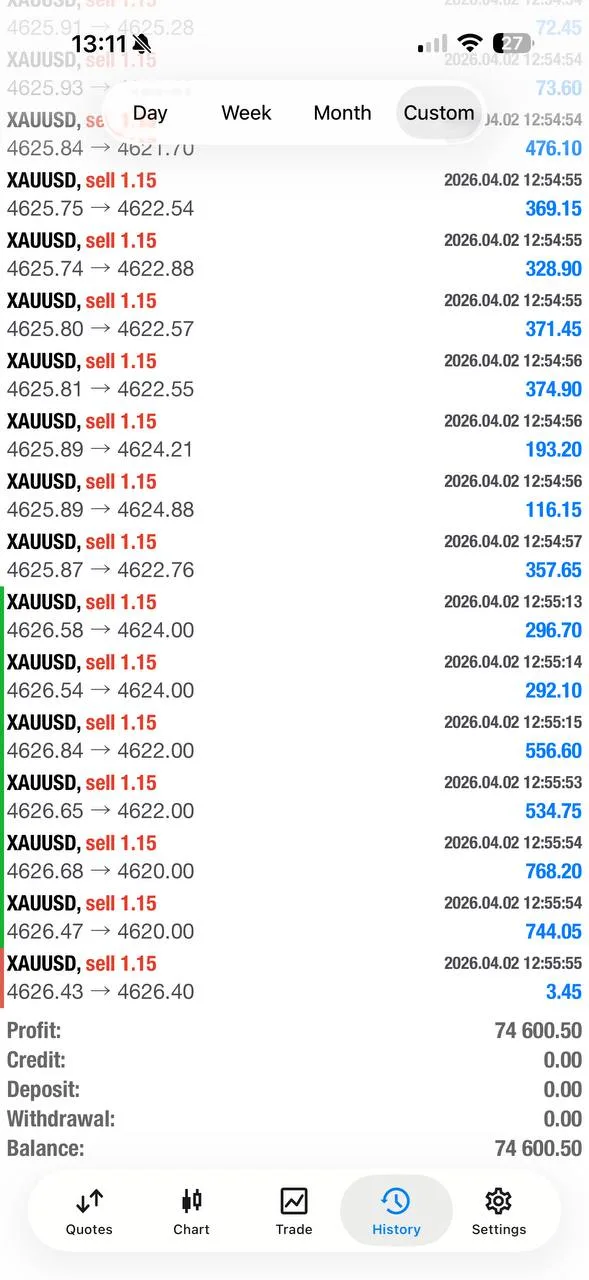
Mo's recap at the end of the session captured the tone perfectly. Roughly $17,000 for the day, roughly $74,000 for the week so far, both trades hit three take-profits, and the day finished with a 100% win rate again. That is not impressive because it sounds loud. It is impressive because the market context changed completely and the execution changed with it.
Signal Performance Breakdown#
The first sell wave created the foundation for the entire day. The selected history image shows $8,582.45 from the first trade cluster, which is strong proof that the opening reversal was not just a chart idea. It was realized profit. The accompanying chart image shows why it moved so cleanly: the sell zone was tight, the rejection was immediate, and price flushed directly into the target area without giving late traders much time to negotiate with themselves.
The second sell wave added another $8,046.55, bringing the session total into the same neighborhood as the final recap. That matters because it confirms the day was not dependent on one oversized move or one lucky screen capture. Two separate sell ideas paid. Two separate groups of targets were cleared. Two separate proof images showed the money being made.
The day-history screenshot then closed the loop with a posted day total of $17,048.75, while the week-history screenshot showed $74,600.50 week to date. Those two summary images are what turn a good Telegram recap into a documented report. They connect the fast intraday execution to the broader weekly performance trend, and they show that April 2 was not an isolated spike. It was part of a larger recovery in consistency.
There is another reason the breakdown matters. Traders often misread winning days by focusing only on the final number. April 2 was not only about the size of the result. It was about how quickly the result was recognized and harvested. Every target on both signals was hit in less than a minute. That kind of session rewards preparation, conviction, and fast management. It is hostile to hesitation.
Execution Lessons#
The first lesson is that adaptability beats attachment. April 1 was a buy day. April 2 was a sell day. Mo did not try to defend a bullish opinion just because it had worked the day before. He treated the new session as a new problem. That sounds basic, but it is where many traders fail. They remember the previous win, chase the previous direction, and miss the current opportunity.
The second lesson is that speed matters most on reversal days. On a slow trend day, late entries can still find room. On April 2, the cleanest part of both moves lasted less than 60 seconds. If you were waiting for the market to prove itself emotionally, the market was already gone. That is why reversal days often feel unfair to the crowd and efficient to the prepared trader.
The third lesson is that proof should be layered. April 2 had chart proof, trade-history proof, day-total proof, week-total proof, and community proof. That layered structure is useful because it keeps the report grounded. It is easy for a Telegram audience to see a winning screenshot and assume it was a one-off. It is harder to dismiss six profit images, seven community images, a $17,048.75 day total, and a $74,600.50 week-to-date total.
The fourth lesson is the FOMO lesson. Most traders waited for another upside continuation because April 1 had trained them to buy dips. Mo did the uncomfortable thing instead. He sold the failed strength. That is the difference between following the market and following your own memory of the market.
What The Day Means Going Forward#
April 2 matters because it reset the conversation. The story is no longer just that gold can trend hard. The story is that gold can flip hard, too, and that the trader with the clearest read can profit on both sides of that transition. Coming out of April 1, many traders would have been happy to talk themselves into another upside extension. April 2 showed how dangerous that can be when the market has already rejected the high and the macro backdrop is changing under your feet.
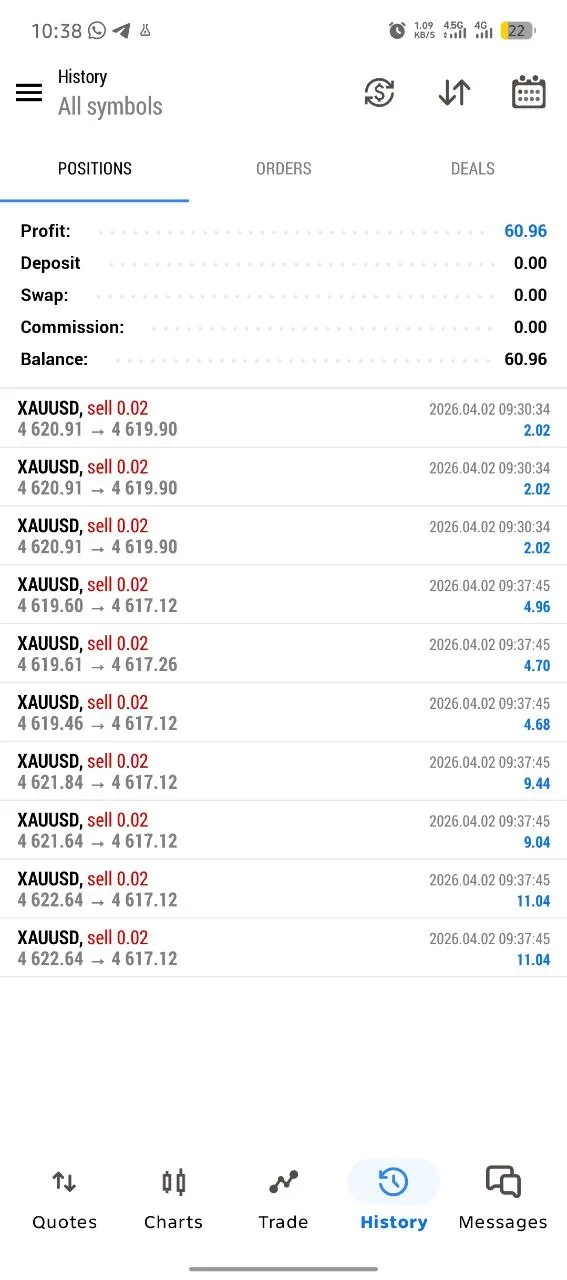
The community screenshots make that point visible across account sizes.
One member shared a $60.96 profit from the first sell wave, proof that even early partial participation in the reversal was enough to get paid.
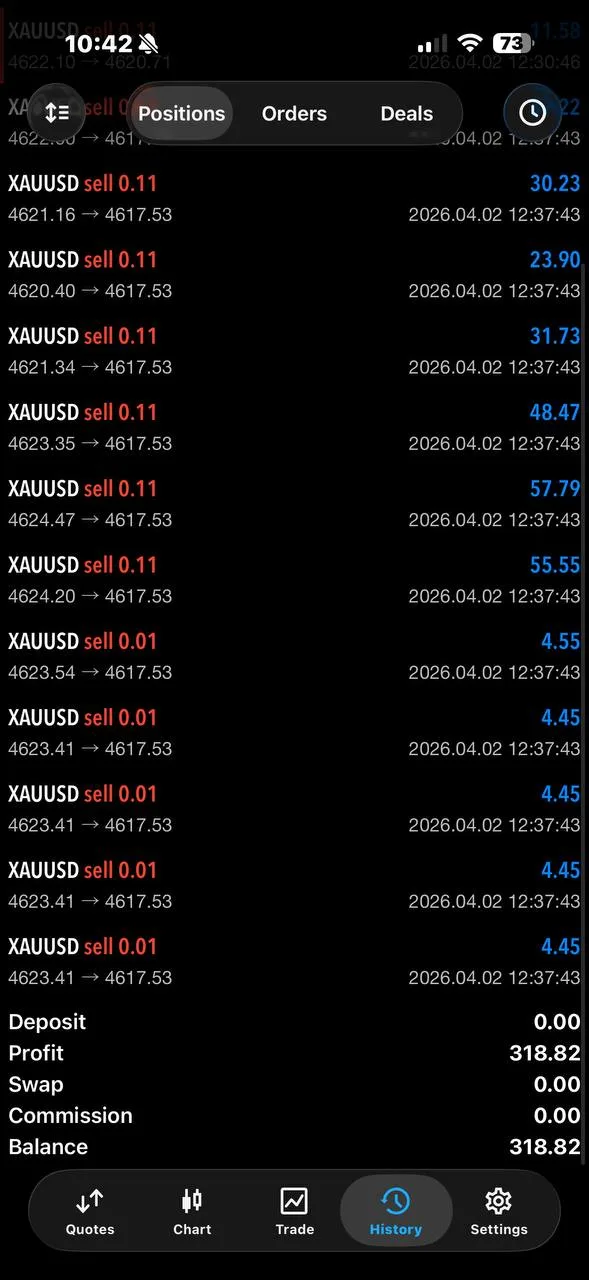
Another screenshot showed $318.82 in profit, confirming that the move was not reserved for one oversized account or one perfect entry.
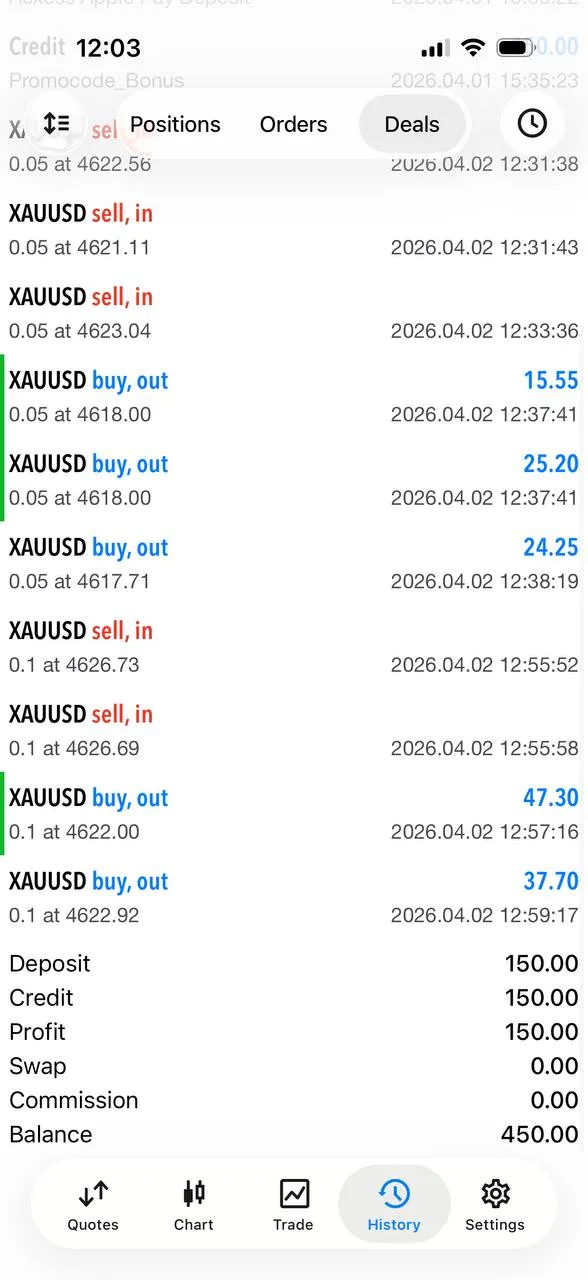
A white-screen deal history showed $150 in profit on a $450 balance, which is exactly the kind of grounded evidence that turns a fast move into believable community proof.
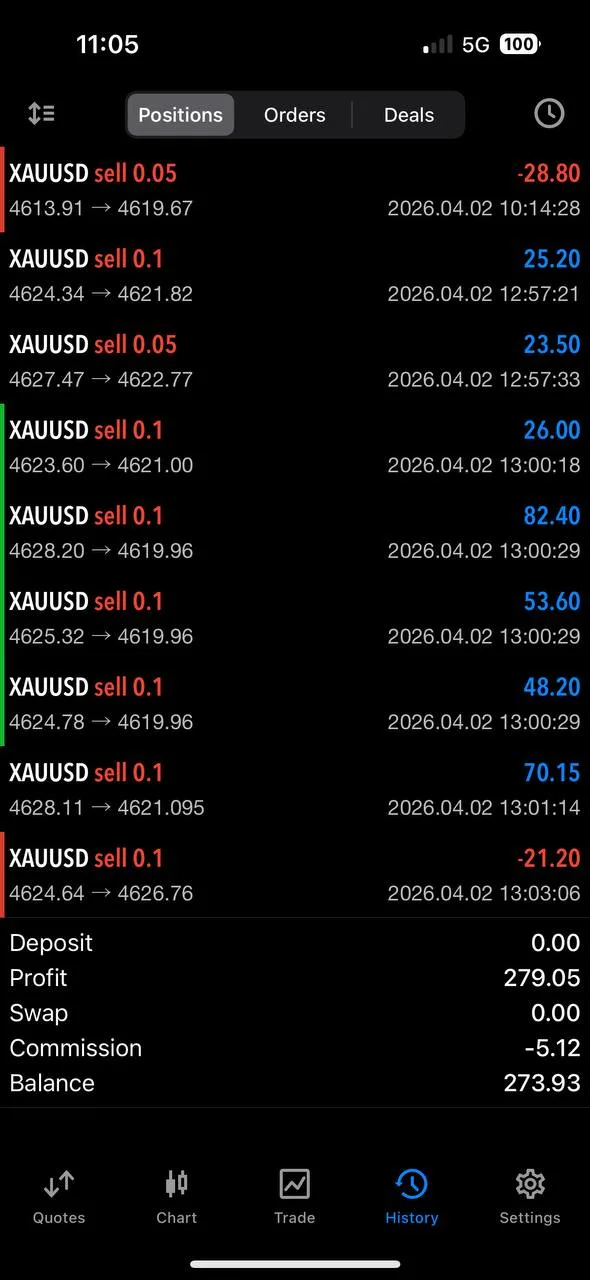
Another member posted $279.05 from the same sell-side environment, reinforcing that the reversal had breadth inside the room.
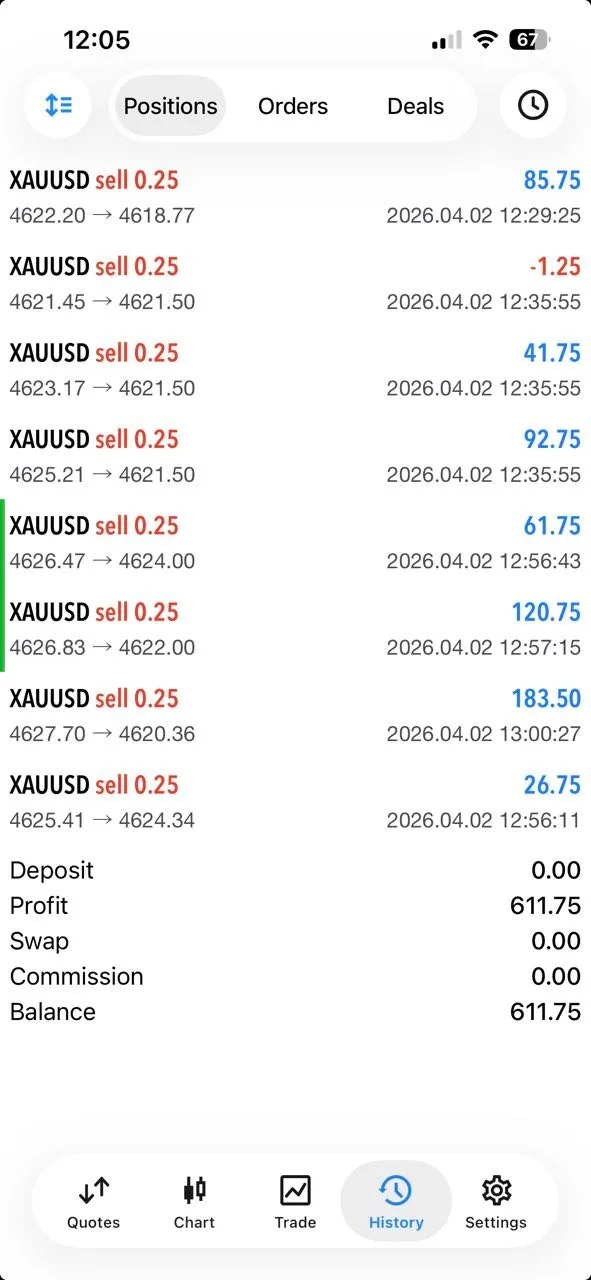
One of the strongest community results showed $611.75, which turns the session into a real FOMO day for traders who kept waiting for bullish confirmation.
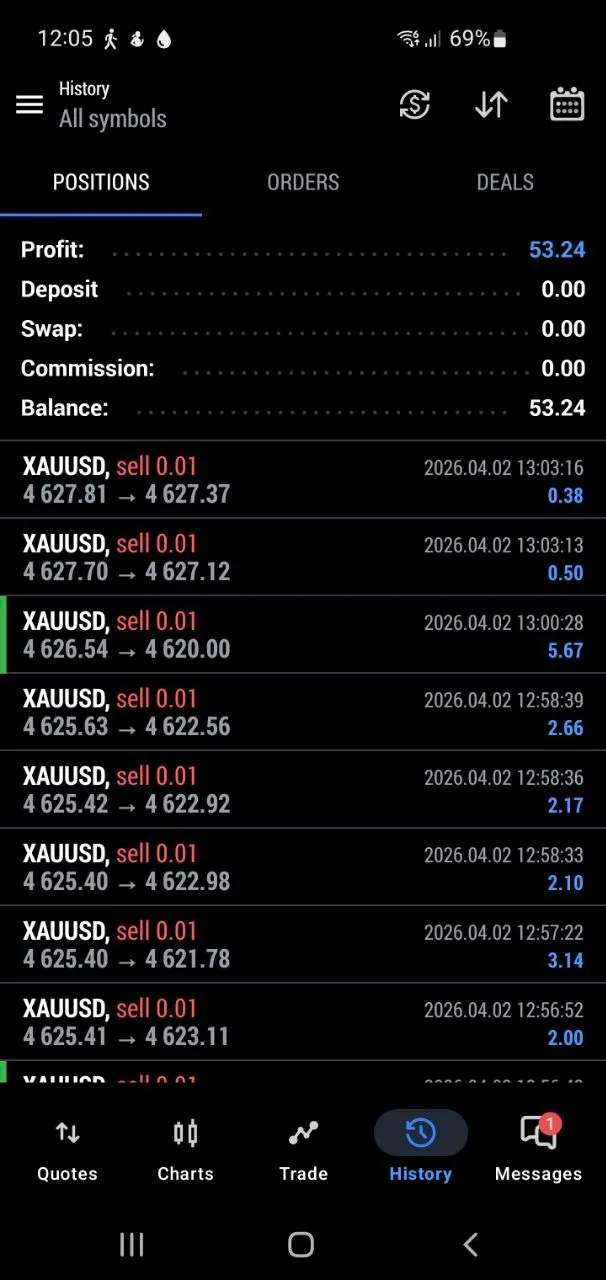
A smaller account still posted $53.24, a useful reminder that this was not only a big-balance story.
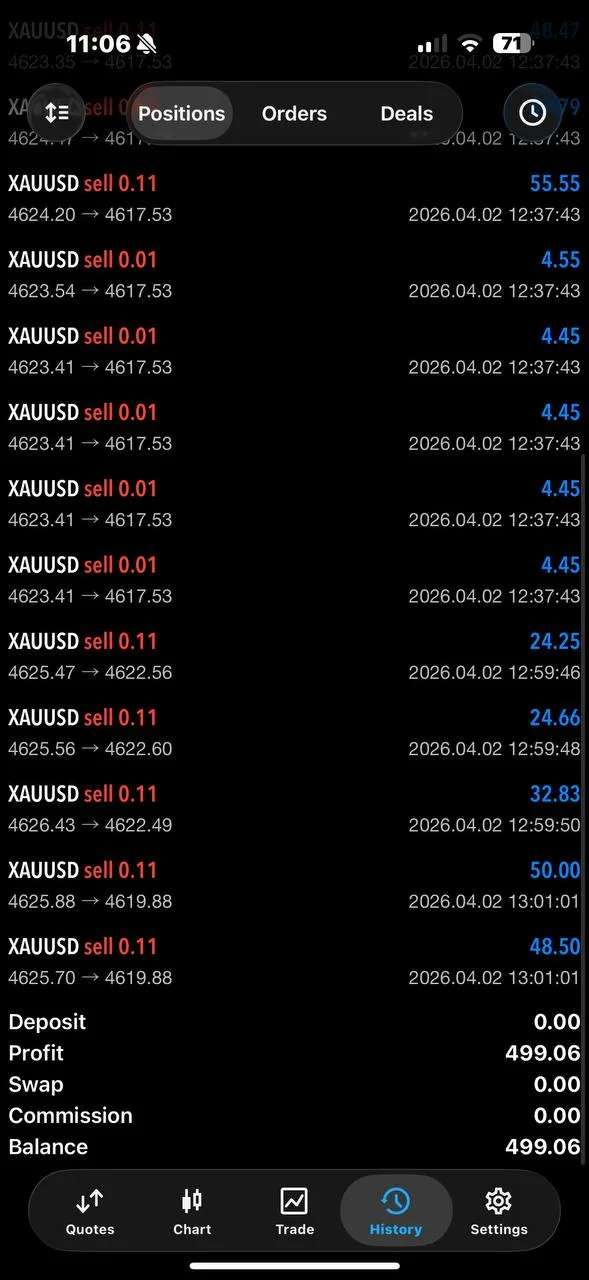
Another dark-mode history screenshot showed $499.06, giving the room one more piece of evidence that the sell execution translated across different members and account sizes.
Going forward, the key question is whether April 2 was the start of a deeper bearish unwind or a violent reset inside a still-volatile gold market. The answer will depend on whether rallies continue to fail after the $4,800 rejection and whether the macro mix stays hostile to late gold buyers. If the dollar keeps firming while oil remains elevated and volatility stays oddly calm, gold may struggle to reclaim the easy bullish tone it had on April 1.
That is why the recent sequence should be read together, not separately. The Daily Gold Trading Report April 1, 2026 shows the prior bullish momentum. The Daily Gold Trading Report March 31, 2026 shows the rebound building underneath it. The Weekly Gold Trading Summary March 23-27, 2026 shows the larger environment traders were already navigating. April 2 slots into that sequence as the day Mo proved he could stop buying strength and start selling weakness without losing tempo.
FAQ#
Was April 2 a clean reversal day?#
Yes. Gold moved from an April 1 bullish close at $4,784.26 to an April 2 bearish close at $4,645.05, while Mo flipped from buy-side execution to two winning sell trades.
Why did gold fall even with oil surging and geopolitical tension rising?#
Because gold was already stretched near the $4,800 zone, the dollar strengthened, and volatility eased instead of exploding. That combination created a better environment for profit-taking and reversal than for another clean safe-haven breakout.
What does the 100% win rate refer to here?#
It refers to both official April 2 signals finishing as winners, with every listed target on both trades hit and the remaining management handled after profits were already secured.
Why do Mo's signal prices differ from the dashboard close?#
The signals came from the live execution feed used for the room, while the dashboard close comes from the authoritative external market sources. The directional story is the same even when the exact displayed prices are not identical.
What should traders watch next?#
Watch whether gold can rebuild bullish acceptance after the $4,800 rejection or whether every bounce keeps failing. That will decide whether April 2 becomes a one-day flush or the beginning of a wider bearish reset.
Connect with Gold Trader Mo#
The real value in a session like April 2 is not just the result. It is the decision-making standard behind the result: read the market that is in front of you, not the one that paid yesterday. That is the habit Mo keeps teaching through the daily reports, the charts, and the community proof that follows each session.
Visit Gold Trader Mo for daily market reports, education, and platform updates. You can also follow the public channel at https://t.me/gtmo and message support at https://t.me/gtmobest.
Risk Disclaimer: Trading gold carries significant risk. Past results do not guarantee future returns. Only trade with money you can afford to lose. This material is educational and is not financial advice.