
Market Snapshot#
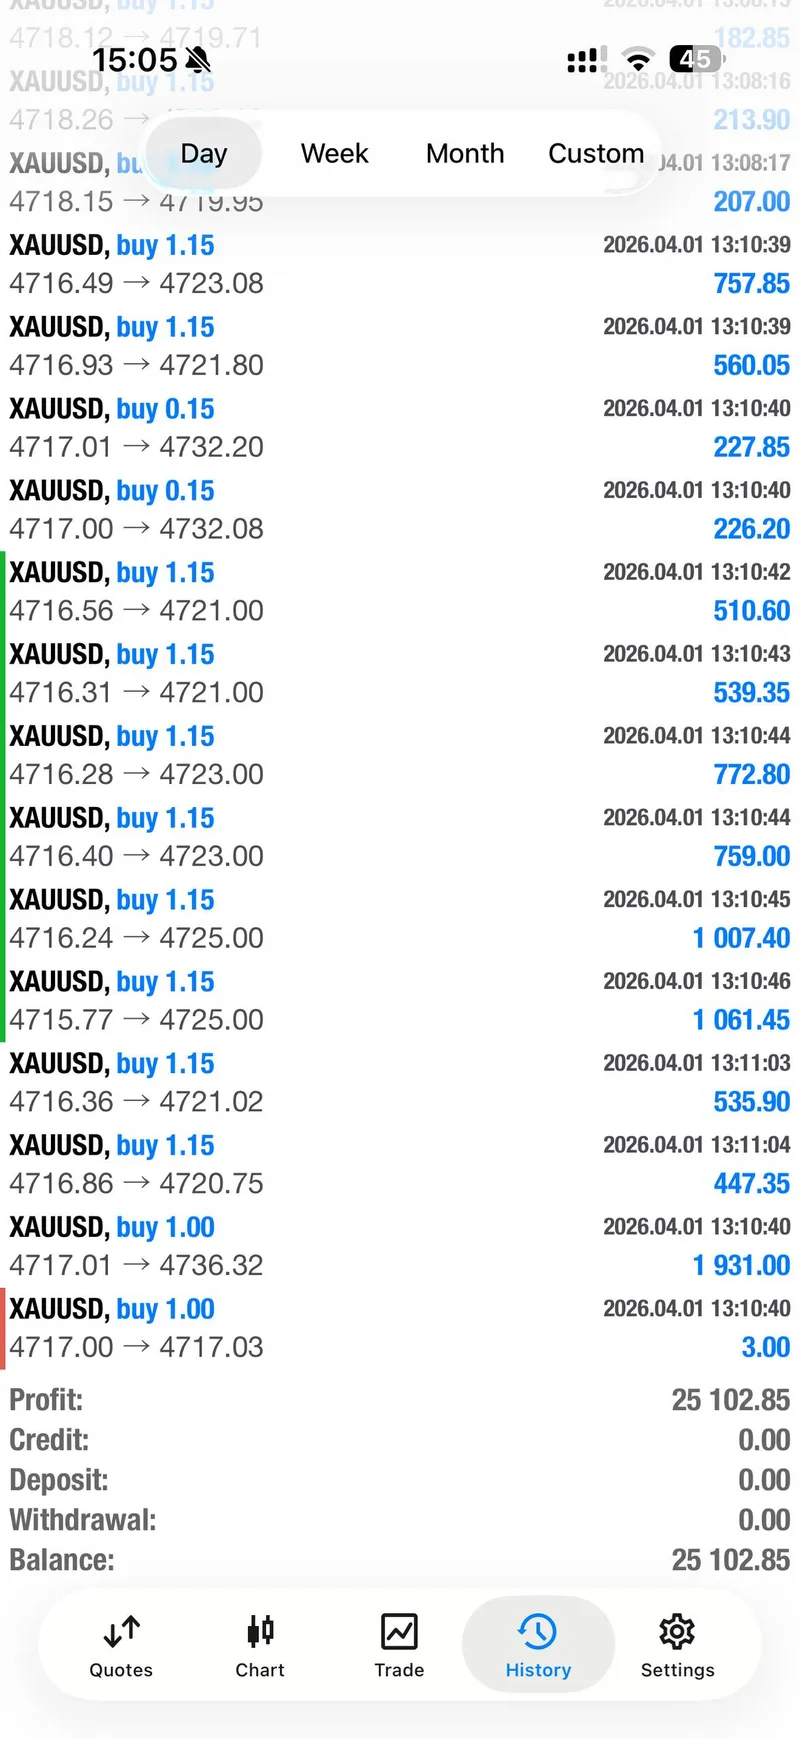
April 1 was the first session in this recent stretch where the dashboard stopped reading like a rebound inside caution and started reading like a real momentum day. Gold closed at $4,784.26, up 2.40%, and the official market label flipped to Bullish / High Momentum. That is the headline before we even get to Mo's execution: two winning buy sequences, a mid-session history screen showing $10,552.40 already booked, and a later day recap showing $25,102.85.
Market Dashboard#
| Metric | Value | Change | Trend |
|---|---|---|---|
| XAUUSD | $4,784.26 | +2.40% | Up |
| DXY | 99.49 | -0.47% | Down |
| US 10Y Yield | 4.32% | +0.01 pp | Slightly Up |
| WTI Crude | $98.88 | -2.47% | Down |
| VIX | 24.54 | -2.81% | Down |
| Fed Funds Rate | 3.50% - 3.75% | Unchanged | Hold |
| Gold Regime | Bullish / High Momentum | Shifted | Up |
The contrast with the previous session matters. The Daily Gold Trading Report March 31, 2026 still described a rebound inside a bearish and consolidating backdrop. On April 1, the official close pushed even higher and the regime label changed with it. For nearby context, compare this move with the reset day in the Daily Gold Trading Report March 30, 2026 and the caution that framed the Daily Gold Trading Report March 27, 2026.
Why The Tone Changed So Fast#
The tone changed because the market stopped treating gold as a damaged bounce and started paying for upside continuation. The Fed stayed unchanged at 3.50% - 3.75%, the dollar fell 0.47%, oil dropped 2.47%, and the VIX eased another 2.81%. Even though the US 10Y yield ticked up by 0.01 percentage points, that small rise was not enough to stop buyers from chasing strength.
That combination is important because it shows April 1 was not just a clean rates story. Gold climbed anyway. A softer dollar helped, calmer volatility helped, and traders were willing to keep buying momentum after March 31 had already finished strong. The result was a session where the official market close ran far beyond the intraday Telegram execution zone near 4716-4725.
This is the real narrative shift: March 31 still looked like a rebound that needed to prove itself. April 1 looked like follow-through. That is why the dashboard moved from Bearish / Consolidation to Bullish / High Momentum in a single session.
Technical Outlook#
| Lens | Reading |
|---|---|
| Structure | Momentum continuation after the March 31 rebound |
| Official close | $4,784.26 |
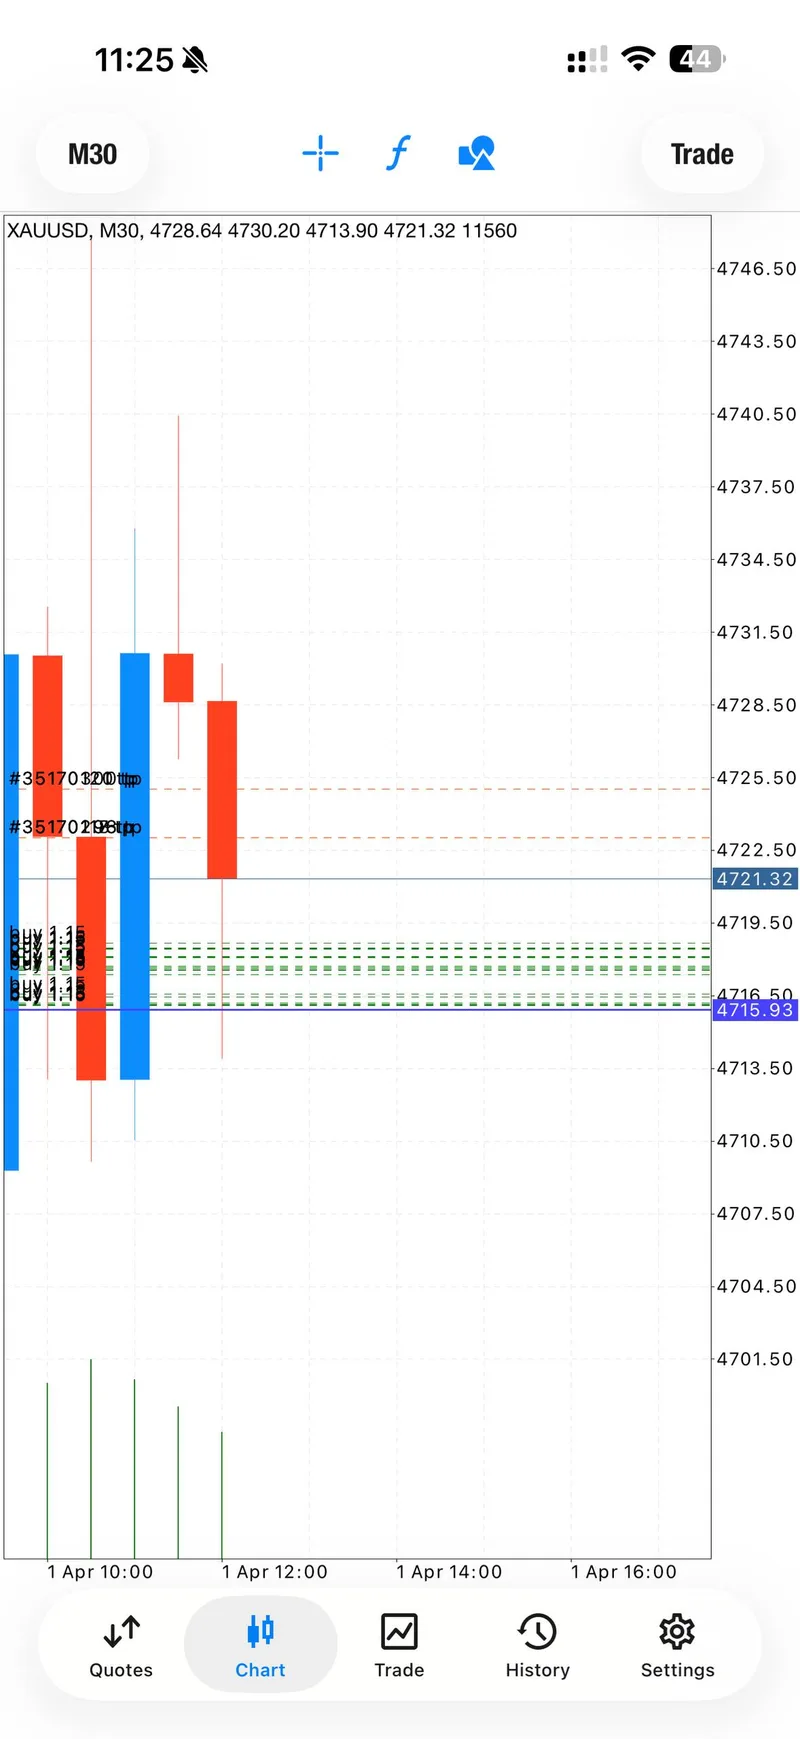
| Intraday execution zone | 4716 to 4725 |
| Short-term bias | Bullish while price keeps holding above the April 1 launch zone |
| Medium-term bias | Improved, but needs another strong close to confirm the flip is durable |
| What buyers need | Hold the breakout feel and keep dips shallow |
| What sellers need | Force price back below the April 1 launch area and kill momentum quickly |
The technical picture is straightforward at the highest level and messy underneath. At the highest level, gold closed far above the two intraday buy zones, which confirms that buyers owned the day. Underneath, the trade path still mattered: both winning sequences were launched from the same 4716-4719 neighborhood, which means that area now matters as a reference for whether bullish continuation is staying healthy or losing steam.
For the broader frame, the Gold Trading Weekly Forecast March 30-April 3, 2026 and the Weekly Gold Trading Summary March 23-27, 2026 help explain why this move matters. April 1 was strong enough to change tone, but the next sessions still need to defend that tone.
Trading Signals#
April 1 had two winning buy waves.
- Signal 1: BUY 4719.3-4716, protective stop 4712, targets 4721 / 4723 / 4725 / open. The stop was later adjusted to 4710. Price moved back above all entries, the first two targets were confirmed, and the remaining entries were protected at breakeven after partial profit was taken.
- Signal 2: BUY 4719-4716, protective stop 4712, targets 4721 / 4723 / 4725 / open. This second wave was posted inside the members room and then echoed into the public channel as proof once it was already running. Targets cleared again, one entry was closed well above the entry level, and the later recap said the second trade kept extending far beyond all posted targets.
The important point is that April 1 was not a one-shot win. The same launch zone worked twice. That gave the session a very different feel from March 31, where the story started with an early failure before the recovery took over.
Signal Performance Breakdown#
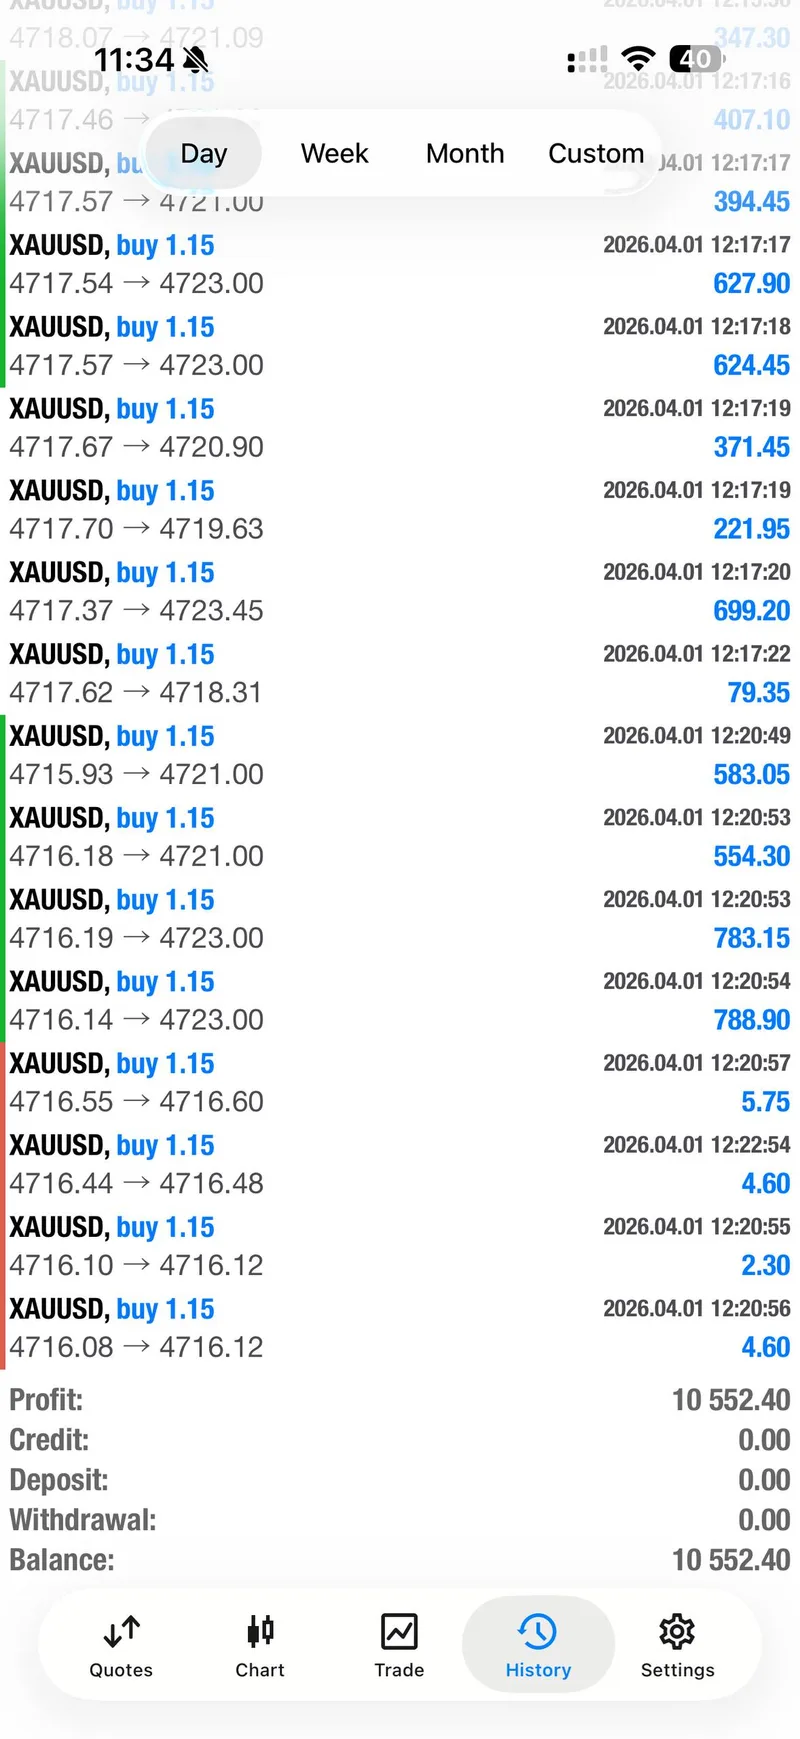
The first wave did exactly what a clean buy sequence should do. The zone at 4719.3-4716 held, the stop was adjusted from 4712 to 4710, and the channel started taking money off the table as price pushed through the target ladder. By 09:34 UTC, the posted history screen said the last few entries were at breakeven and $10,000 had already been closed near the top. The supporting screenshot in the packet shows a day-history total of $10,552.40.
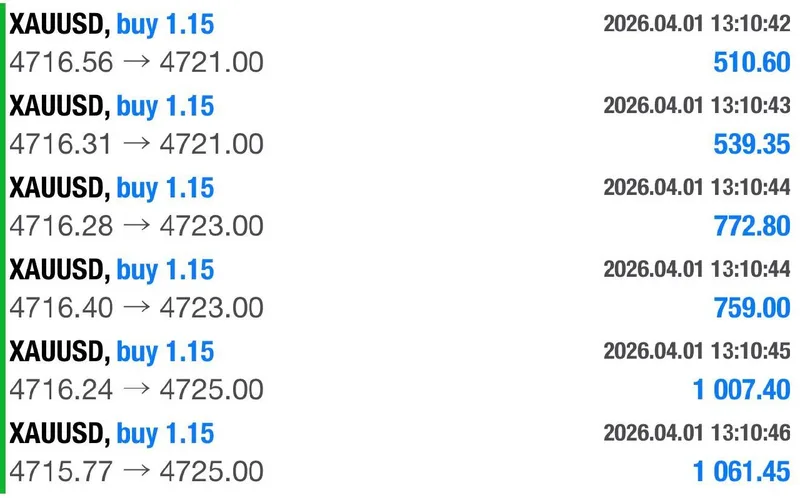
The second wave was even more important for the April 1 story because it proved that demand did not disappear after the first banked win. The members-room re-entry from 4719-4716 started paying again from 10:20 UTC onward, then the updates showed the gains growing steadily as the move kept stretching. The detailed ledger crop shows closes such as 510.60, 539.35, 772.80, 759.00, 1,007.40, and 1,061.45, while the final day-history screen shows $25,102.85 total profit.
That combination is why April 1 should be logged as a true win day rather than a marginal positive session. The trade management did not just protect the first move. It kept converting the second move into larger closed gains as gold accelerated.
Execution Lessons#
The first lesson is that a repeated zone only matters when the market keeps proving it. Both April 1 winning waves launched from the same 4716-4719 area, but they were not treated the same way by the channel. The first wave was managed and partially closed quickly. The second wave was managed more aggressively only after the market showed it could hold and extend again.
The second lesson is that April 1 was a management day as much as an entry day. Stop adjustment, breakeven protection, and partial closes showed up throughout the message flow. That is one reason the result scaled so far beyond the original target ladder.
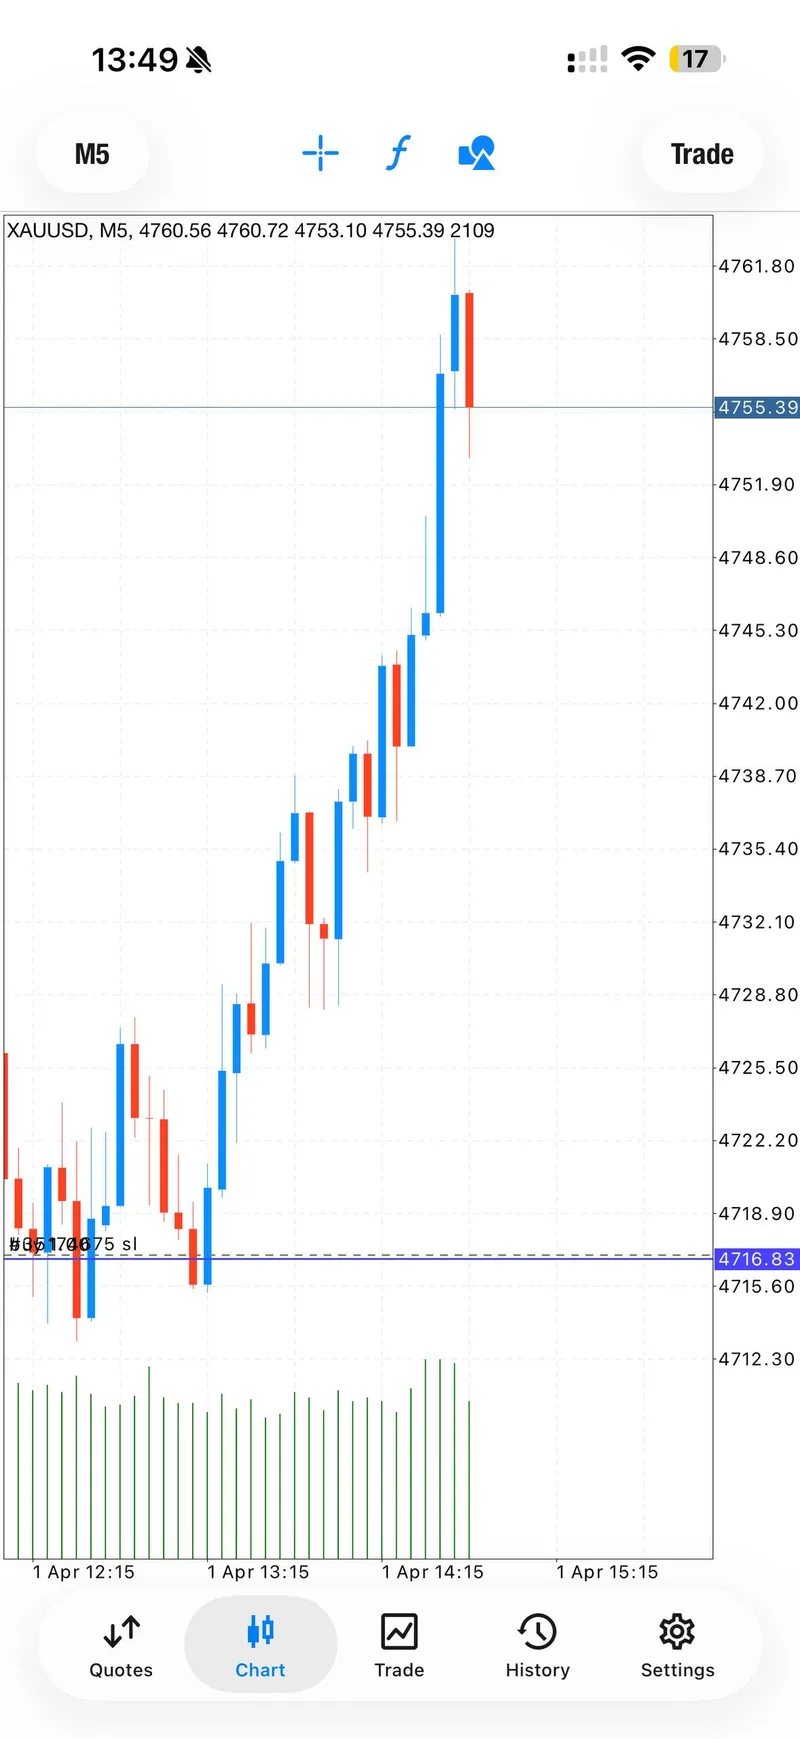
The third lesson is that official market closes and live trade windows can tell two different stories. Mo's actionable price zone sat around 4716-4725, but the official market close printed at $4,784.26. If you only look at the close, you miss how the move was actually built.
What The Day Means Going Forward#
April 1 gives bulls something stronger than hope. It gives them continuity. March 31 improved the tape, but April 1 changed the label. A market that closes at $4,784.26 and flips into Bullish / High Momentum deserves more respect than a one-day rebound story.
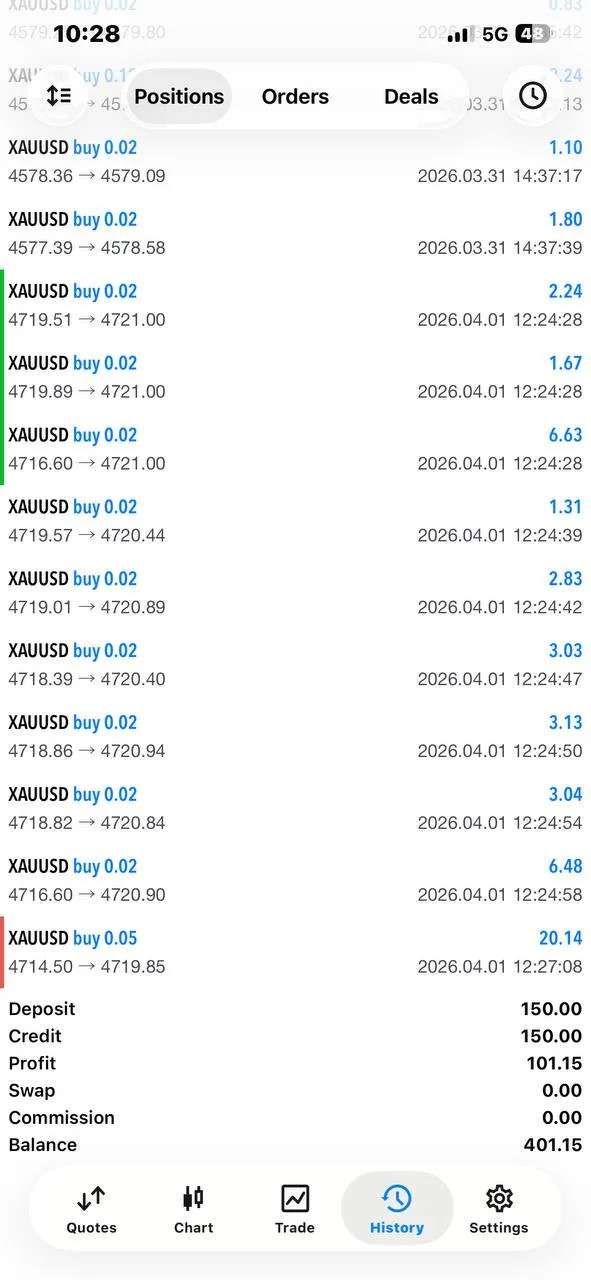
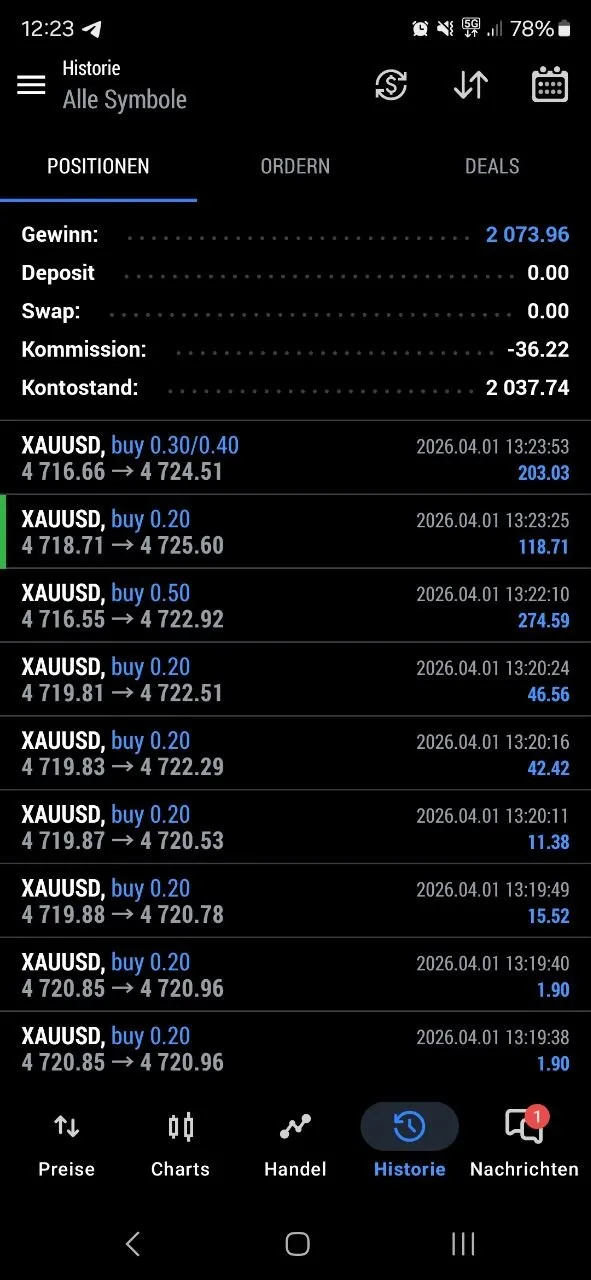
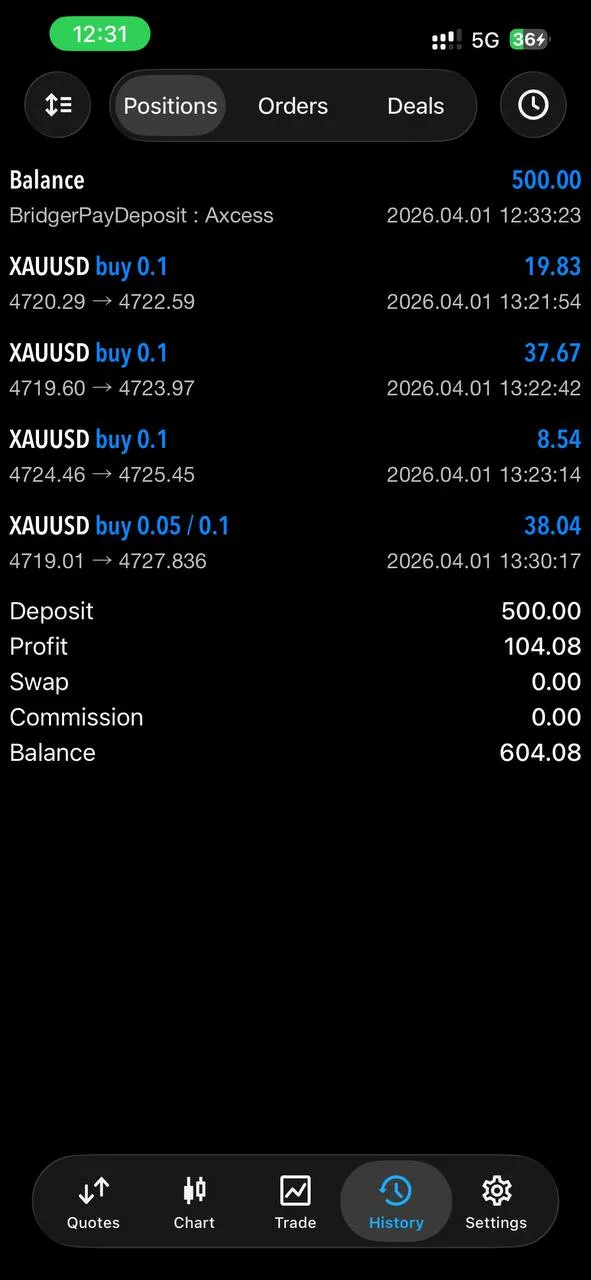
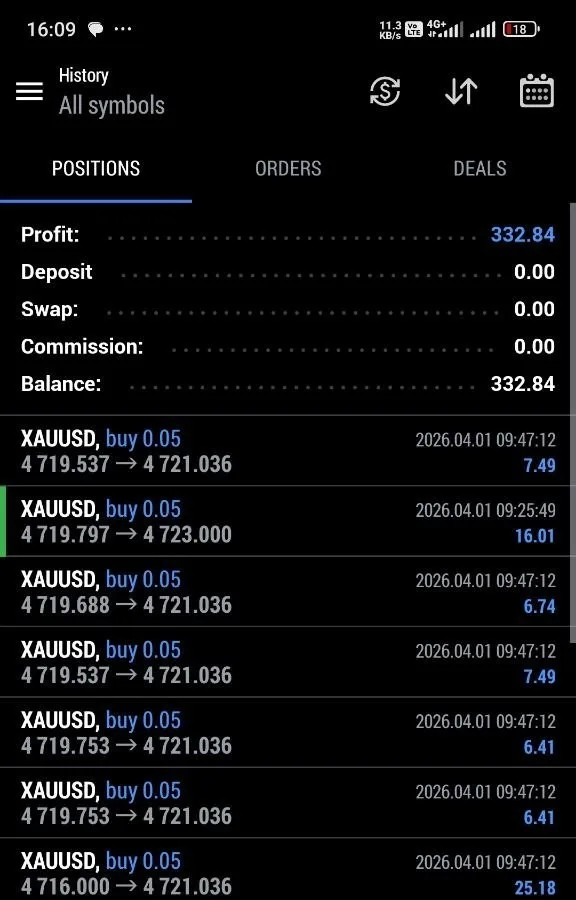
The community screenshots support that read without turning it into hype. One account showed $101.15 in trading profit, reaching a 401.15 total balance that included a platform credit. Another showed 2,073.96 in gross trading gains before commissions. A third moved from a 500.00 deposit to a 604.08 balance, and a later screenshot showed 332.84 in profit from a smaller account. Those numbers do not replace the official close, but they do confirm that the intraday opportunity was real across account sizes.
Going forward, the key question is simple: does gold keep acting like a momentum market, or does April 1 turn into a peak-chase day? The best reference reports remain the Daily Gold Trading Report March 31, 2026, the Daily Gold Trading Report March 30, 2026, and the Weekly Gold Trading Summary March 23-27, 2026. The March-to-April transition across these last three sessions has already changed the tone. Now the market has to defend it.
FAQ#
Was April 1 a clean win day?#
Yes. Two formal buy waves were posted, both finished as winners, and the later recap explicitly described two winning trades with roughly $25,000 posted for the day.
Why do the signal prices look much lower than the official close?#
Because the signal zone was live intraday execution around 4716-4725, while the official close of $4,784.26 captured later market extension after the active trade-management window.
What changed from March 31 to April 1?#
March 31 still looked like a rebound that needed confirmation. April 1 added another strong close, kept buyers in control, and changed the dashboard label to Bullish / High Momentum.
What should traders watch next?#
Watch whether price can keep holding above the April 1 launch zone. If buyers defend that area, momentum can stay healthy. If price slips back under it quickly, the regime flip becomes less convincing.
Connect with Gold Trader Mo#
Visit Gold Trader Mo for daily market reports, education, and platform updates. You can also follow the public channel at https://t.me/gtmo and message support at https://t.me/gtmobest.
Risk Disclaimer: Trading gold carries significant risk. Past results do not guarantee future returns. Only trade with money you can afford to lose. This material is educational and is not financial advice.