
Market Snapshot#
Gold opened April 9 in a tight consolidation zone near $4,720 that had been holding since the previous evening. A sideways range between $4,700 and $4,733 defined early Asian and London session price action, trapping traders on both sides of the market.
| Metric | Value |
|---|---|
| XAUUSD Close | ~$4,752 |
| Fed Funds Rate | 2.75–3.00% |
| DXY (Dollar Index) | ~98.80 |
| US 10-Year Yield | ~4.06% |
| WTI Crude Oil | ~$96.69 |
| VIX | ~30 (elevated) |
| Gold Regime | Bullish breakout from consolidation |
The dollar weakened on the day as high-impact economic data — including Core PCE and Final GDP — came in bearish for the greenback. Oil prices climbed on continued fears around the Strait of Hormuz closure, and gold found strong tailwinds from both safe-haven demand and dollar weakness. By mid-session, gold had broken decisively above the $4,733 pivot and rallied toward $4,758, marking a roughly $58 intraday swing.
Why The Tone Changed So Fast#
The session started with a well-defined sideways zone that had been respecting boundaries since April 8. Gold was compressing between $4,700 support and $4,733 resistance — a textbook range-bound setup that invited a sell at the top of the band.
When that sell signal triggered at $4,729–$4,733 and immediately hit its stop loss at $4,736, it was not a miscalculation. It was the market signaling that the consolidation phase was over. The breakout above $4,733 turned the structure bullish in minutes.
Three factors converged to accelerate the move. First, the Strait of Hormuz remained closed, pushing oil prices higher and fueling inflation anxiety. Second, high-impact US economic releases at 14:30 UTC — including Core PCE Price Index and Final GDP — came in bearish for the dollar. Third, the technical breakout above the multi-day range triggered a wave of buy-side momentum that carried gold more than $20 above the breakout zone within hours.
The tone did not change because the initial analysis was wrong. It changed because the market resolved its indecision in the direction opposite to the first trade — and the response to that shift was immediate.
Technical Outlook#
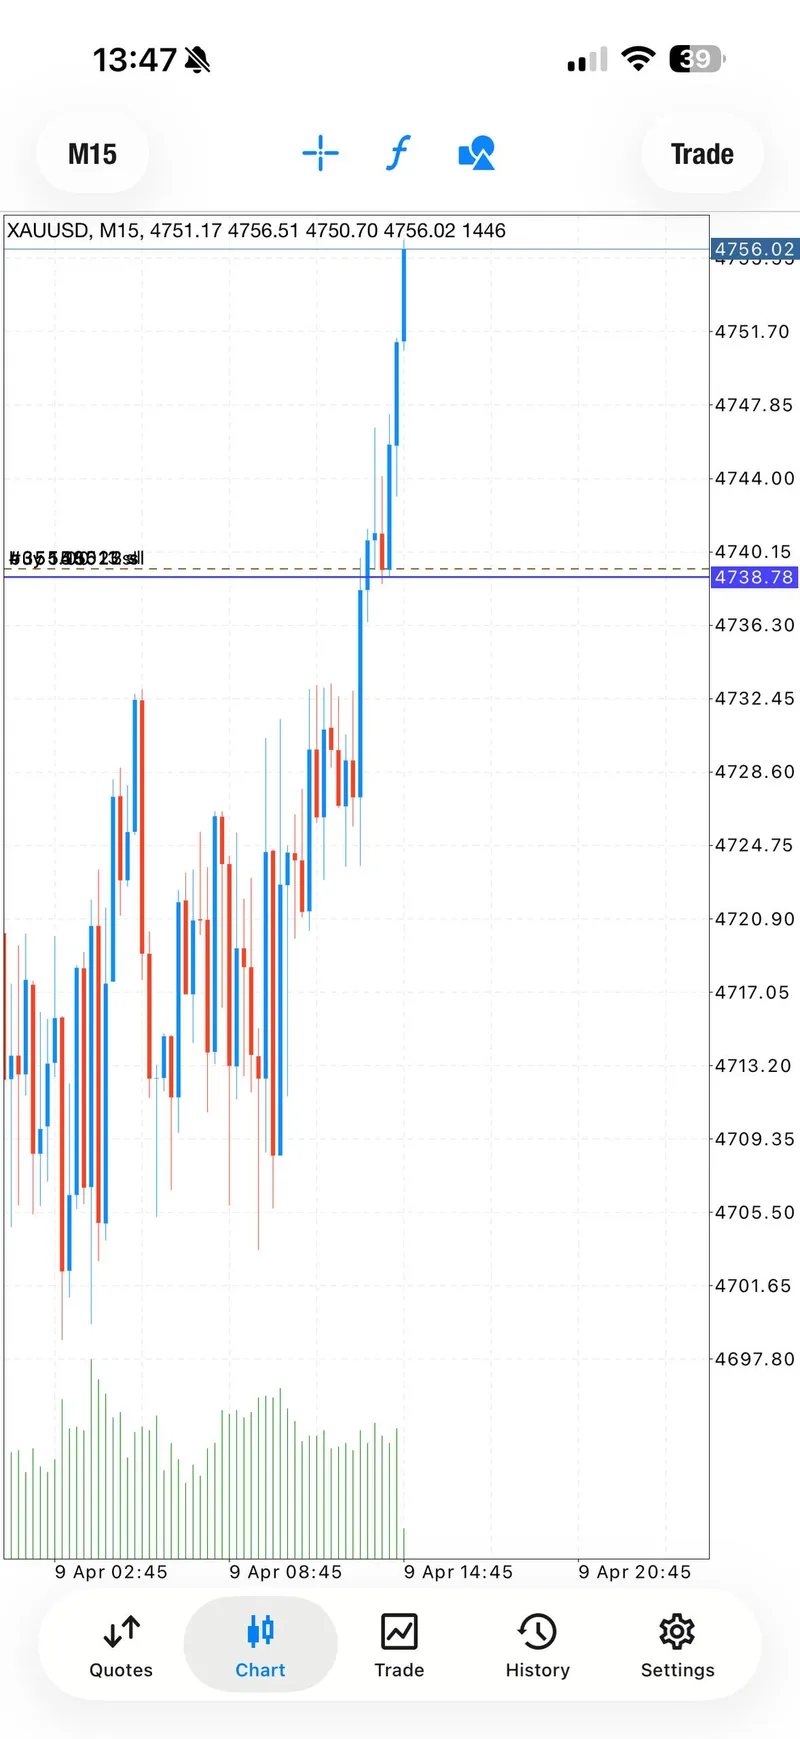
Gold broke out of a 12-hour consolidation range on April 9, pivoting from a $4,700–$4,733 band to a high near $4,758. The breakout pivot at $4,733.09 now acts as near-term support.
Key levels to watch:
- Support: $4,733 (breakout pivot), $4,686 (swing low), $4,646 (deeper support)
- Resistance: $4,766 (first target), $4,807 (prior session high from April 8), $4,844 (extended target)
The M15 chart showed gold trading above the entry zone at $4,738 with momentum indicators flipping bullish after the failed sell. Volume picked up sharply at the breakout point, and the rally extended through all four profit targets without a meaningful pullback.
If gold holds above $4,733, the next test is the $4,807 resistance from the April 8 session. A failure to hold $4,733 could mean a retest of the $4,686–$4,700 zone. The upcoming FOMC cycle and continued Strait of Hormuz tensions will likely keep gold directionally sensitive to headline risk.
Trading Signals#
Three signals were issued on April 9, 2026.
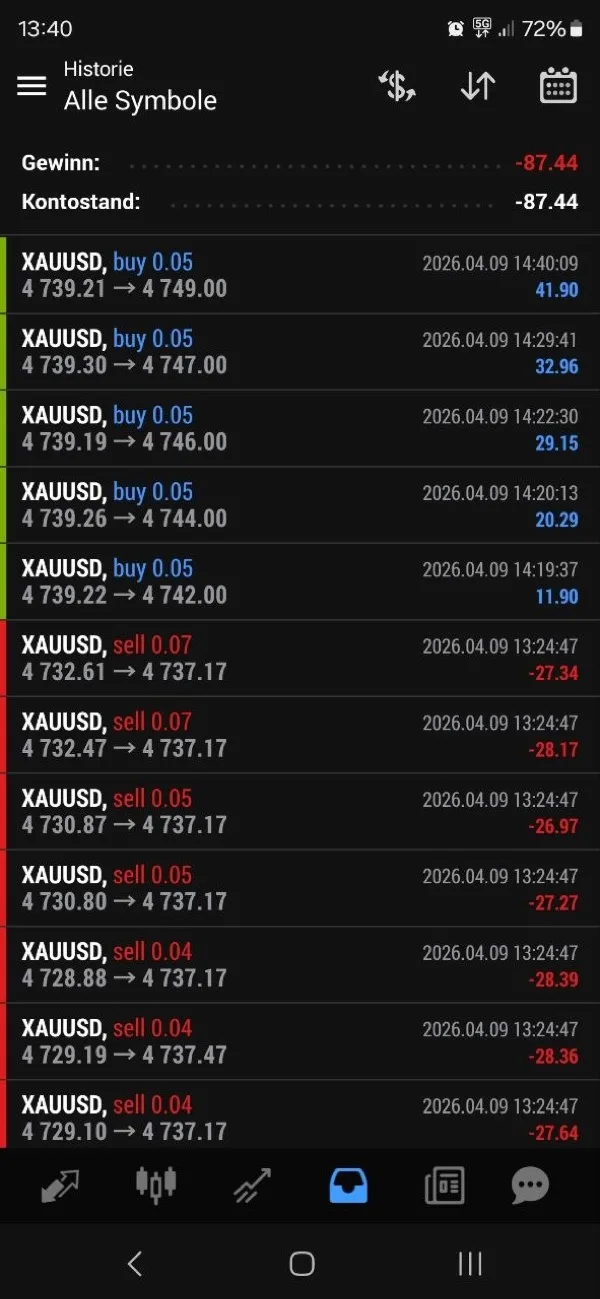
Signal 1 — Sell (Failed)#
Gold Trader Mo identified a sell opportunity at the top of the sideways zone.
- Direction: Sell
- Entry: $4,729.60 – $4,733.00
- Stop Loss: $4,736.00
- Take Profits: $4,727 / $4,725 / $4,723 / Open
- Result: Stop loss hit. Setup failed as gold broke above the zone.
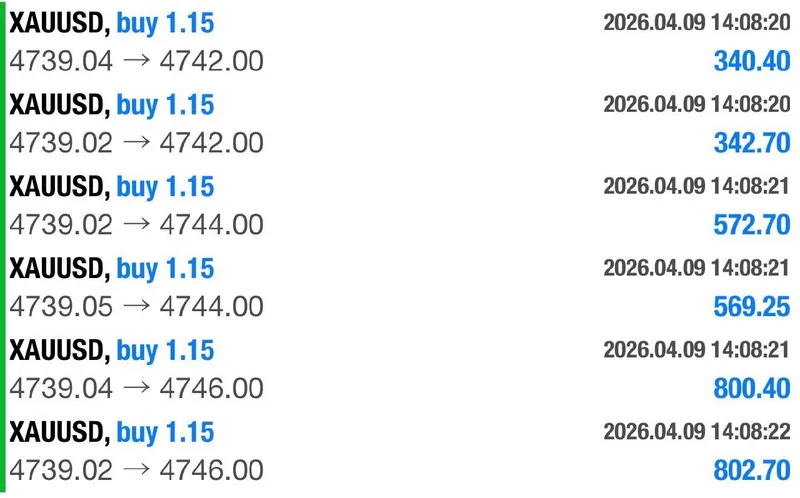
Signal 2 — Buy (All Targets Hit)#
After the failed sell, Mo flipped direction and entered a buy position.
- Direction: Buy
- Entry: $4,739.00 – $4,735.00
- Stop Loss: $4,729.00
- Take Profits: $4,742 ✓ / $4,744 ✓ / $4,746 ✓ / Open (100+ pips) ✓
- Result: All four targets hit. Trade ran 200+ pips from entry.
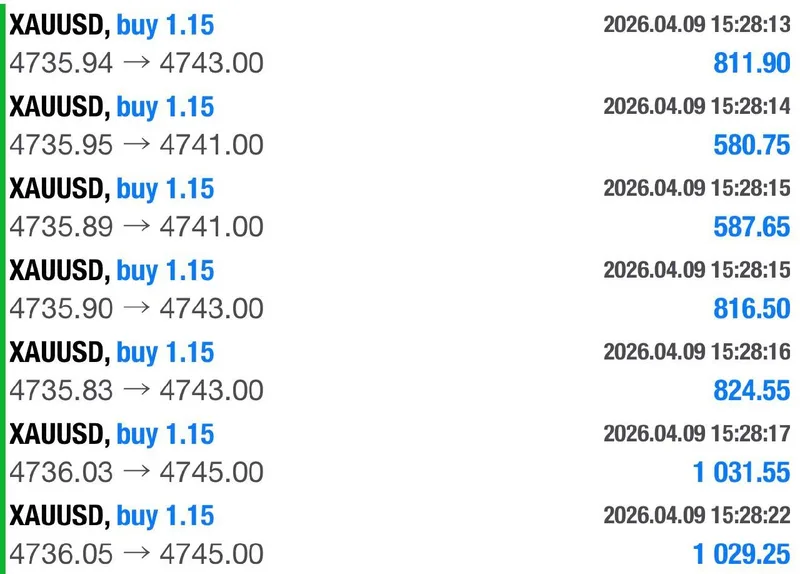
Signal 3 — Buy (Pre-News, All Targets Hit)#
A second buy was issued 16 minutes before high-impact economic data, with a warning to use lower position sizes.
- Direction: Buy
- Entry: $4,738.80 – $4,735.00
- Stop Loss: $4,729.00
- Take Profits: $4,741 ✓ / $4,743 ✓ / $4,745 ✓ / Open
- Result: All three targets hit plus a trailing move to 100+ pips.
Signal Performance Breakdown#
| Signal | Direction | Entry | Result | Pips |
|---|---|---|---|---|
| Signal 1 | Sell | $4,729–$4,733 | Stop Loss Hit | -6 |
| Signal 2 | Buy | $4,739–$4,735 | All 4 TPs Hit | +200 |
| Signal 3 | Buy | $4,738–$4,735 | All 3 TPs Hit | +100 |
Day totals:
- Win rate: 2 out of 3 signals (67%)
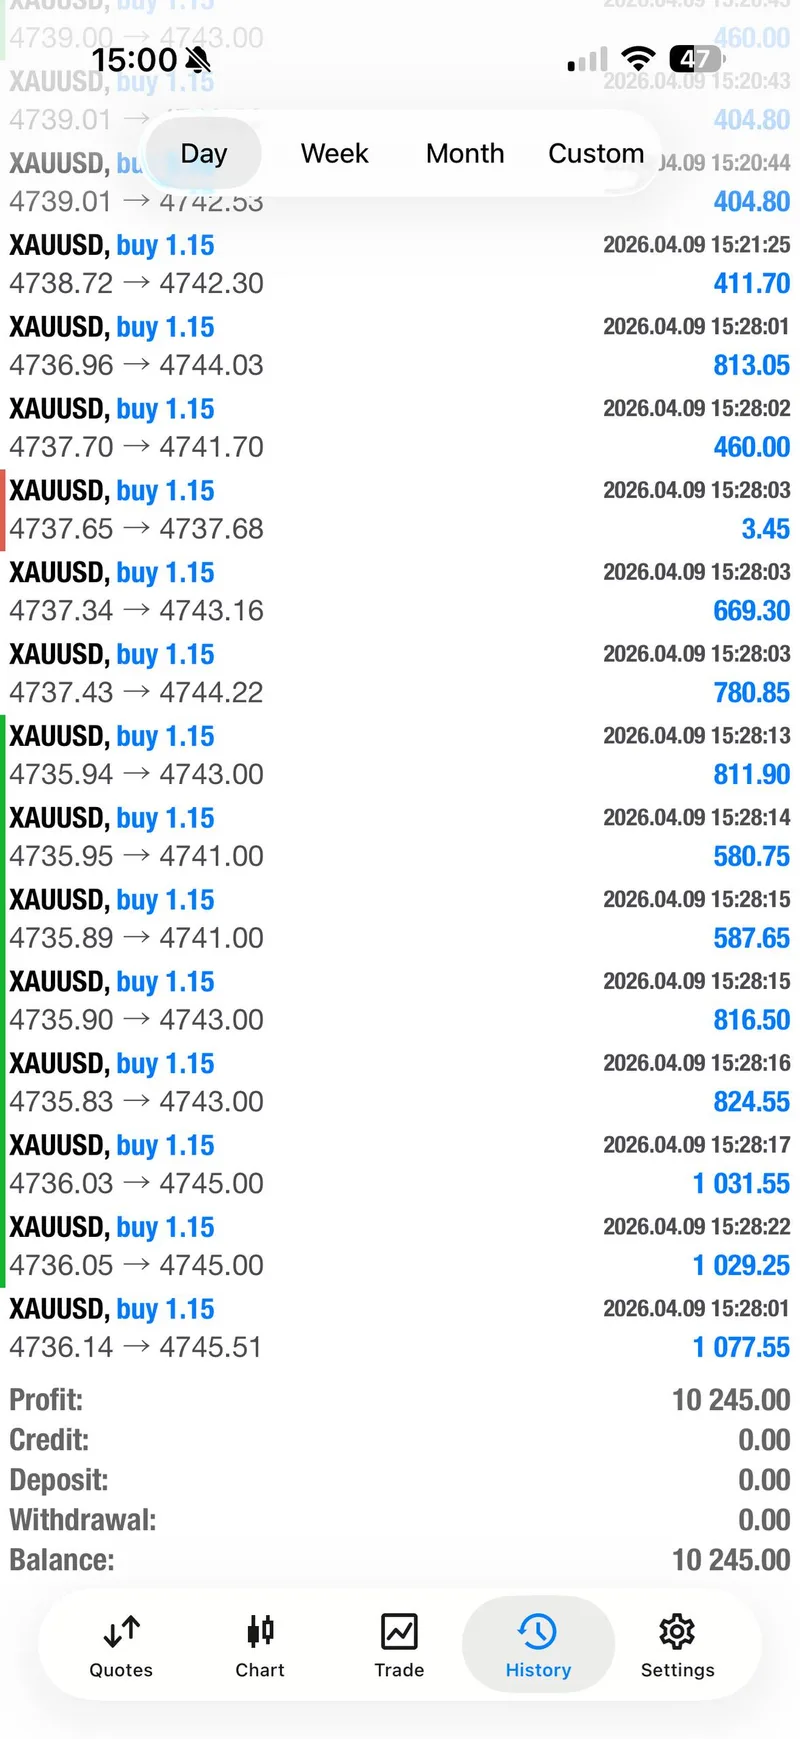
- Gross pips gained: ~294 net pips
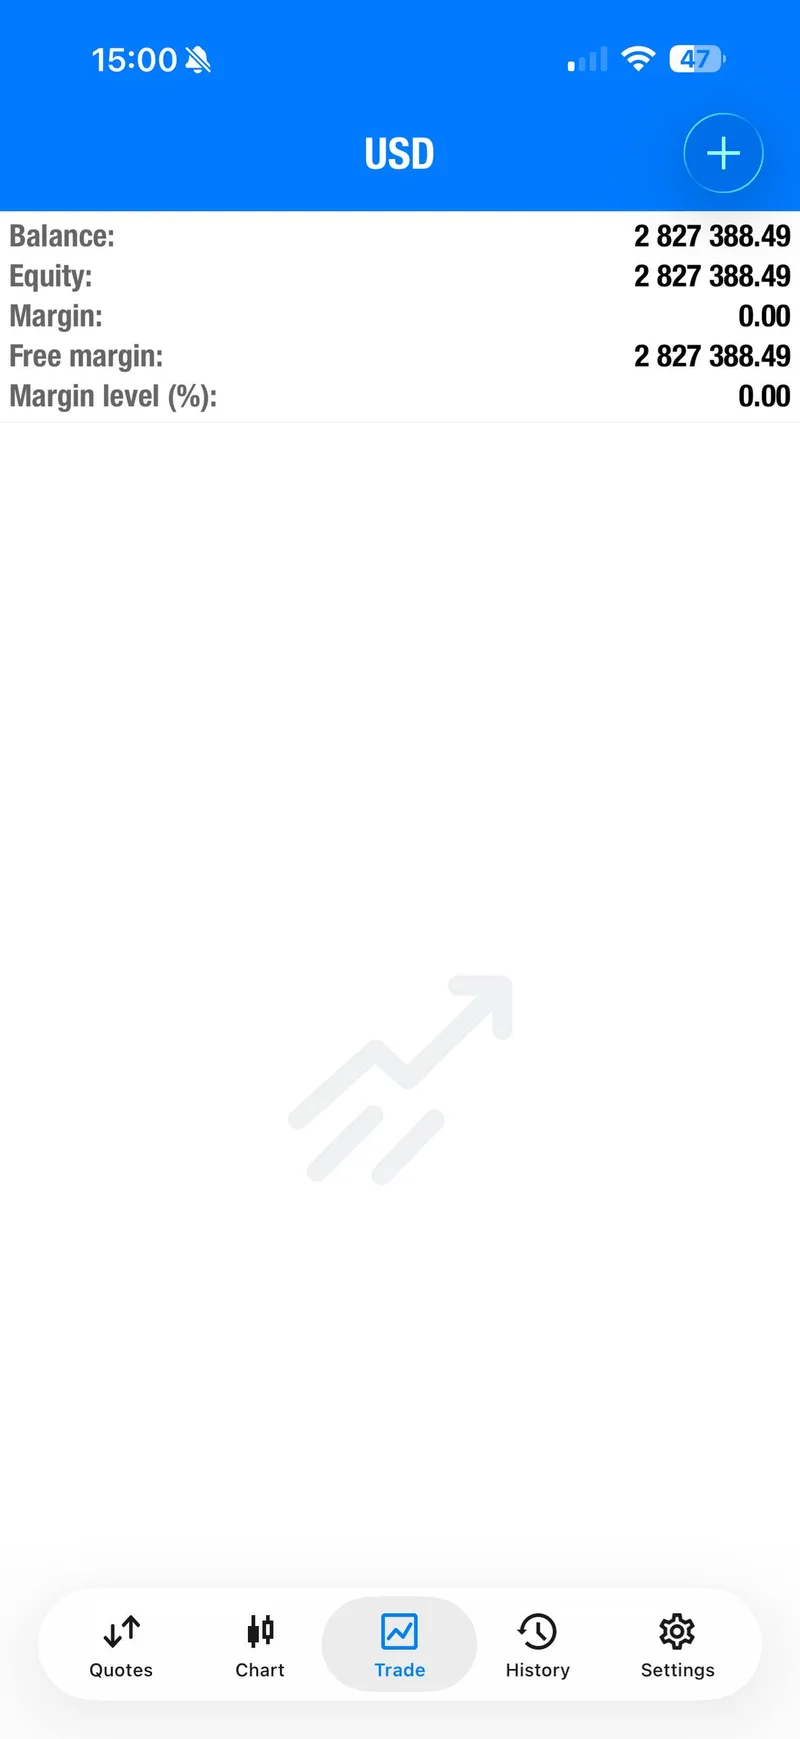
- Closed profit: $10,245 (verified from trading history)
- Account balance at close: $2,827,388
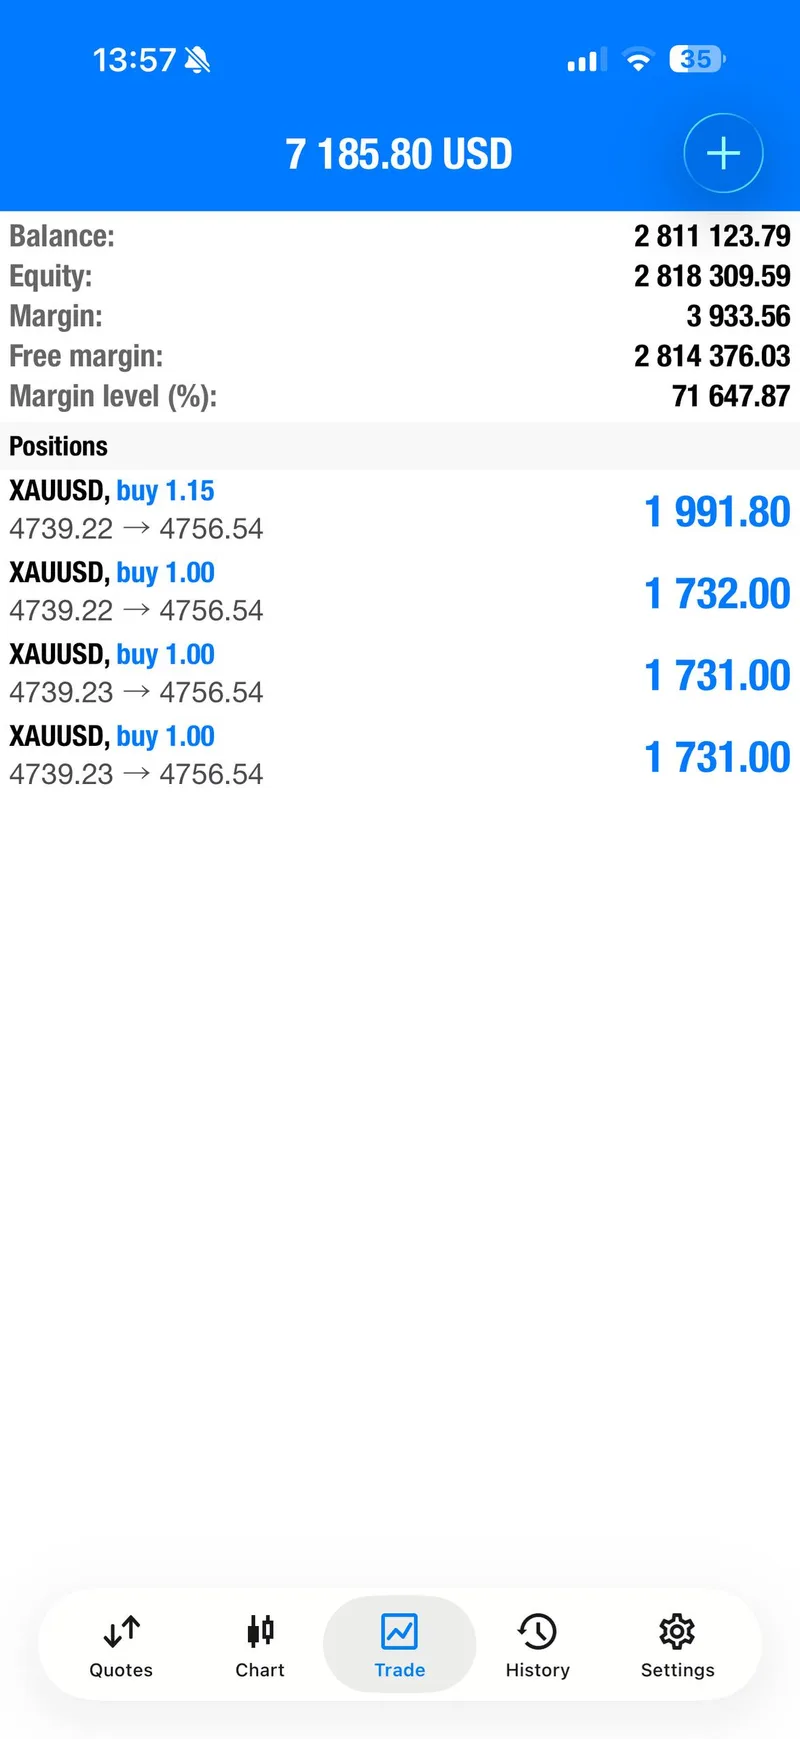
- Largest single winning trade: $1,991 (1.15 lots, $4,739 to $4,756)
The first sell lost roughly $300 on a 6-pip stop. The two buy trades more than recovered that loss, producing a net profit exceeding $10,000. The key difference was position management — breakeven stops were set on the winning trades immediately after the first profit targets hit, eliminating downside risk on the runners.
This pattern of accepting a small defined loss and then capitalizing on a directional shift with larger position exposure is consistent with how Gold Trader Mo has approached recovery days throughout 2026, including the April 7 session where a $24,000 loss became a $19,000 profit day.
Execution Lessons#
1. A failed setup is information, not failure. The first sell hitting its stop loss was the clearest signal that the consolidation was over. Rather than doubling down on the sell thesis, Mo used the stop loss event as a directional indicator and flipped to buying within 30 minutes.
2. Breakeven stops protect the recovery. After the first buy trade hit its second profit target, breakeven was set immediately. This meant zero risk on the remaining position — the worst-case outcome was a small gain, not a second loss.
3. Pre-news trading requires smaller position sizing. Signal 3 came 16 minutes before high-impact data. Mo explicitly warned the community to use lower lot sizes, acknowledging the elevated risk while still positioning for the expected move. The discipline was in the sizing, not in avoiding the opportunity.
4. Recovery is a mindset. Mo stated publicly after the failed sell: "Stay active world, I'll get us back up, and try to find some nice recovery entries for us." That transparency — admitting the loss and committing to recovery in front of 20,000+ subscribers — is what separates professional execution from ego-driven trading.
What The Day Means Going Forward#
April 9 reinforced a pattern that has defined gold trading in early Q2 2026: consolidation zones are resolving with sharp directional breakouts rather than gradual moves. The $4,700–$4,733 range held for nearly 12 hours before breaking in a single session, and the breakout carried more than $20 beyond the range boundary.
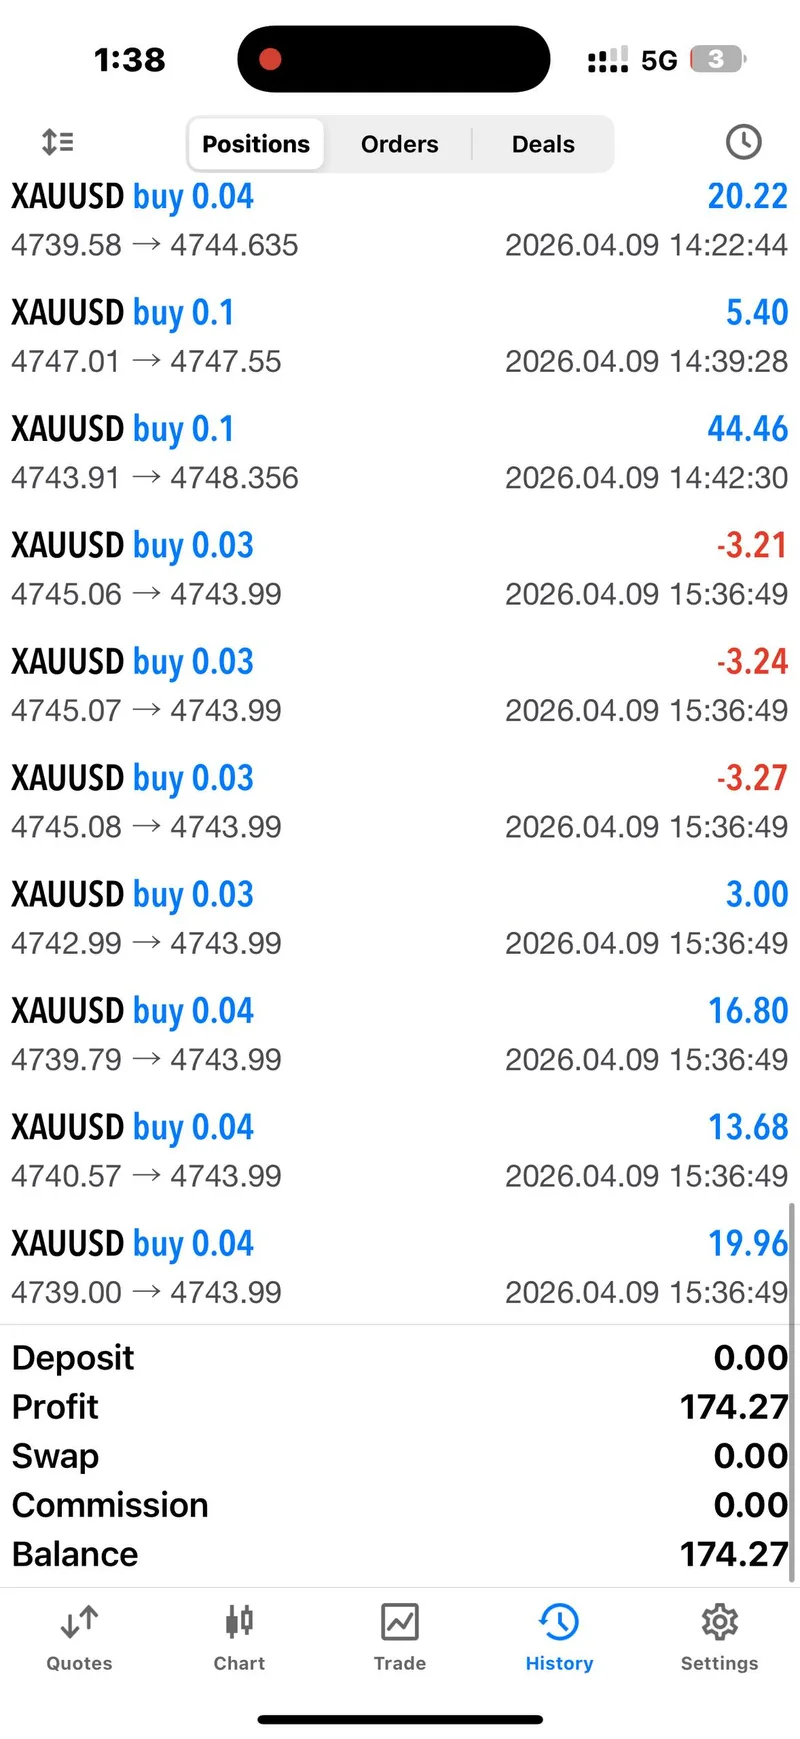
For the community, this session demonstrated that a failed trade at the start of a session does not define the day. Several members shared their own recovery stories — from partial recoveries to full turnarounds. One community member who matched the signals posted a verified $174 profit after initially being in the red from the failed sell.
The broader market context supports continued volatility. The Strait of Hormuz closure remains unresolved, tariff uncertainty persists, and the upcoming FOMC meeting cycle will add another layer of directional risk. Gold sitting above $4,750 after the April 9 breakout suggests the market is favoring the upside for now.
Looking at the week so far: the April 7 recovery day posted $19,147 in profit, the April 8 clean sweep delivered $23,430, and April 9 added $10,245. That is more than $52,000 in verified profits across three consecutive sessions.
FAQ#
Did Gold Trader Mo lose money on April 9?
The first trade of the day was a sell that hit its stop loss, resulting in a small loss of approximately $300. However, the two subsequent buy trades produced over $10,000 in profit, making it a strong net positive day.
What was the total profit on April 9?
The verified closed profit from trading history was $10,245, bringing the account balance to $2,827,388.
Why did the first sell signal fail?
Gold had been consolidating in a sideways zone since April 8. The sell was placed at the top of that zone, which is a standard range-trading approach. However, the zone broke to the upside instead of holding, triggering the stop loss.
What economic news affected gold on April 9?
High-impact data released at 14:30 UTC included Core PCE Price Index and Final GDP figures. The results were bearish for the US dollar, which supported gold's upside move. Combined with ongoing Strait of Hormuz closure concerns and rising oil prices, gold had multiple tailwinds.
Is it normal to have a losing trade then recover?
Recovery days are a documented pattern in professional trading. Gold Trader Mo has consistently shown the ability to accept small defined losses and then capitalize on subsequent opportunities with larger gains.
Connect with Gold Trader Mo#
Follow live gold trading signals and join a community of traders from more than 50 countries. Access the free signal channel on Telegram at @GTMOBest for daily analysis, real-time entries, and community support.
Visit Gold Trader Mo for the full daily report archive and to explore the GTMO School program, where over 1,700 students learn gold trading with daily live analysis.
This is not financial advice. Gold trading carries significant risk, and past performance does not guarantee future results. Always use proper risk management and never trade with money you cannot afford to lose.