
Weekly Gold Forecast Snapshot#
Gold enters the August 31-September 4, 2026 trading week at a decision point, not a comfortable trend continuation. Friday's rates-led selloff left the metal in a lower, more fragile part of its recent range while the dollar and Treasury yields firmed. The coming week then brings a concentrated test: labor data on Tuesday, a Federal Reserve Beige Book on Wednesday, services and other growth releases on Thursday, and the August Employment Situation on Friday.
If you want the short version, MO's base case is conditional rotation. Gold can rebuild its bid if softer labor or activity data pulls yields lower and the dollar loses traction. But if the market accepts prices below the 4,556.70-4,567 defense band, the recovery thesis is no longer the right starting point. The first upside decision band is 4,640.86-4,658, with 4,661-4,665 as the next reaction zone if buyers can prove acceptance.
Want the live read as those levels are tested? Message @GTMOBest to join MO's free VIP channel. The value this week is not a promise of profit; it is having a clear map before the calendar starts moving the tape.
This is a forecast, not a recap. It gives readers the thesis, the evidence that could change it, and the invalidation points to watch in real time. For broader context, see Gold Trader Mo, the daily reports, and the market-analysis archive.
Where Gold Stands As The Trading Week Gets Underway#
Public Friday market snapshots placed XAUUSD in the low-to-mid $4,500s after a sharp late-week move. The exact reference varied because spot, futures, CFD, and delayed feeds were captured at different times. That distinction matters: this forecast does not pretend that one asynchronous quote is a provider-neutral settlement. The usable takeaway is the structure. Gold is entering the week under pressure, with the market asking whether the decline is a reset inside a wider range or the beginning of a deeper repricing.
DXY snapshots were around 99.7 and the U.S. 10-year Treasury yield was around 4.73% in the same Friday market backdrop. Those are approximate context readings, not live instructions. They explain why the tape feels heavier: when the dollar and real-yield pressure rise together, gold needs either a clear macro disappointment or stronger defensive demand to regain momentum. The relevant cross-asset signal is therefore not one number; it is whether yields and the dollar continue to climb together after the next release.
The policy backdrop also became firmer. In his August 28 Jackson Hole keynote, Federal Reserve Chairman Kevin Warsh said inflation remained above the Fed's 2% objective, described price stability as the predominant focus, and said policymakers need confidence that underlying inflation is moving toward target at a sufficient speed. Read the official Federal Reserve remarks. That does not dictate a rate decision, but it raises the hurdle that gold must clear if it wants a clean upside extension.
The right starting description is fragile consolidation after a rates-led selloff. It is not automatically bearish, because a weak labor signal can reverse the yield impulse quickly. It is not cleanly bullish, because buyers have to reclaim overhead supply while the Fed's inflation language remains fresh. That tension is exactly why the levels and the event sequence matter more than a confident one-line prediction.
The Main Drivers That Could Move Gold This Week#
The first driver is the rates channel. Gold is sensitive to the opportunity cost of holding a non-yielding asset, so the market's response in Treasury yields can matter more than whether an economic release looks superficially good or bad. A soft number that fails to pull yields lower may not help gold much. Conversely, a mixed number that produces a clear drop in real-rate pressure can create a stronger bid than the headline alone would suggest.
The second driver is the labor sequence. JOLTS arrives Tuesday, September 1, before Friday's payroll report. It is not a substitute for payrolls, but it can change how traders frame the labor market before the week reaches its main volatility event. The question is whether demand for workers looks resilient enough to keep policy expectations firm, or soft enough to reopen room for lower yields. Gold's reaction should be judged against that market response, not against a pre-written directional script.
The third driver is the growth pulse. ISM Manufacturing and Construction Spending are scheduled Tuesday, while the revised Productivity and Costs, Trade, and ISM Services releases arrive Thursday. Services is especially important because it is a direct bridge into Friday's labor focus. A resilient services signal can keep the policy hurdle high; a softer one can help gold only if the dollar and yields confirm the same interpretation.
The fourth driver is Fed communication. The Beige Book is a qualitative release, but it can sharpen the market's reading of prices, demand, and hiring across regional districts. Sticky price language would reinforce the current rates pressure. Softer activity or labor language would give the market a reason to question whether the post-Jackson-Hole repricing can persist. The exact wording matters more than the label attached to the release.
Finally, safe-haven demand can interrupt the clean macro relationship. A risk shock can lift gold even while yields are high, but that is not a free pass for buyers. If the dollar remains dominant, safe-haven demand may produce only a temporary spike. The discipline is to watch follow-through: does price hold the move after the first headline reaction, or does it return to the same decision band?
Key Technical Levels and Decision Zones#
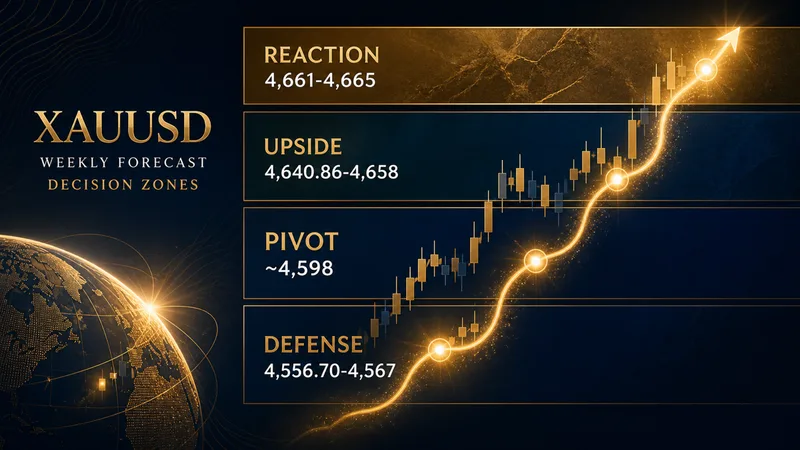
The technical map is built from the prior week's observed support and resistance fields. Because the underlying daily packets contain asynchronous market snapshots, these are approximate reaction bands, not guaranteed fills or a claim about one broker's exact close.
- Defense band: 4,556.70-4,567. This is the main downside invalidation area for the balanced recovery thesis. A brief wick below it is information; sustained acceptance below it is a regime change.
- Reclaim/pivot: around 4,598. Gold reclaiming this area and holding it on a retest would be the first sign that selling pressure is easing. Failure here keeps the tape vulnerable to another test of the defense band.
- Upside decision band: 4,640.86-4,658. Buyers need clean acceptance above this band, not just a fast headline spike, to promote the bullish scenario.
- Higher reaction zone: 4,661-4,665. If the upside band is reclaimed, this is the next area where profit-taking or fresh supply can appear. It is a reaction zone, not a guaranteed destination.
The practical sequence is simple. Below the defense band, the market is asking for downside confirmation. Between the defense band and the reclaim pivot, the market is still repairing damage. Above the reclaim pivot, buyers have a better platform, but the real bullish decision is still the 4,640.86-4,658 band. This prevents a common mistake: treating every bounce as a trend reversal before the market has demonstrated acceptance.
Bullish, Base, and Bearish Scenarios#
The current MO scenario weighting is 30% bullish, 45% base, and 25% bearish. These are working probabilities, not promises and not a substitute for live risk control. They describe what evidence would make each path more credible.
Bullish scenario#
The bullish path begins with softer labor or activity evidence that pulls yields lower and cools the dollar. Gold first needs to reclaim around 4,598, then hold that pivot through a retest. The real confirmation is sustained acceptance above 4,640.86-4,658, with 4,661-4,665 becoming the next reaction zone rather than an automatic target.
The trigger is not a single green candle. It is a sequence: the macro release produces a lower-yield response, price reclaims the pivot, pullbacks remain orderly, and the upside band holds after the first test. Invalidation is a fast rejection back below the pivot followed by renewed acceptance under 4,556.70-4,567. If the market cannot hold the reclaim, the bullish story is only a squeeze, not a confirmed weekly expansion.
Base scenario#
The base case is a two-way rotation between the 4,556.70-4,567 defense band and the 4,640.86-4,658 upside band while traders wait for labor and policy evidence to align. A mixed data sequence, firm but stable yields, and a dollar that does not accelerate sharply would keep this range-first path in control.
This is not a forecast that nothing happens. It is a forecast that the first move may not be the durable move. The market can overshoot a level after a release, reverse, and still finish the session inside the same structure. Base-case invalidation comes from clean acceptance above the upside band or sustained acceptance below the defense band. Until one of those conditions appears, forcing a directional call adds risk without adding information.
Bearish scenario#
The bearish path strengthens if labor or services data keeps the Fed's policy hurdle high, yields and the dollar rise together, and gold cannot reclaim around 4,598. The decisive technical evidence is acceptance below 4,556.70-4,567, especially if a retest fails from underneath. That would say the market is no longer treating lower prices as a simple buying opportunity.
The bearish scenario has a clear boundary as well. A rapid reclaim of around 4,598 followed by acceptance above 4,640.86-4,658 would take control away from sellers and invalidate the downside path. Until that happens, readers should not confuse a short-lived safe-haven bounce with a completed recovery.
Economic Calendar and Market Risks#

The week is unusually concentrated for gold because the calendar can move the same three levers—yields, the dollar, and policy expectations—several times before Friday. The release times below are Eastern Time with the GMT+7 conversion in parentheses.
- Monday, August 31: The week opens with positioning after Friday's selloff. There is no need to manufacture a catalyst; the opening task is to see whether price can stabilize above the defense band.
- Tuesday, September 1: JOLTS for July at 10:00 ET (21:00 GMT+7), ISM Manufacturing at 10:00 ET, and Construction Spending at 10:00 ET. This is the first serious test of whether the rates pressure is extending or fading. See the BLS September schedule, ISM release calendar, and Census calendar.
- Wednesday, September 2: The Census full report on Manufacturers' Shipments, Inventories and Orders is scheduled for 10:00 ET, while the Federal Reserve September calendar lists the Beige Book for 14:00 ET (01:00 GMT+7 on Thursday). The local timestamp matters: this is a Thursday-morning Vietnam event, not a Wednesday-night U.S. session.
- Thursday, September 3: Revised Productivity and Costs and the U.S. Trade release are scheduled for 08:30 ET (19:30 GMT+7), followed by ISM Services at 10:00 ET (21:00 GMT+7). The BEA upcoming-release list confirms the July trade release at 08:30 ET. Thursday is the cleanest pre-payroll test of whether the market still believes the firm-rate narrative.
- Friday, September 4: The August Employment Situation arrives at 08:30 ET (19:30 GMT+7). The BLS July release reported July payroll employment down 23,000 and unemployment at 4.1%, and scheduled the August report for September 4. Read payrolls, unemployment, revisions, and earnings together; one number should not be allowed to define the whole report.
Event risk is not a reason to predict more aggressively. It is a reason to reduce the distance between evidence and action. A first spike can be liquidity, positioning, or a headline overshoot. The move becomes more credible when price holds the zone, yields confirm the direction, and the dollar does not contradict the narrative.
What Traders Should Watch Day by Day#
On Monday, watch the opening response to the Friday flush. If gold stabilizes above the defense band and begins to reclaim around 4,598, the base case remains intact. If the market opens heavy and cannot attract demand near the lower band, the bearish path deserves more weight before Tuesday data arrives. The best decision may be to wait for structure rather than chase the first gap or early-session wick.
Tuesday is the first information cluster. JOLTS, Manufacturing PMI, and Construction Spending arrive in the same U.S. morning window. Treat the combined yield response as the scoreboard. A soft labor signal with higher yields is not automatically bullish gold; a firm PMI with falling yields is not automatically bearish. The cross-asset reaction decides which interpretation is winning.
Wednesday shifts the focus from hard data to the Fed's regional read. The Beige Book can either validate the inflation concern in the Jackson Hole speech or introduce enough softness to make the market question the current rate premium. In Vietnam, the release lands after midnight. That timing makes patience especially valuable: an overnight move still needs to be checked against the next liquid session.
Thursday is the bridge into payrolls. Productivity, Trade, and ISM Services can create several short-lived moves, but the key question is whether gold can hold a reclaimed pivot or whether rallies continue to fail below the upside decision band. Thursday closes with the market positioned for Friday, so false confidence is expensive.
Friday is the high-volatility checkpoint. Read the headline payroll number with unemployment, earnings, revisions, and the yield reaction. If a soft report pushes gold above the upside band and price holds there, the bullish scenario becomes credible. If a strong report drives acceptance below the defense band, the bearish scenario takes control. If the data and market reaction conflict, default to the base-case discipline until the conflict resolves.
How To Think About Positioning This Week#
The cleanest way to approach this forecast is to trade the reaction, not the prediction. Define the zone that proves your idea, the zone that invalidates it, and the amount of risk you can accept before the release. A weekly forecast is useful only when it changes behavior: less chasing, clearer stops, smaller assumptions, and faster recognition when the thesis is wrong.
In the current fragile regime, confirmation matters more than excitement. A move into 4,640.86-4,658 is not bullish simply because it is higher. It becomes bullish when price can accept there after a catalyst, the dollar stops strengthening, and yields are no longer adding pressure. A move below 4,556.70-4,567 is not automatically a collapse. It becomes bearish when sellers hold the break and failed retests show that the market has changed its valuation of the metal.
Readers can pair this map with the gold scalping strategy guide for execution principles and revisit the weekly forecast archive for continuity. The live week will supply new evidence; the job of this forecast is to make that evidence easier to interpret.
FAQ#
What is the main catalyst for gold this week?#
Friday's August Employment Situation is the highest-consequence release, but the market will build its expectations through Tuesday's JOLTS and ISM data, Wednesday's Beige Book, and Thursday's ISM Services report. The key question is whether those releases move yields and the dollar in a direction that confirms or contradicts the gold move.
What are the key XAUUSD levels for the week?#
The main defense band is 4,556.70-4,567. Around 4,598 is the reclaim/pivot area. The first upside decision band is 4,640.86-4,658, followed by a higher reaction zone at 4,661-4,665. These are approximate reaction bands drawn from prior-week market context, not guaranteed fills or profit targets.
What invalidates the weekly gold forecast?#
The balanced base case is weakened by sustained acceptance below 4,556.70-4,567 or by a clean acceptance above 4,640.86-4,658 that confirms a new upside regime. The forecast should be updated if the market shows a different structure; no scenario is permanent.
Connect with Gold Trader Mo#
For the live reaction as the calendar lands, message @GTMOBest and ask to join MO's free VIP channel. Follow the Gold Trader Mo archive and daily reports for the session-by-session context that sits underneath this weekly map.
Disclaimer#
This weekly gold forecast is for education and market commentary only. It is not financial advice, no outcome is guaranteed, and trading involves risk of capital loss. Use position sizing and risk limits appropriate to your circumstances.