Daily Gold Trading Report — March 23, 2026 | Post #44#
This daily gold trading report for March 23, 2026 covers one of the most volatile XAUUSD sessions of the year. Gold Trader Mo's Monday session delivered a decisive win as gold crashed 3% and swung $215 in a single day. With the gold price already down 10.5% from the prior week's highs and sentiment deeply bearish, a single Trump-Iran headline turned the market on its head. One gold trading signal, issued at exactly the right moment, captured over 300 pips — locking in more than $40,000 in closed profit while the $2.57M account stayed fully protected throughout. Here's the full gold market analysis and signal results breakdown.
Market Snapshot#
| Metric | Value | Change |
|---|---|---|
| XAUUSD Close | $4,358.97 | -3.00% |
| Session High / Low | $4,510.45 / $4,295.12 | Range: $215.33 |
| DXY (US Dollar Index) | 99.14 | -0.60% |
| US 10-Year Yield | 4.334% | -5.6 bps |
| WTI Crude Oil | $88.13 | -10.30% |
| VIX | 24.55 | -8.33% |
| Fed Funds Rate | 3.50%–3.75% | Unchanged |
| S&P 500 | 5,432.12 | +1.85% |
| Gold Regime | Correction / High Volatility | — |
The gold price today closed at $4,358.97 on March 23, 2026, extending Monday's sell-off with a $215 intraday range — one of the widest single-session swings in recent memory. The prior Friday close of $4,494.44 gave way to a -$135.47 gap-down open as weekend headlines sank in. The VIX pulled back 8.33% despite the gold volatility, signaling equity markets were shrugging off commodities stress while bond yields dipped further. This gold market correction marked the deepest intraday sell-off since the March 2026 correction began two weeks ago.
Why The Tone Changed So Fast#
Monday's tone shifted three times in under two hours, driven entirely by the Iran-US situation.
The Weekend Setup#
After closing last week down 10.5% from the $5,022 peak, gold opened Monday deep in correction territory. The prevailing narrative was clear: Trump had postponed military strikes on Iranian power plants and energy infrastructure for five days as negotiations proceeded, and traders rapidly priced out the war premium that had supported gold above $4,500.
The Intraday Reversal Sequence#
At approximately 11:25 UTC, the headline hit: Trump delays Iranian strikes as negotiations proceed. Gold exploded upward — gaining 1,600+ pips in just 5-7 minutes as algorithmic buyers flooded the order books. Momentum was explosive and nearly untradeable at speed.
Then came the second reversal. Within minutes, multiple Iranian sources denied that any talks with the U.S. were taking place, contradicting Trump's claims. Gold reversed 1,100 pips in the opposite direction, triggering a cascade of stop-losses and long squeezes.
The Macro Backdrop#
Gold ETF outflows hit their largest single-day redemption in two years, compounding the technical selling pressure. With gold already below the critical $4,500 support level, algorithmic selling and long-squeeze dynamics accelerated the decline. Oil collapsed 10.3% in sympathy as safe-haven liquidation spread across commodities, while the dollar index softened slightly as traders rotated into equities for perceived safety.
FOMC and Economic Calendar#
The Fed holds rates at 3.50-3.75% with the next Fed rate decision window approaching. This week's economic calendar includes key inflation indicators and labor data releases that could further shape the rate path. Support for gold from lower real yields remains a medium-term tailwind, but near-term positioning is dominated by geopolitics and technical flows. If the gold correction deepens, safe-haven demand could re-emerge rapidly.
Technical Outlook#
This XAUUSD analysis covers the key technical levels, resistance zones, and momentum indicators that define the gold forecast for the sessions ahead.
Key Levels After the Drop#
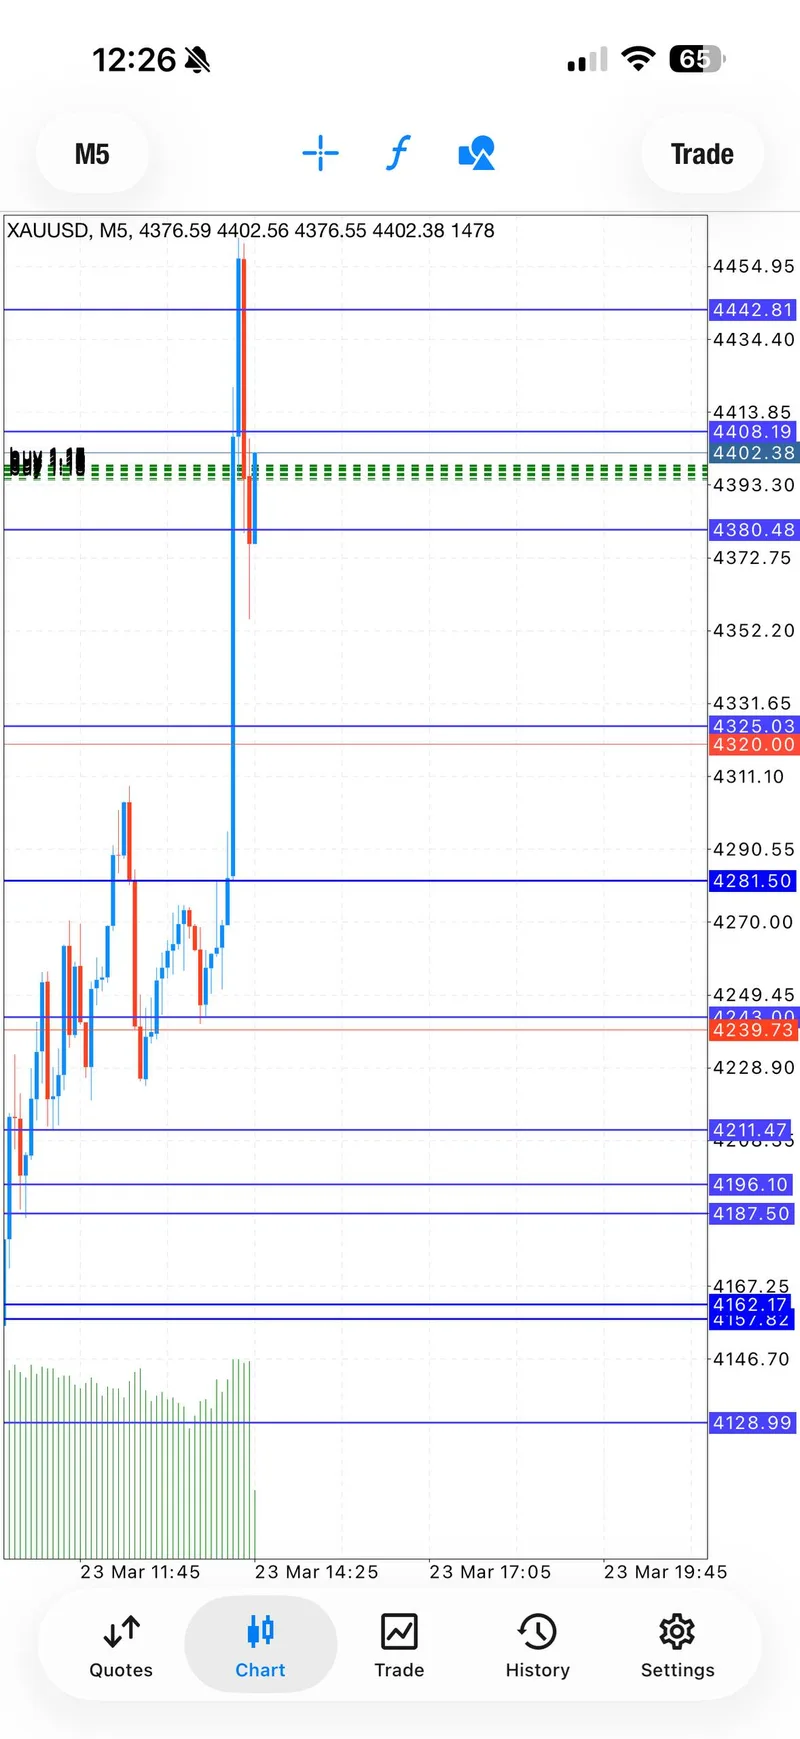
Gold's technical analysis picture has shifted decisively. The immediate support zone sits at $4,350-4,360, which held as the session's closing area. Below that, $4,295 (the session low) and $4,240 represent the next downside targets if selling resumes.
Resistance and Recovery Zones#
On the upside, the first meaningful resistance lies at $4,410-4,430, roughly where the intraday bounce peaked before reversing. A daily close above $4,450 would be needed to stabilize the correction narrative, while $4,500 remains the psychological line in the sand — reclaiming it would shift the regime from correction back to consolidation.
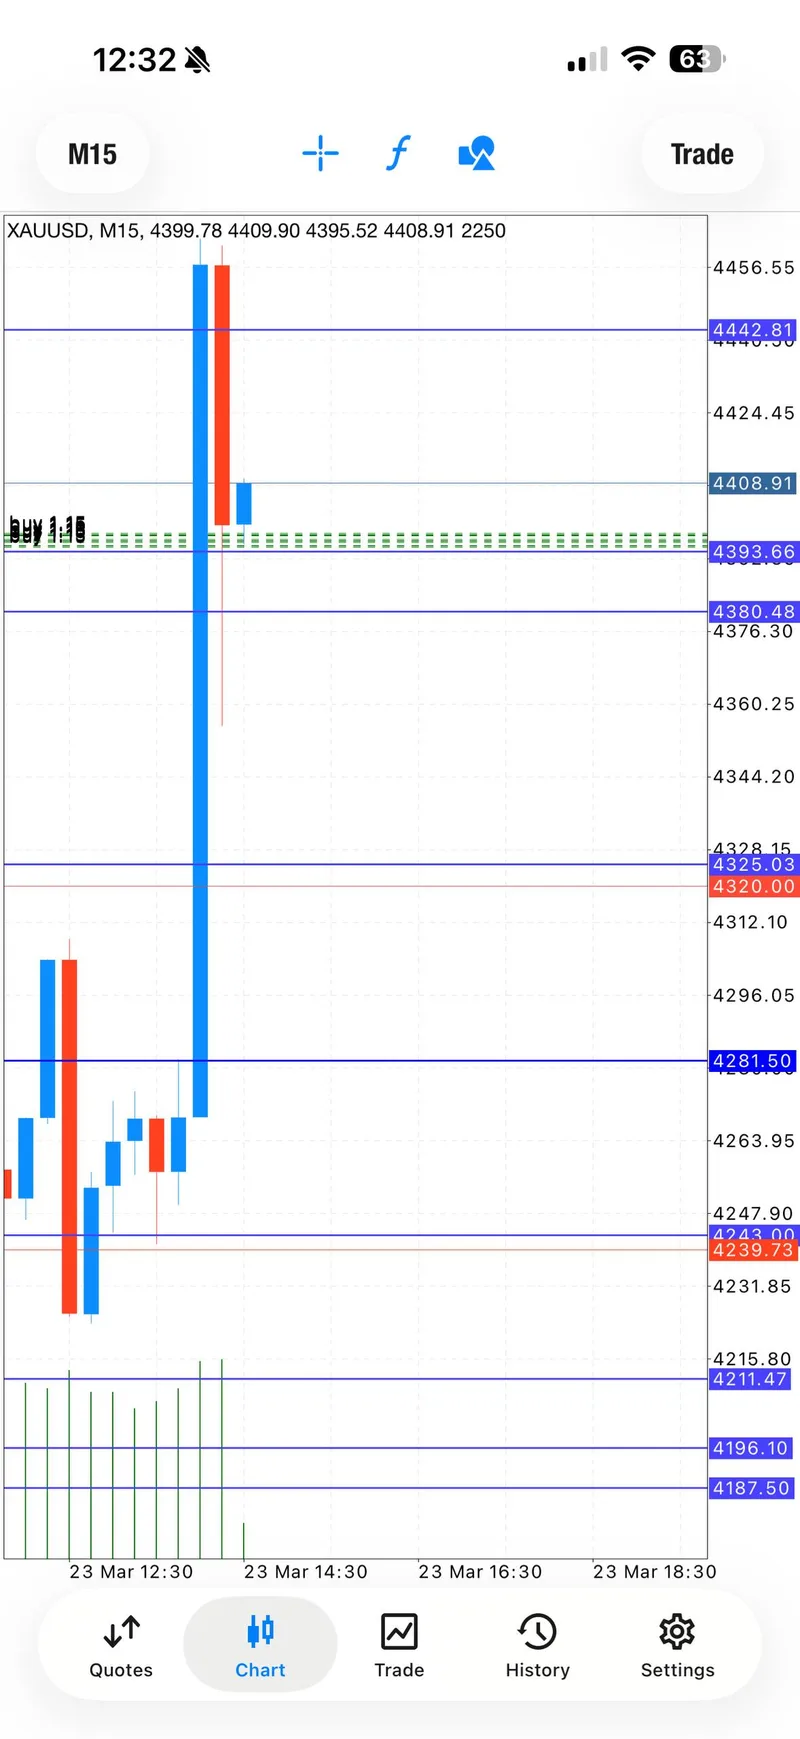
Volume and Momentum Indicators#
The M15 timeframe shows an enormous single candle spanning from $4,240 to above $4,440, with volume significantly above average. This type of climactic candle often marks a near-term exhaustion point. RSI readings are deeply oversold on the daily timeframe, suggesting a relief bounce is statistically likely within 2-3 sessions, even if the broader downtrend continues.
Trading Signals#
Today's gold trading signals reflected a disciplined approach: one high-conviction entry in the right conditions, with aggressive risk management throughout.
Signal 1: BUY XAUUSD — 11:26 UTC#
Context: Trump postpones Iran military strikes headline drops. Mo had been observing gold since the morning session, noting the extreme volatility and warning the community about high risk. When the geopolitical catalyst appeared, he entered decisively.
- Direction: BUY
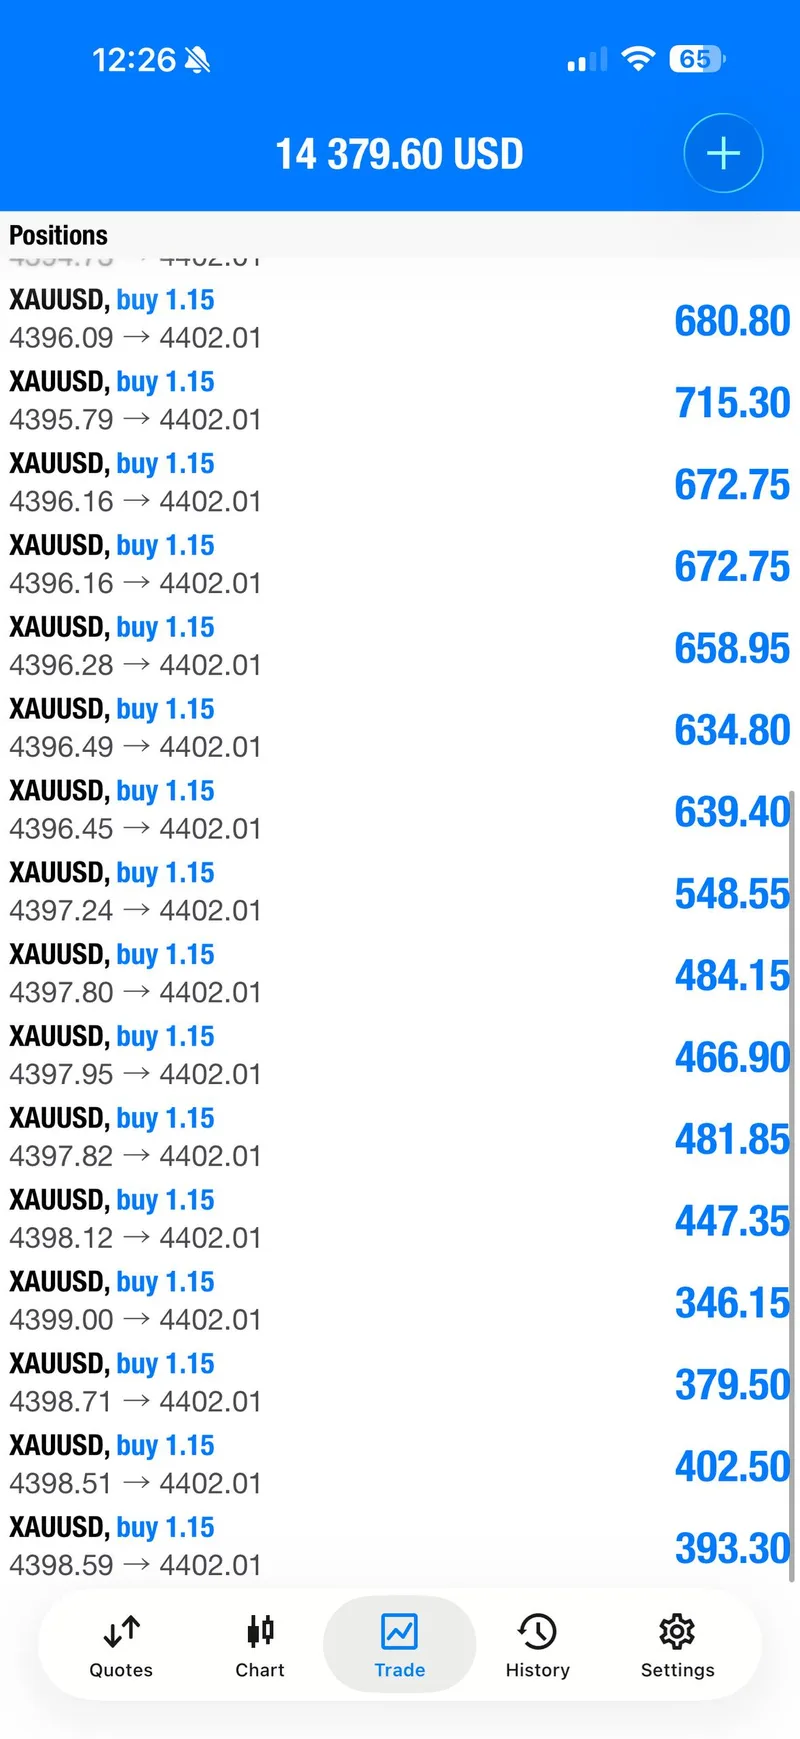
- Entry zone: $4,395–$4,399 (multiple entries at 1.15 lots each)
- Initial reaction: Instant 60+ pip spike within seconds
- Drawdown: 150 pips (-$2,300 drawdown before recovering)
- Profit-taking sequence: Half profits at 100+ pips → breakeven set → progressive closes at 200+, 300+, 400+ pips
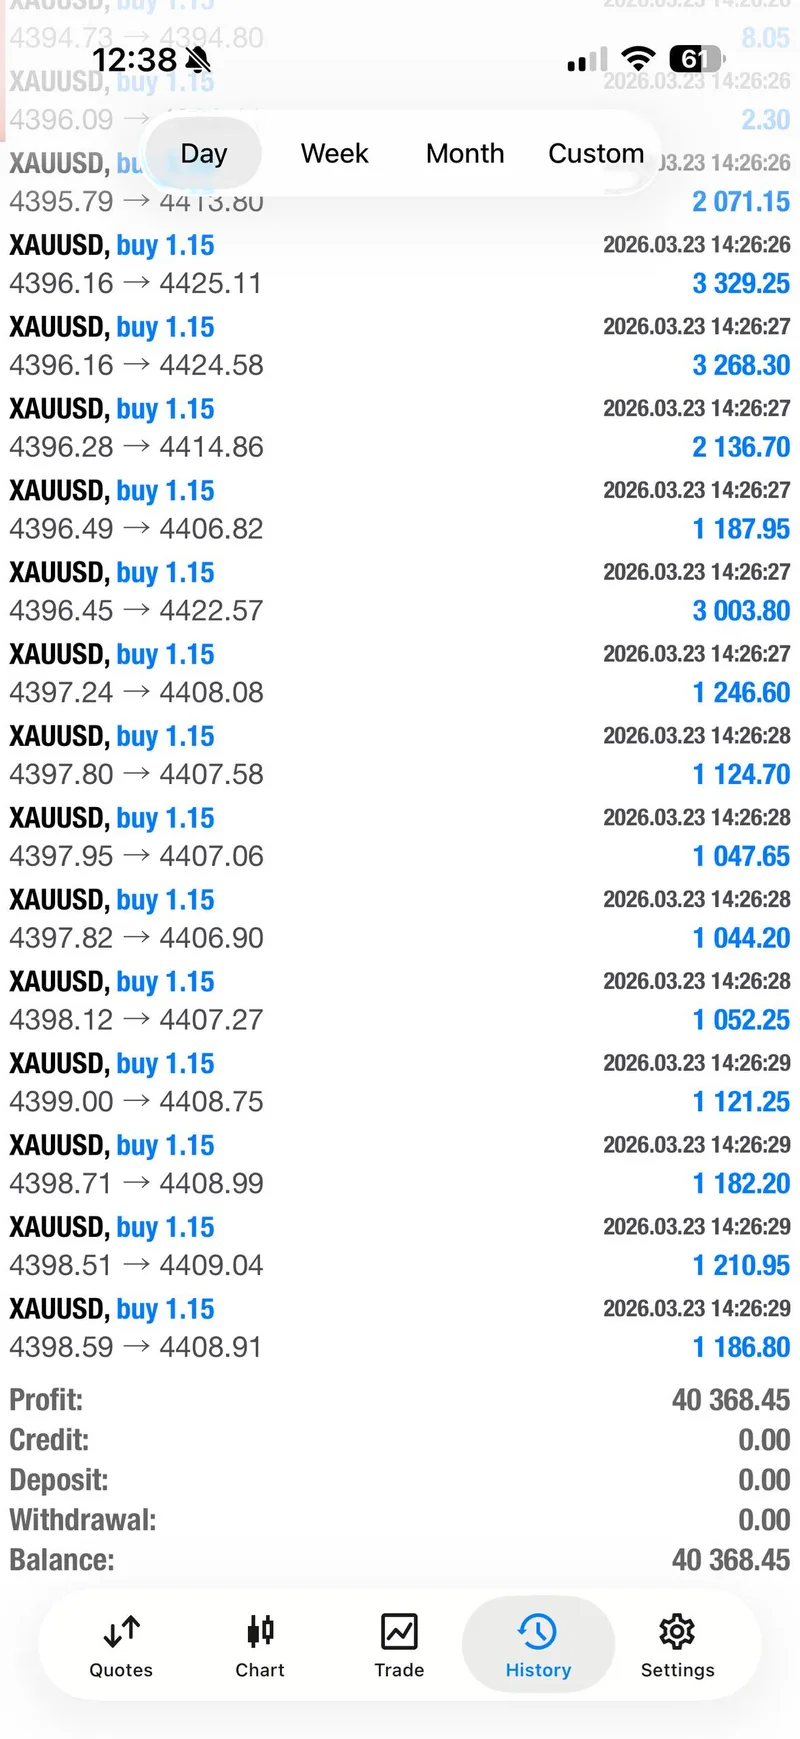
- Total closed profit: $40,368.45
- Risk management: Breakeven activated after initial targets hit; last entries closed at breakeven
- Outcome: WIN — $40,368.45 closed profit across 17 positions
Day Classification: WIN DAY#
One signal issued, one signal won. The dangerous drawdown mid-trade tested risk management protocols, but disciplined position sizing and progressive profit-taking converted a high-risk opportunity into a $40,000+ payday.
Signal Performance Breakdown#
Entry Analysis#
Mo entered the buy at the $4,395-4,399 zone immediately following the Trump/Iran headline. Multiple entries were placed rapidly at 1.15 lots each — a deliberate scaling strategy to capture the initial momentum while managing per-position risk.
The Critical Drawdown#
Within the first minute, price spiked 60+ pips up, then crashed 150 pips below entry. The drawdown hit -$2,300 before Mo could even type an update to the channel. In his words: "I somehow didn't want and couldn't even close — it was all less than 60-70 seconds." This was not a clean signal; it was a high-conviction entry during extreme conditions.
Progressive Exit Strategy#
Once price recovered and pushed higher, Mo executed a textbook progressive exit:
- 100+ pips: "Take half profits now" — locking in initial gains
- Breakeven set: "Set breakeven for zero risk if you want now or take the 110+ pips profits!"
- 200+ pips: Additional partial closes
- 300+ pips: "Good risk management survived this, and secured 300+ pips"
- 400+ pips: Final positions closed near session highs
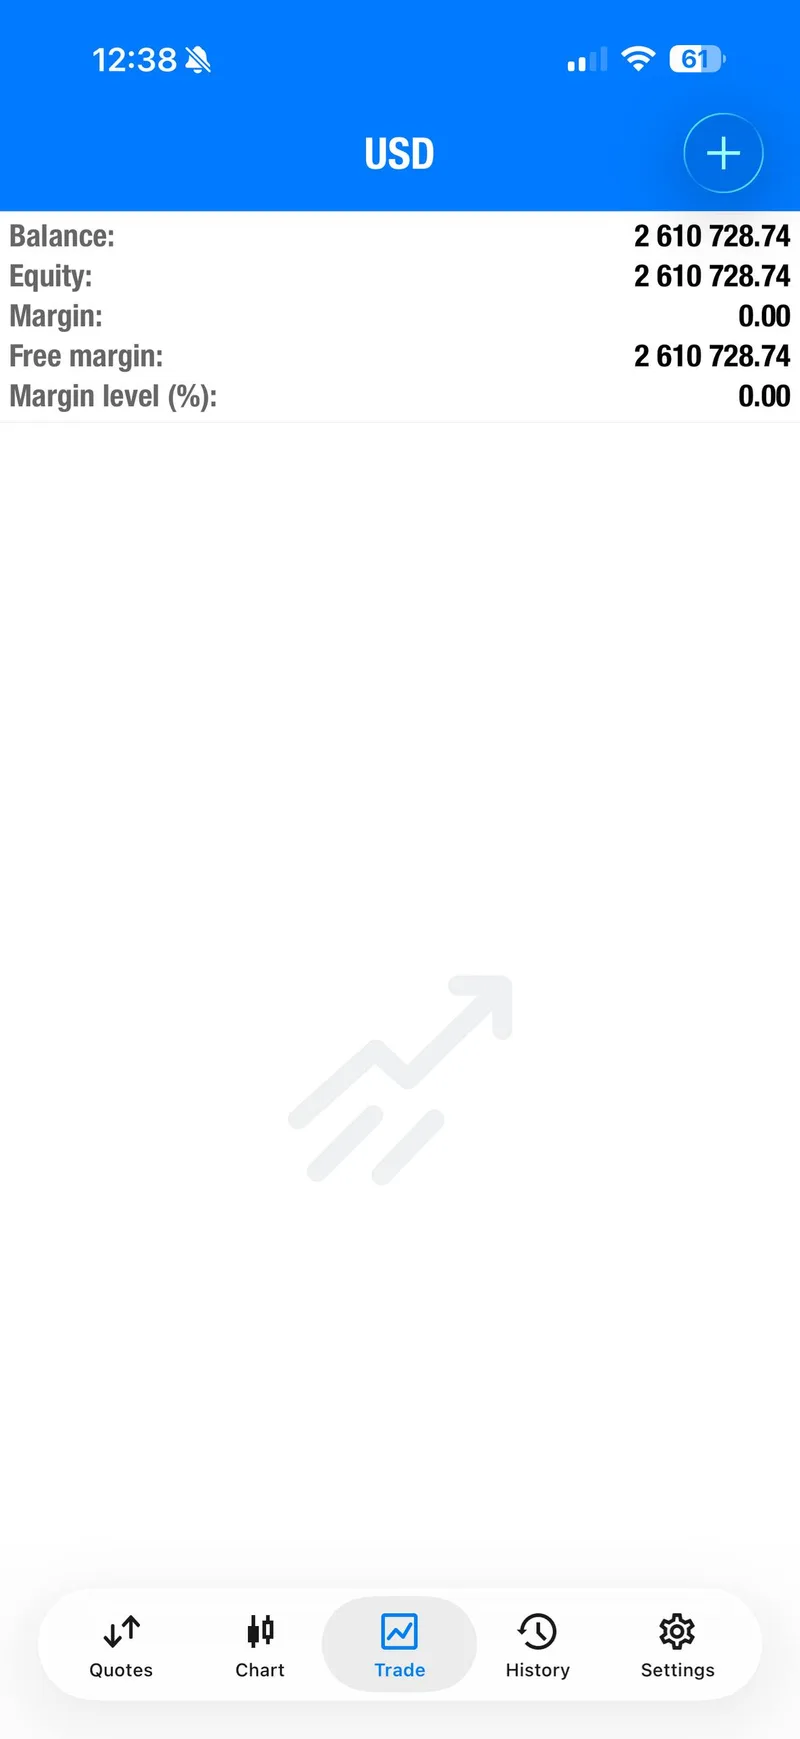
The total closed P&L across all 17 positions: $40,368.45. The account balance screenshot showed $2,610,728.74 after all positions were closed.
Why This Trade Worked#
The key insight was timing: Mo waited through the entire morning correction session without trading, explicitly telling the community to stay cautious. When the catalyst appeared, the entry was immediate and the position sizing was aggressive but controlled. The dangerous drawdown was survived specifically because the overall account risk was manageable at the 1.15-lot size.
Execution Lessons#
Lesson 1: Patience Before Precision#
Mo spent the entire morning watching the carnage unfold. At 09:27 UTC, he warned: "Gold had a crazy downfall already, the volatility and volume isn't something normal, very high risk to trade. Big players are fighting, we are only small retail traders." He held back until a clear geopolitical catalyst shifted the risk-reward equation.
Lesson 2: Surviving the Drawdown#
The 150-pip drawdown in under 60 seconds is the kind of move that wipes undercapitalized accounts. Mo's position sizing at 1.15 lots per entry meant the maximum drawdown was approximately $2,300 — uncomfortable but survivable for a $2.6M account. "Good risk management survived this, and secured 300+ pips. Bad risk management hardly survived this."
Lesson 3: Progressive Profit-Taking in Volatile Markets#
Rather than holding for a single target, Mo took profits at every 100-pip milestone while progressively moving stops to breakeven. This approach locked in realized gains while keeping remaining exposure risk-free. The result: most of the 17 positions closed in profit, with only the final entries hitting breakeven.
Lesson 4: Trading the News, Not the Noise#
Both the spike and the reversal were driven by contradictory headlines within minutes. Mo traded the initial headline with conviction but did not reverse or add to positions during the Iran denial crash. Knowing when to step back is as important as knowing when to enter.
What The Day Means Going Forward#


Short-Term Gold Forecast (This Week)#
Gold remains in correction mode with high-volatility regime classification. As explored in the weekly gold forecast for March 23-27, key economic data releases this week — including inflation indicators and labor market numbers — could provide the catalyst for either a relief bounce or further downside. The gold forecast favors a dead-cat bounce toward $4,410-4,430, but any sustained recovery requires a daily close above $4,450.
Geopolitical Premium Has Been Repriced#
The Trump-Iran situation demonstrated how quickly war premiums can be priced in and out. Monday's 1,600-pip spike followed by an 1,100-pip reversal shows that gold is trading as a headline-driven instrument right now, not a technical one. Until the Iran situation resolves, expect continued gold volatility and headline-driven moves that override traditional trading strategy setups.
Risk Management Is the Edge#
On a day where gold moved $215 in a single session, the difference between profitable traders and blown accounts was position sizing and stop discipline. Mo's $40,000+ win came not from a perfect entry, but from surviving a -$2,300 drawdown through proper risk management.
Member Testimonials#
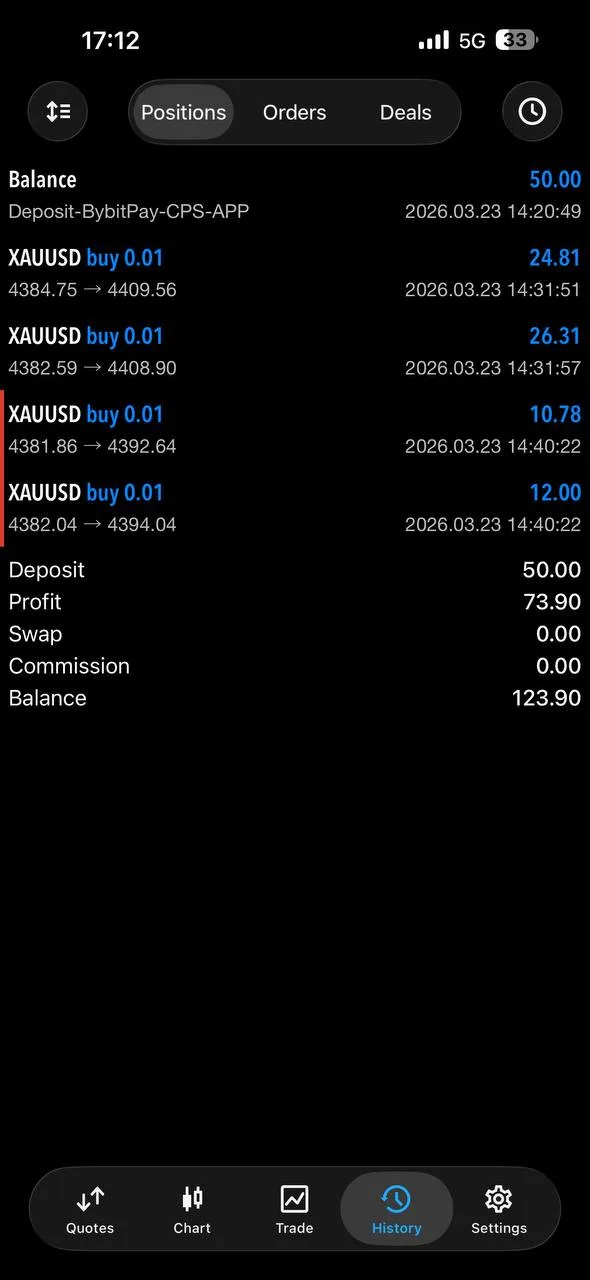
"You've done it again! Following Mo's buy signal turned my $50 deposit into $123.90 — nearly 150% return in one session." — Ruzaik Ibrahim
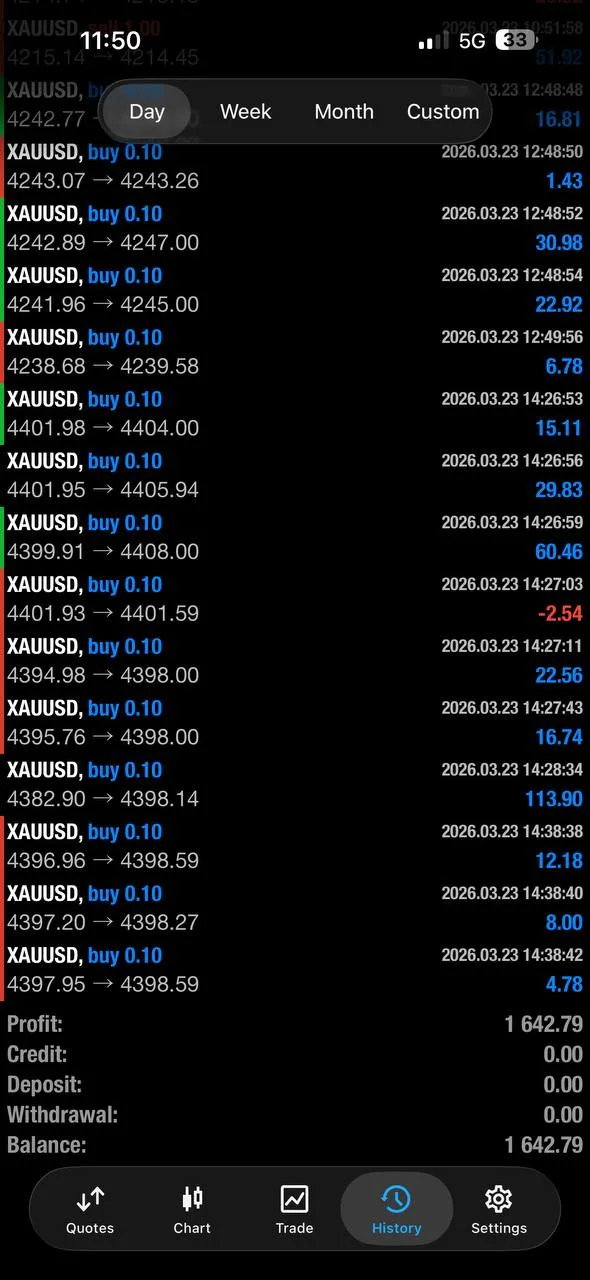
"Closed all positions with $1,642 profit today. The live updates in the channel made it easy to manage the trade step by step." — Nafis Ahmed
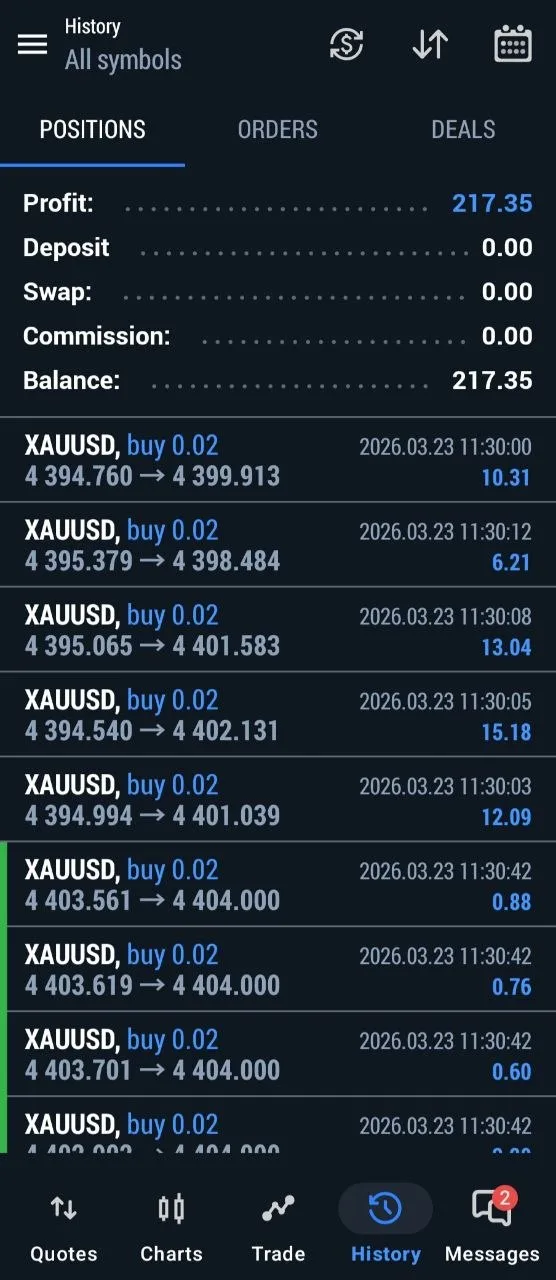
"Made $217 on my 0.02 lot account today. Small lots, big percentages. Mo's entry was perfect." — Nazim Raza
"$820 profit following the signal today. The breakeven instruction saved me during the Iran reversal." — Ijaz Khan
"Best man, it was such a pleasure meeting you in person. You're a role model for me." — BrainEgoTrades (community meetup)
"Thanks Mo, big shout out to you! The community support is unmatched." — Ruzaik Ibrahim
FAQ#
How does Gold Trader Mo trade during extreme volatility sessions?#
Mo demonstrated a two-phase approach on March 23: patience during the morning sell-off (explicitly avoiding trades when conditions were too dangerous), followed by decisive action when a clear geopolitical catalyst appeared. Rather than trying to catch falling knives, he waited for a high-conviction setup and managed risk aggressively with progressive profit-taking at every milestone.
What drives gold price swings of $200+ in a single session?#
Sessions like March 23 are driven by the intersection of geopolitical headlines, algorithmic trading flows, and positioning extremes. The Trump/Iran headline triggered a 1,600-pip spike in minutes, while the subsequent Iran denial caused a 1,100-pip reversal. ETF outflows (the largest single-day redemption in two years) amplified the selling pressure, and gold breaking below the $4,500 support level triggered algorithmic selling cascades and long squeezes.
How does Gold Trader Mo protect capital during unpredictable drawdowns?#
Position sizing relative to account size is the primary defense. Mo's 1.15-lot entries on a $2.6M account meant the 150-pip drawdown represented less than 0.1% of total equity. Combined with predetermined stop-losses and breakeven orders, this trading strategy ensures that even the worst-case scenario is a manageable loss rather than an account-threatening event.
Is the March 2026 gold correction over?#
Not yet. The gold market correction that began in mid-March 2026 has taken XAUUSD from the $5,022 peak down to $4,295 at today's session low — a decline of over 14%. While oversold RSI readings suggest a relief bounce is statistically likely within 2-3 sessions, the broader correction trend remains intact until gold reclaims $4,500 on a daily closing basis. Follow Gold Trader Mo's signals for real-time updates as the correction unfolds.
Where can I learn more about gold trading education and signals?#
Gold Trader Mo provides free gold trading education through the GTMO School blog, daily gold trading signals via the free Telegram channel, and real-time gold market analysis through the GoldNews channel. DM @GTMOBest on Telegram to get started with free access.
Connect with Gold Trader Mo#
Stay informed and trade alongside a proven gold trading education community:
- Free Signals: DM @GTMOBest on Telegram to join the free signal channel
- Live Gold News: Follow @GoldNews for 24/7 real-time gold market updates
- GTMO Free Channel: Join @GTMO for daily market commentary and community discussion
- Trading Education: Visit Gold Trader Mo for in-depth reports and analysis
- Weekly Summary: Read the weekly gold trading summary for March 16-20 covering last week's correction
- Previous Report: Read the March 20 daily gold trading report for last Friday's session analysis
Trading involves risk. Past performance does not guarantee future results. Results may vary based on account size, market conditions, and individual risk management.