Market Snapshot#
March 18 was a high-volatility XAUUSD session that rewarded traders who could change bias without changing discipline. Gold Trader Mo opened the day with a bullish idea around 4992.4-4989, managed early profit into TP1, then had to deal with a deeper drawdown as the market became unstable. A second buy attempt from 4982.5-4979 failed almost immediately when the support zone broke. That failure mattered because it forced the key decision of the day: stop insisting on the long idea and flip with the tape.
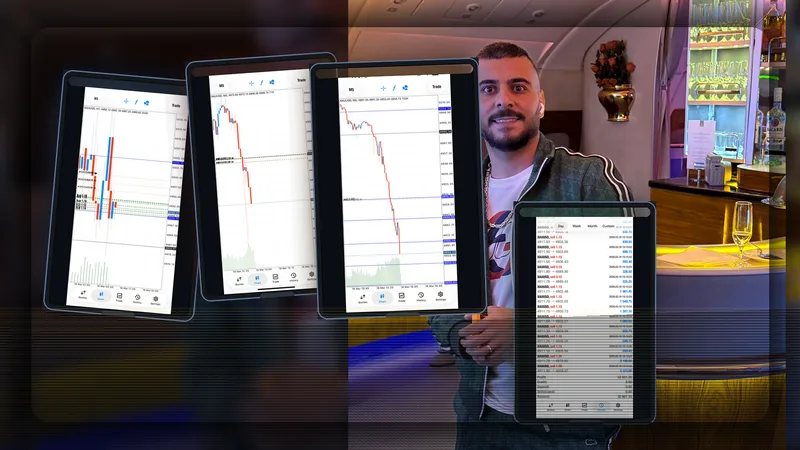
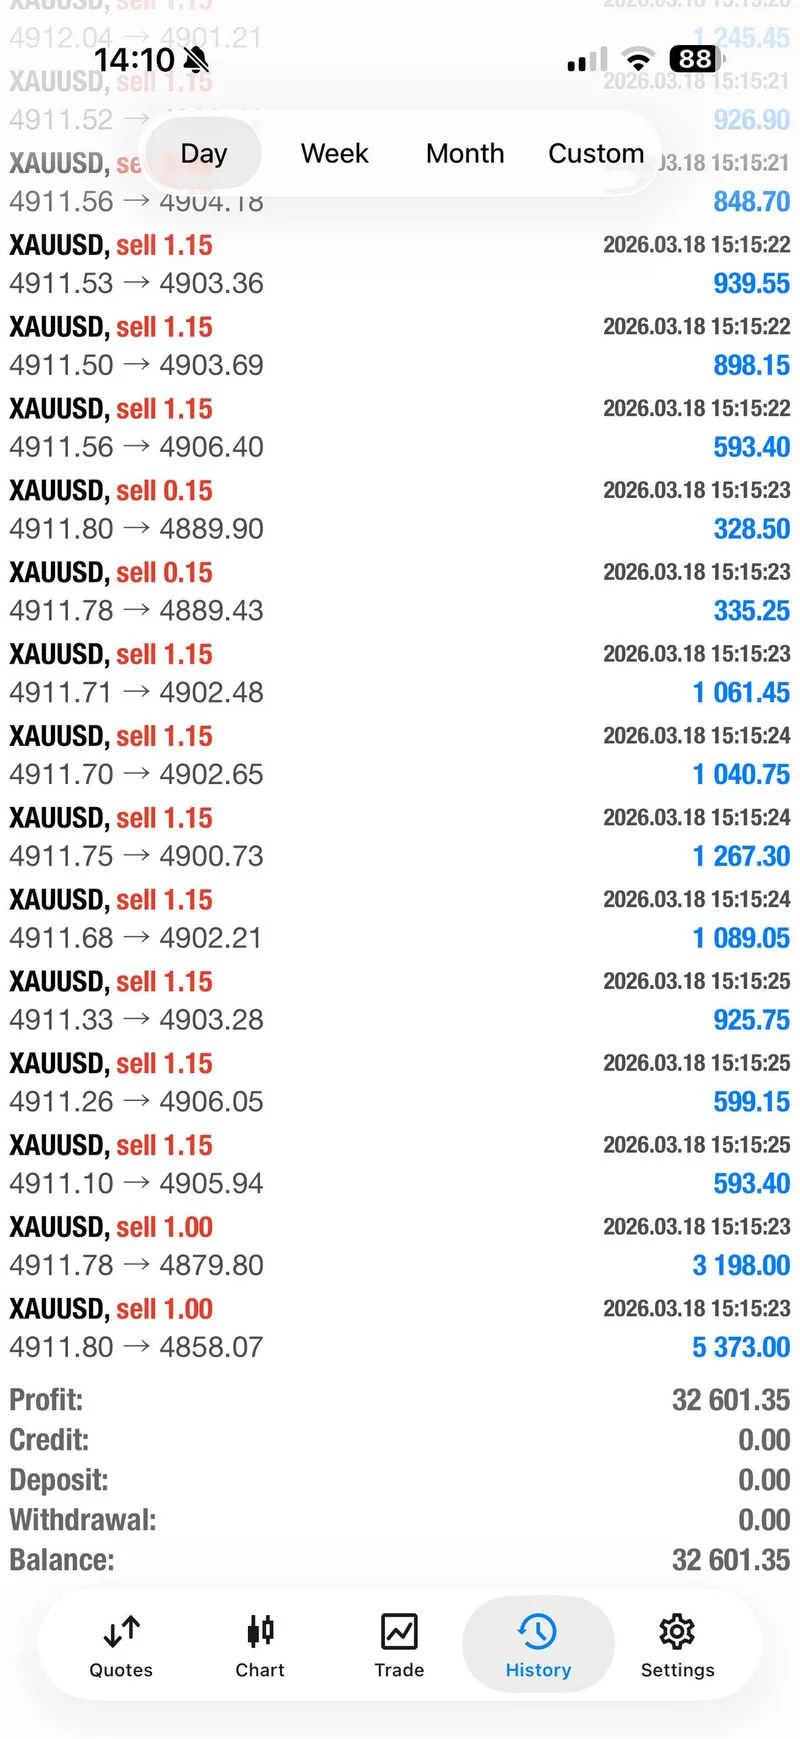
The reversal was the real story. Once the 4978-4982 zone was re-framed as a sell area, the session turned into a waterfall. Public updates confirmed TP1, TP2, TP3, and TP4 on the new bearish sequence, and the later continuation pushed the same direction-change idea into a 550-pip follow-through. By the afternoon, the desk shared the screenshot that framed the whole day in one image: from more than -$27,000 floating pain earlier in the session to a $32,601.35 day. For readers comparing how this week evolved, the March 16-17 combined report, the March 13 comeback session, and the weekly forecast for March 16-20 are the most relevant companion reads.
Market Dashboard#
| Metric | March 18 Session Read | What It Showed |
|---|---|---|
| Opening Trade Bias | Buy 4992.4-4989 | Buyers initially defended the morning pocket |
| Reset Attempt | Buy 4982.5-4979 | The second long failed once support cracked |
| Direction Change | Sell 4978-4982 | The bearish flip became the decisive trade of the day |
| Public Target Ladder | TP1 / TP2 / TP3 / TP4 | Full ladder completed after the bearish reversal |
| Later Session Follow-Through | 550+ pips | Continuation pressure remained strong after the first waterfall |
| Day Summary | $32,601.35 | The session ended as a full recovery day |
| Core Lesson | Adaptation over prediction | The edge came from reacting correctly, not marrying the first bias |
The important point is that March 18 was not a clean one-direction session from the start. It was a process day. The market let the first bullish campaign breathe just enough to bank some profit, then invalidated the long structure, then rewarded the traders who accepted the change and traded the downside aggressively. That makes this report especially useful for anyone studying live execution under pressure.
Why The Tone Changed So Fast#
The GTMO message flow gives enough evidence to explain the shift without inventing outside certainty. First, the morning trade was handled as a structured buy with explicit take-profit levels and a hard stop. Then the channel started warning about high volume, unstable candles, and a support zone that was no longer behaving the way a healthy long setup should behave. That is the kind of tape where stubbornness becomes expensive.
Later, the day was shaped again by US-session flow and high-impact news risk. The channel explicitly warned that major US data was close, and later noted that green numbers for the dollar favored more downside in gold. That macro note aligned with what the charts were already showing: rebound attempts were getting sold, candles were expanding lower, and the breakdown had more urgency than the earlier bounce. The market did not reward hope. It rewarded traders who accepted the bearish break and traded the new structure.
For the broader framework behind that behavior, the Gold Trader Mo archive is useful because it shows a repeated pattern around event-heavy weeks: the first idea matters less than whether traders can respond professionally when structure changes.
Technical Outlook#
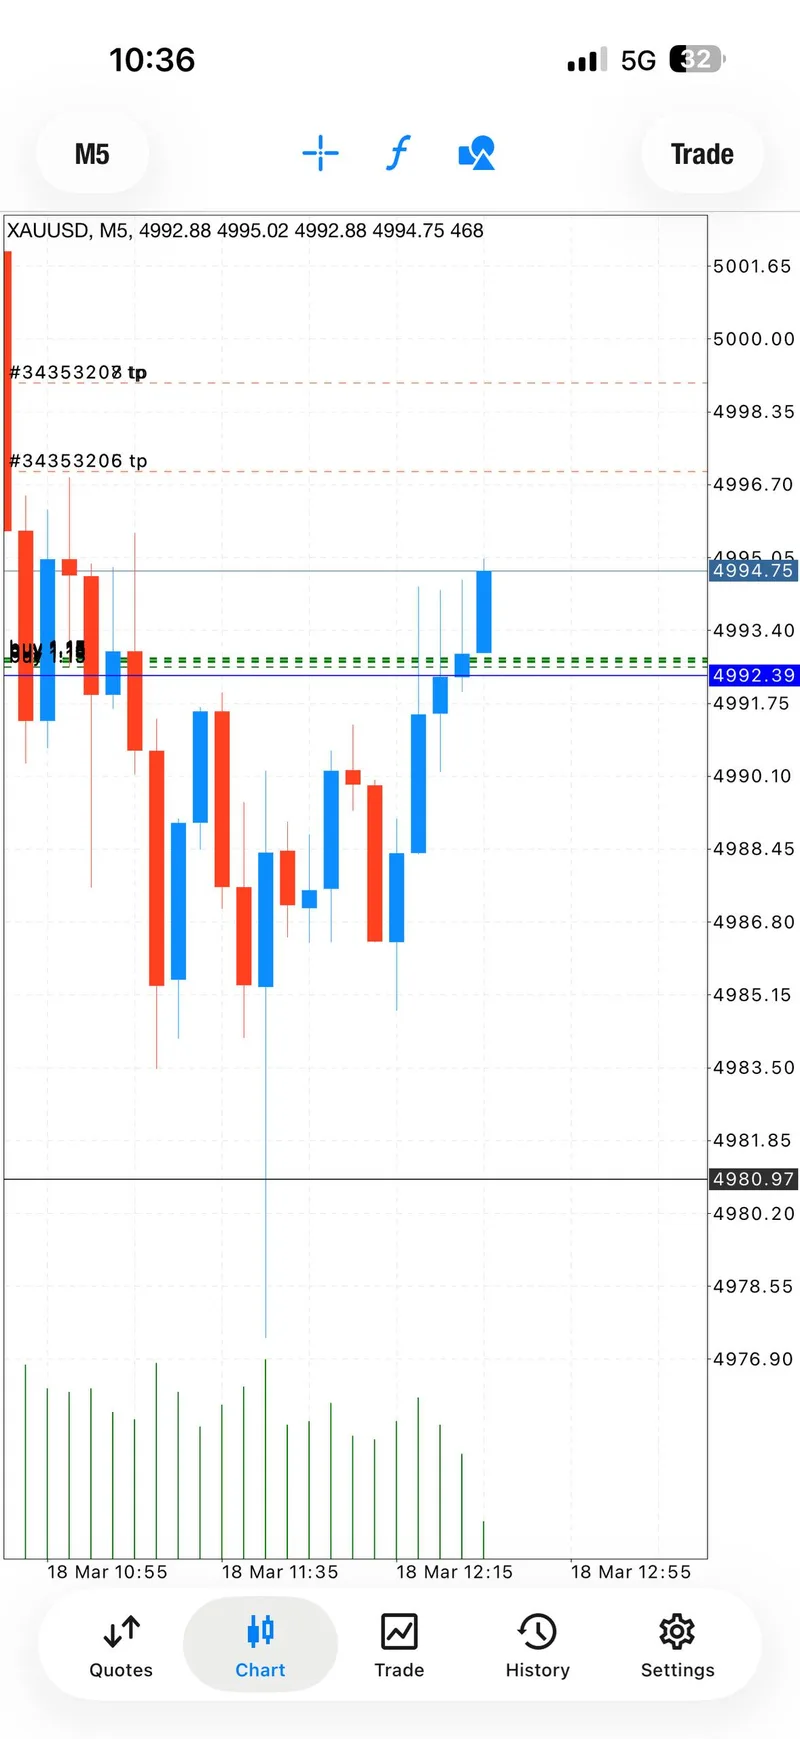
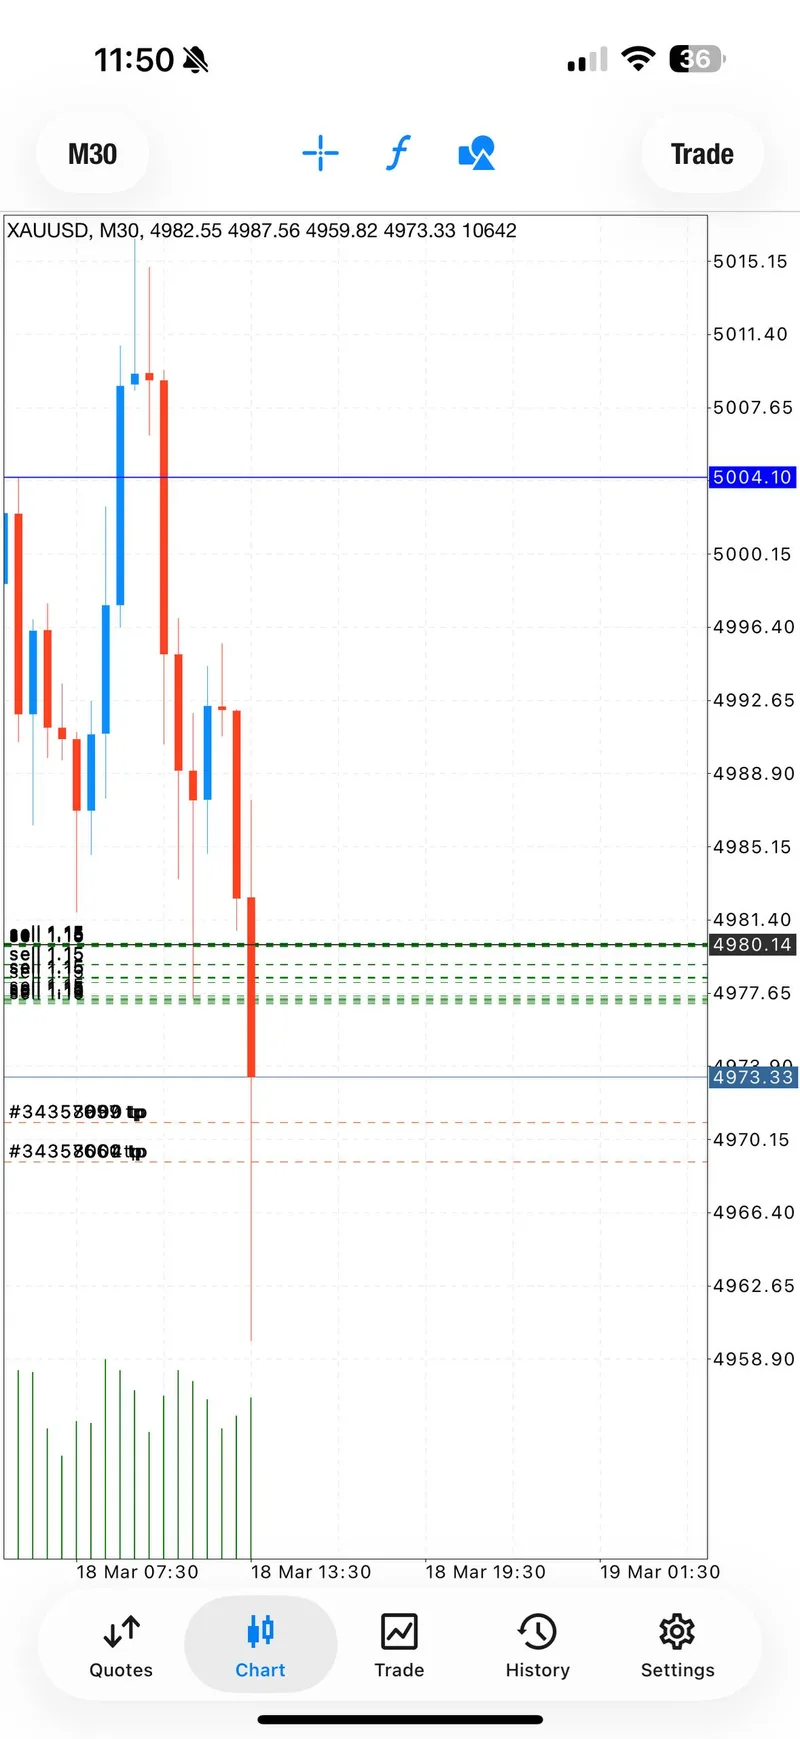
Technically, March 18 was defined by two battle zones. The first was the 4992-4989 area, where early buyers managed an initial push into profit. The second was the 4978-4982 band, which first acted as support for the reset long and then flipped into a sell zone once price could no longer hold above it. That flip is the technical hinge of the entire report.
Key Price Levels#
| Level | Role | Why It Mattered |
|---|---|---|
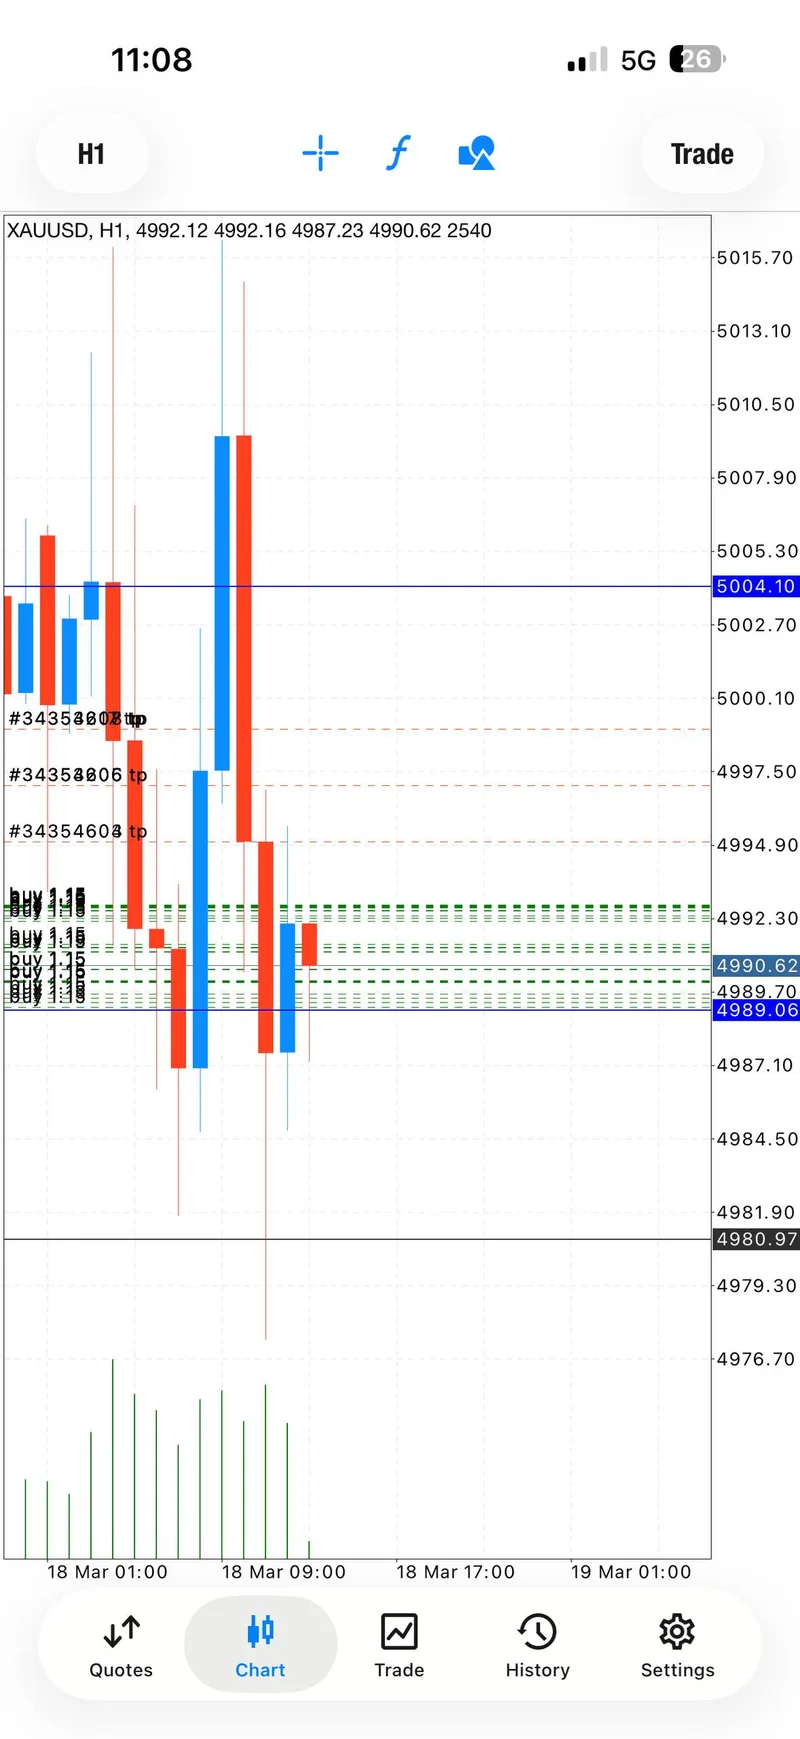
| 5004.10 | Overhead pivot | The session repeatedly referenced this line as a higher resistance marker |
| 4992.4-4989 | Early demand pocket | Morning buy campaign started here |
| 4982.5-4979 | Reset support zone | The failed re-entry area that exposed the tape weakness |
| 4978-4982 | Bearish flip zone | Once reclaimed from below, it became the sell framework |
| 4975 / 4973 / 4971 / 4969 | Public sell targets | The full take-profit ladder on the reversal campaign |
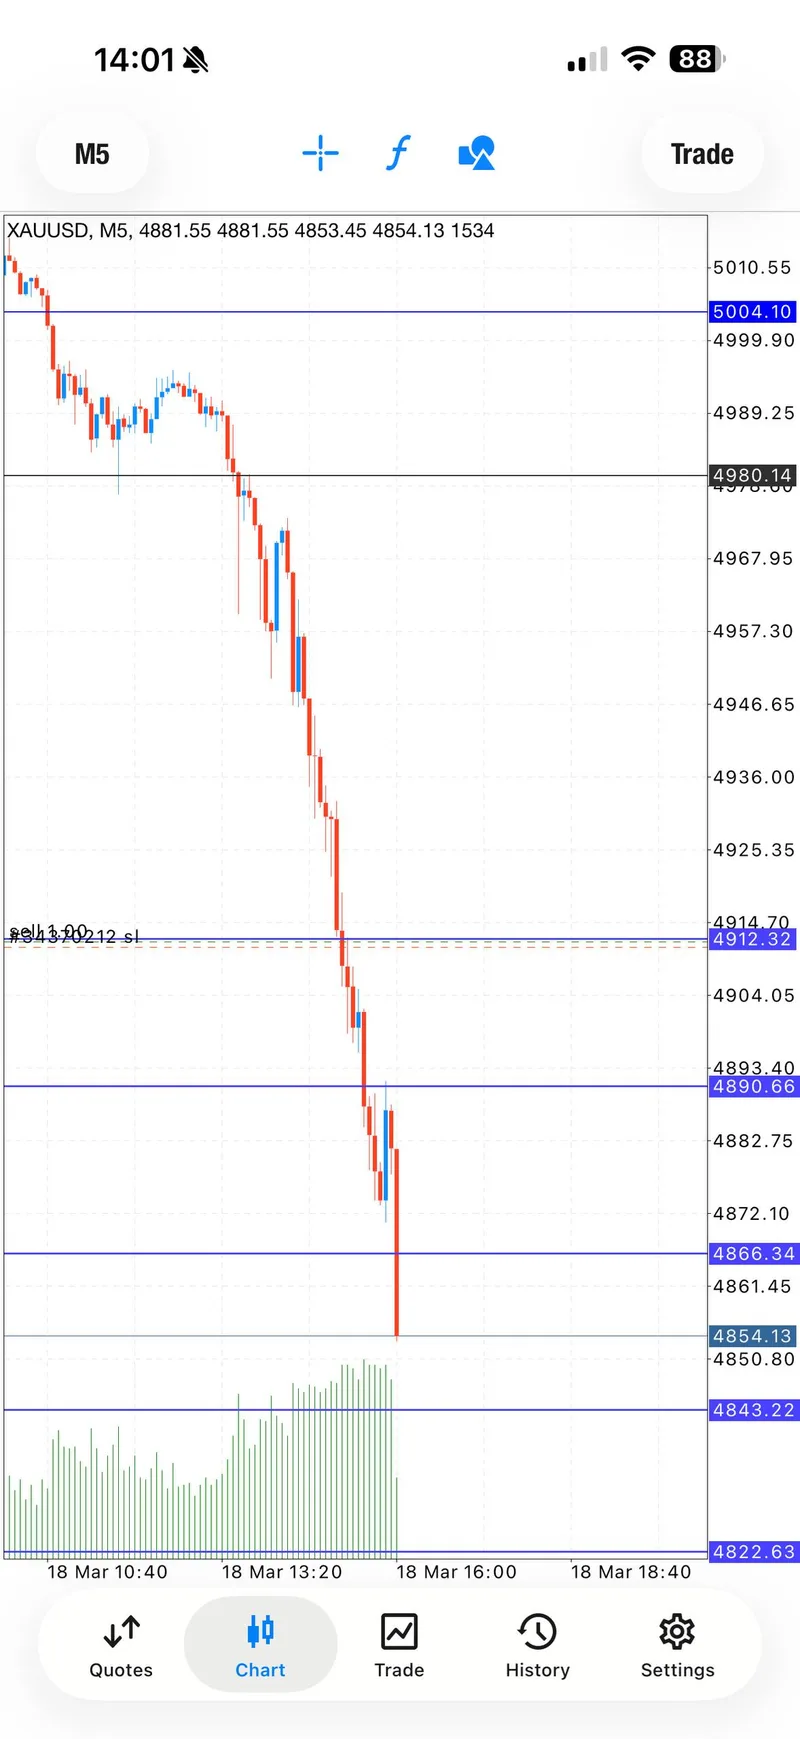
| 4911.8-4915 | Later-session sell zone | The continuation move that accelerated into the bigger waterfall |
| 4858 area | Deep extension | Showed how far momentum stretched by the end of the session |
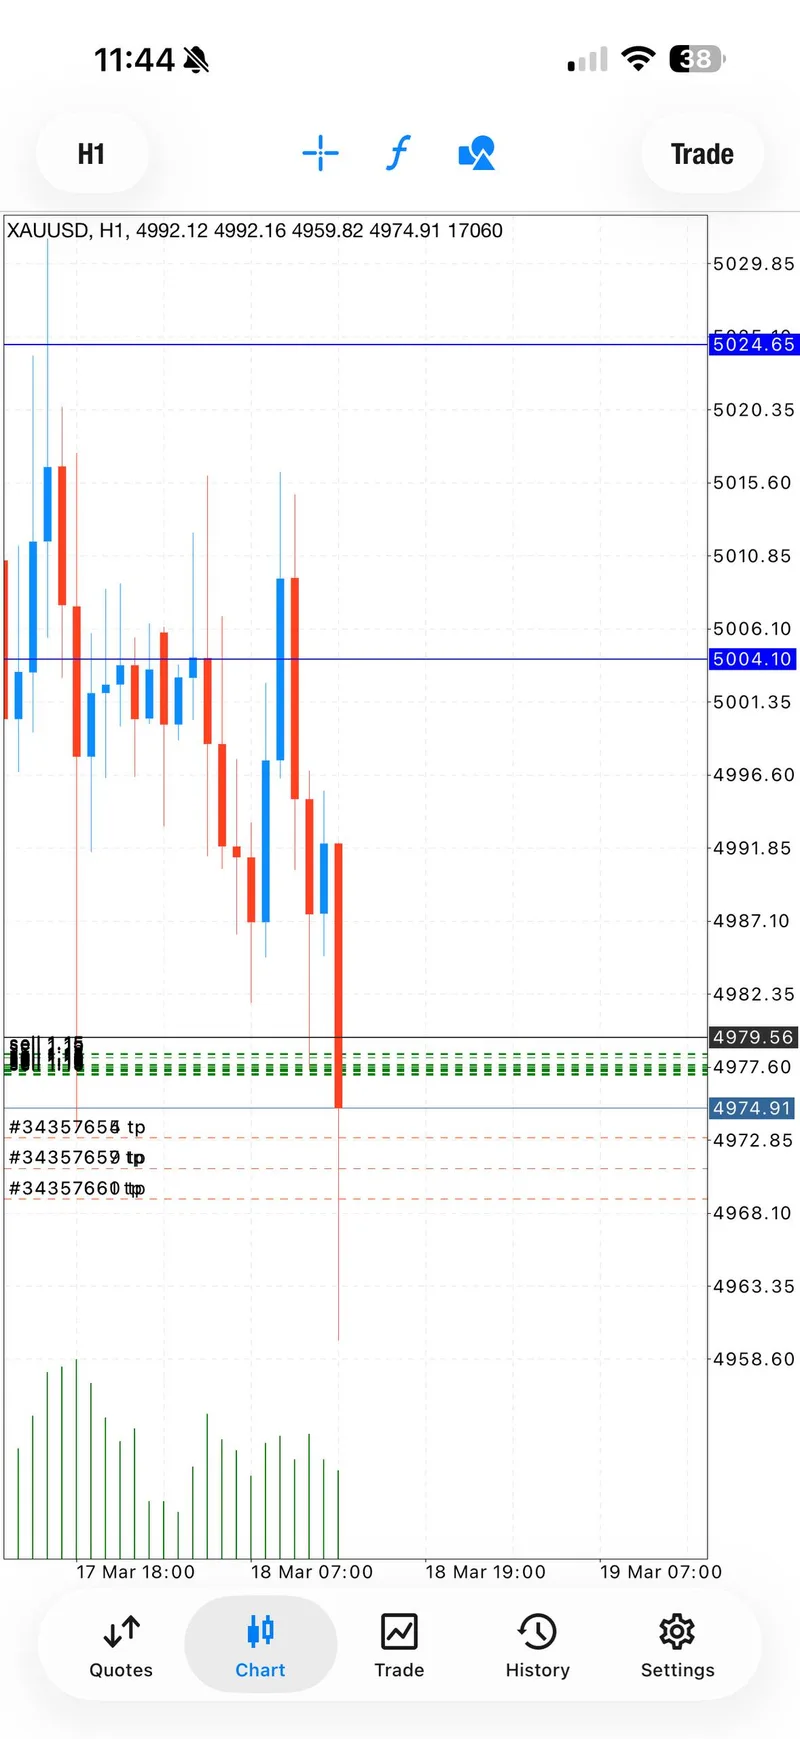
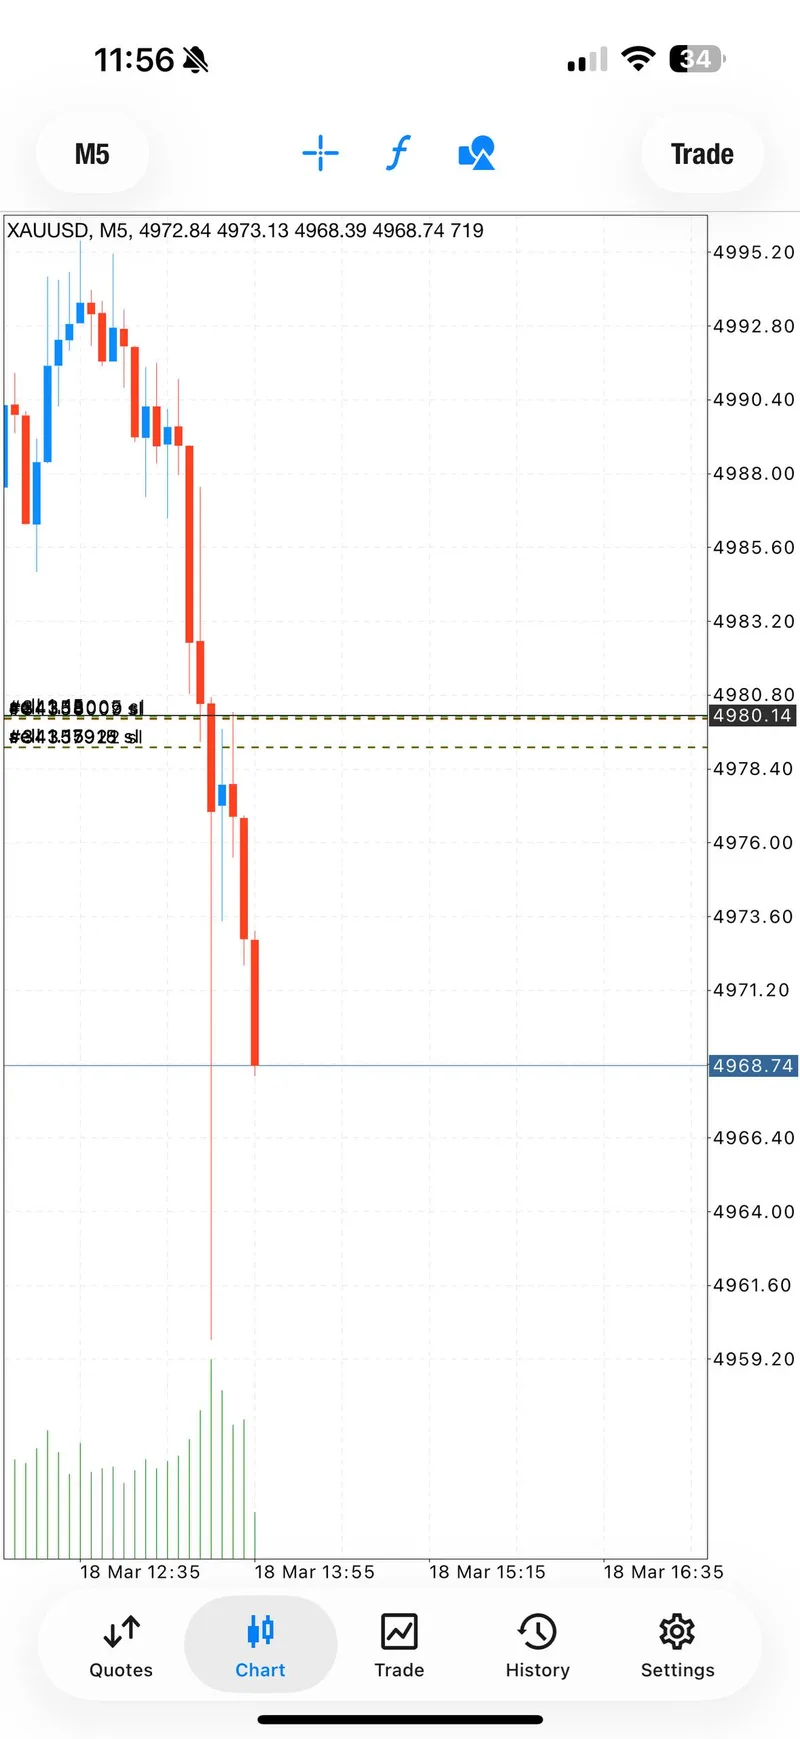
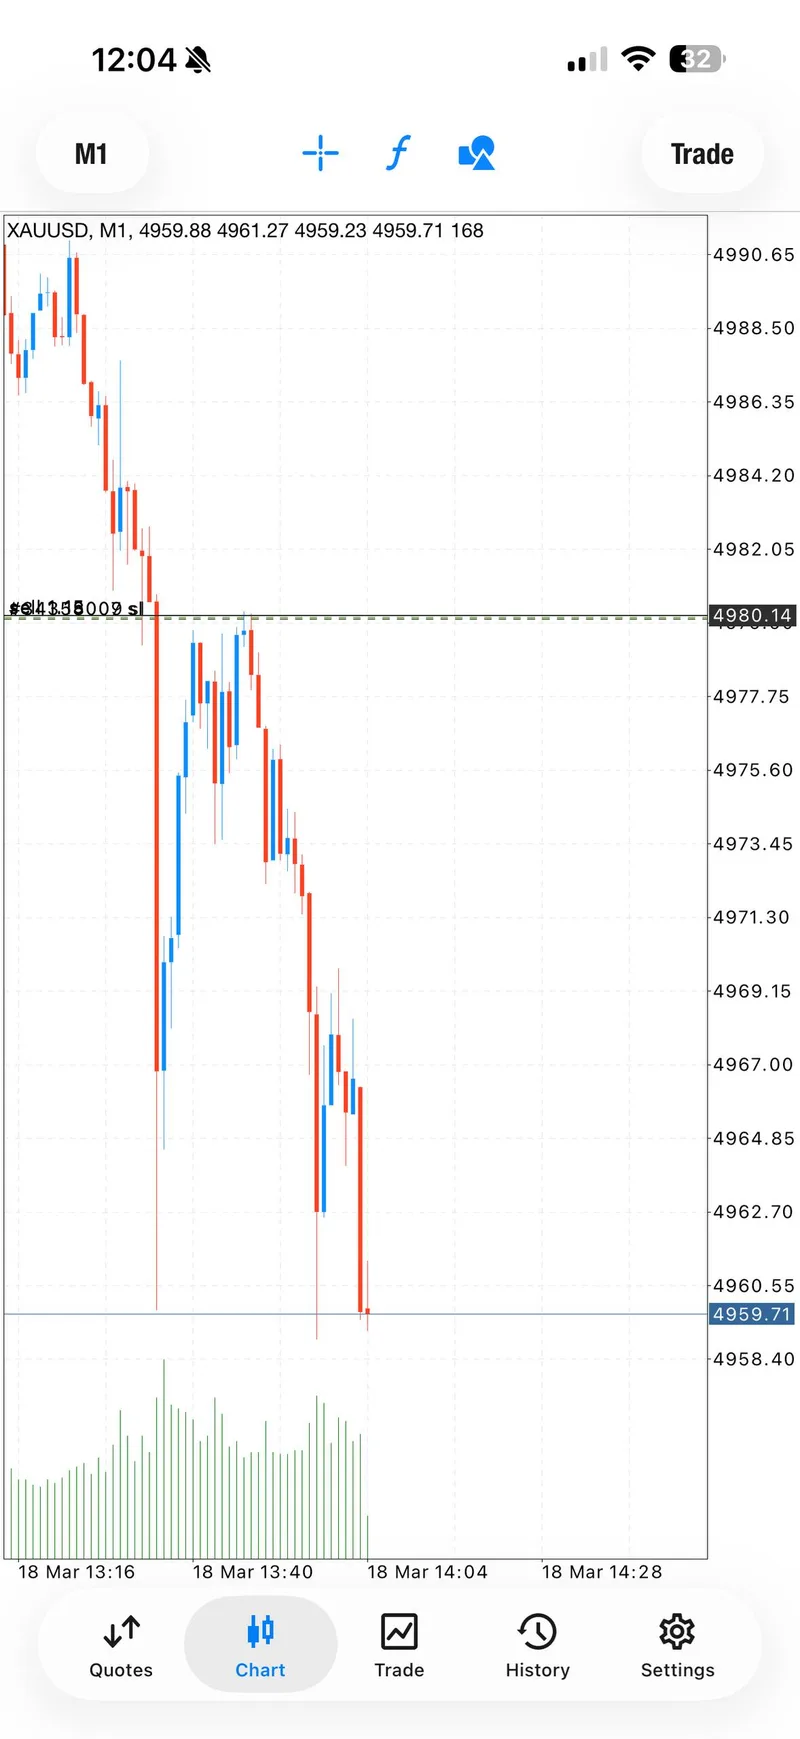
The structure read is straightforward: the market punished late bullish persistence and rewarded clean bearish continuation. The strongest chart evidence from the day supports that interpretation. The early screenshots show the long zone defending and TP1 printing, but the later ones show the sell entries sitting above price while gold keeps dropping through target after target. By the time the 550-pip image was posted, the chart no longer looked rotational. It looked like full capitulation.
Trading Signals#
March 18 is best understood as three linked campaigns rather than one seamless trend.
Signal 1 — Early Buy#
- Entry: 4992.4-4989 BUY
- SL: 4985
- TP: 4995, 4997, 4999, open
- Outcome: TP1 was confirmed and traders were told they could move to breakeven for zero risk, but the setup later lost momentum and the session became unstable
Signal 2 — Reset Buy#
- Entry: 4982.5-4979 BUY
- SL: 4975
- TP: 4985, 4987, 4989, 4991, open
- Outcome: The support zone failed quickly, GTMO stated there was no chance for buying in that structure, and the long thesis was abandoned
Signal 3 — Direction-Change Sell#
- Entry: 4978-4982 SELL
- SL: 4986
- TP: 4975, 4973, 4971, 4969, open
- Outcome: TP1, TP2, TP3, and TP4 all printed, breakeven was set on runners, and the move expanded into a 180-210+ pip public result
Later Session Follow-Through#
After the public reversal worked, the bearish thesis kept paying. A later sell from 4911.8-4915 accelerated almost immediately, printed all three stated targets in minutes, and then extended through 150+, 200+, 300+, 360+, and finally 550+ pips before the desk announced it was closing everything. That later continuation is why the day summary was so dramatic. The public reversal was already a strong report. The extended sell campaign turned it into a headline session.
Signal Performance Breakdown#
The educational value of March 18 comes from the contrast between the first half and the second half of the session.
What Went Right Early#
The early buy was not reckless. It had a clear zone, a defined stop, and real evidence that price could still bounce. TP1 printed, breakeven management was encouraged, and traders had a real chance to reduce or remove risk before the tape changed. That matters, because it means the first idea was not “wrong” in a sloppy way. It was simply valid only for a limited window.
Why The Reset Long Failed#
The second buy attempt exposed the real condition of the market. Once the zone stopped behaving like support, GTMO did the correct thing and said so explicitly: buying no longer made sense. That kind of message is more important than pretending every session should be read perfectly from the first entry. On fast days, the real edge comes from knowing when the original thesis is no longer worth defending.
Why The Sell Worked So Well#
The reversal worked because price action and instruction finally aligned. The sell zone was clear, the targets were realistic, and the updates became more decisive with each push lower. Traders were told when TP1 hit, when TP2 was printing, when breakeven should be set, and when the waterfall was accelerating. By the time the desk said the direction change had delivered four take-profits with zero emotion, the message sequence and the chart sequence matched perfectly.
That is why this session belongs in the same conversation as the March 16-17 reset-and-rebound report. Both reports show the same deeper GTMO principle: surviving the wrong side matters because it keeps you available for the right side.
Execution Lessons#
The first lesson is that adaptation beat conviction. Traders who insisted that gold “had to bounce” were fighting the market after the evidence changed. Traders who accepted that the zone had broken and that sellers were in control were paid quickly.
The second lesson is that risk management was not a footnote. The opening long included breakeven guidance after TP1. The public sell included instructions to take some profit and protect the rest. The later continuation again referenced holding runners with breakeven while the dollar backdrop favored more downside. March 18 was not financial advice, and it did not reward random size. It rewarded management.
The third lesson is psychological. The afternoon PnL screenshot only makes sense because the session had real emotional pressure before it. The desk later described the day as moving from over -$27,000 into a $32,000+ outcome. That swing is exactly why traders need a process. Trading involves risk, and without a process, volatility like this turns into panic instead of opportunity.
What The Day Means Going Forward#
March 18 should make traders more selective, not more reckless. The day proved that gold was capable of enormous directional movement once the wrong-side liquidity was exhausted. But it also proved that the path into that move could be messy and expensive for anyone who refused to adapt.
For the next sessions, the practical takeaway is simple: respect zone behavior first, narrative second. If gold can no longer defend a support pocket, treat that information seriously. If a breakdown starts behaving like acceptance rather than a fakeout, the better opportunity may be in the reversal rather than the original idea. That mindset is what turned March 18 from a stressful start into one of the most impressive single-day GTMO recaps of the month.
If you want the broader context around how these daily sessions fit together, the daily gold trading reports archive remains the best place to follow the sequence.
FAQ#
Was March 18 a winning day from the start?#
No. The day started with a buy campaign that produced early profit, then a second long attempt that failed, and only after that did the decisive bearish reversal appear. The session became a major win because the bias changed correctly, not because the first idea worked all day.
What was the most important trade on March 18?#
The most important trade was the 4978-4982 sell after the support break. That was the public direction-change setup that hit all four listed take-profits and reframed the whole session.
Why does the later 550-pip move matter?#
It matters because it confirmed that the bearish break was not just a quick scalp. The continuation showed real follow-through and turned the day into a full-session result rather than a short-lived recovery.
Connect with Gold Trader Mo#
- 🆓 Free Signals: GTMO Trades
- 💬 Support: @gtmobest
- 📺 YouTube: GTMOFX
- 📸 Instagram: mojirjees
- 🌐 Website: Gold Trader Mo
⚠️ Risk Disclaimer: Trading gold (XAUUSD) carries significant risk. Past performance does not guarantee future results. This article is not financial advice, and trading involves risk. Only trade with capital you can afford to lose.