1. Market Snapshot — March 16-17, 2026#
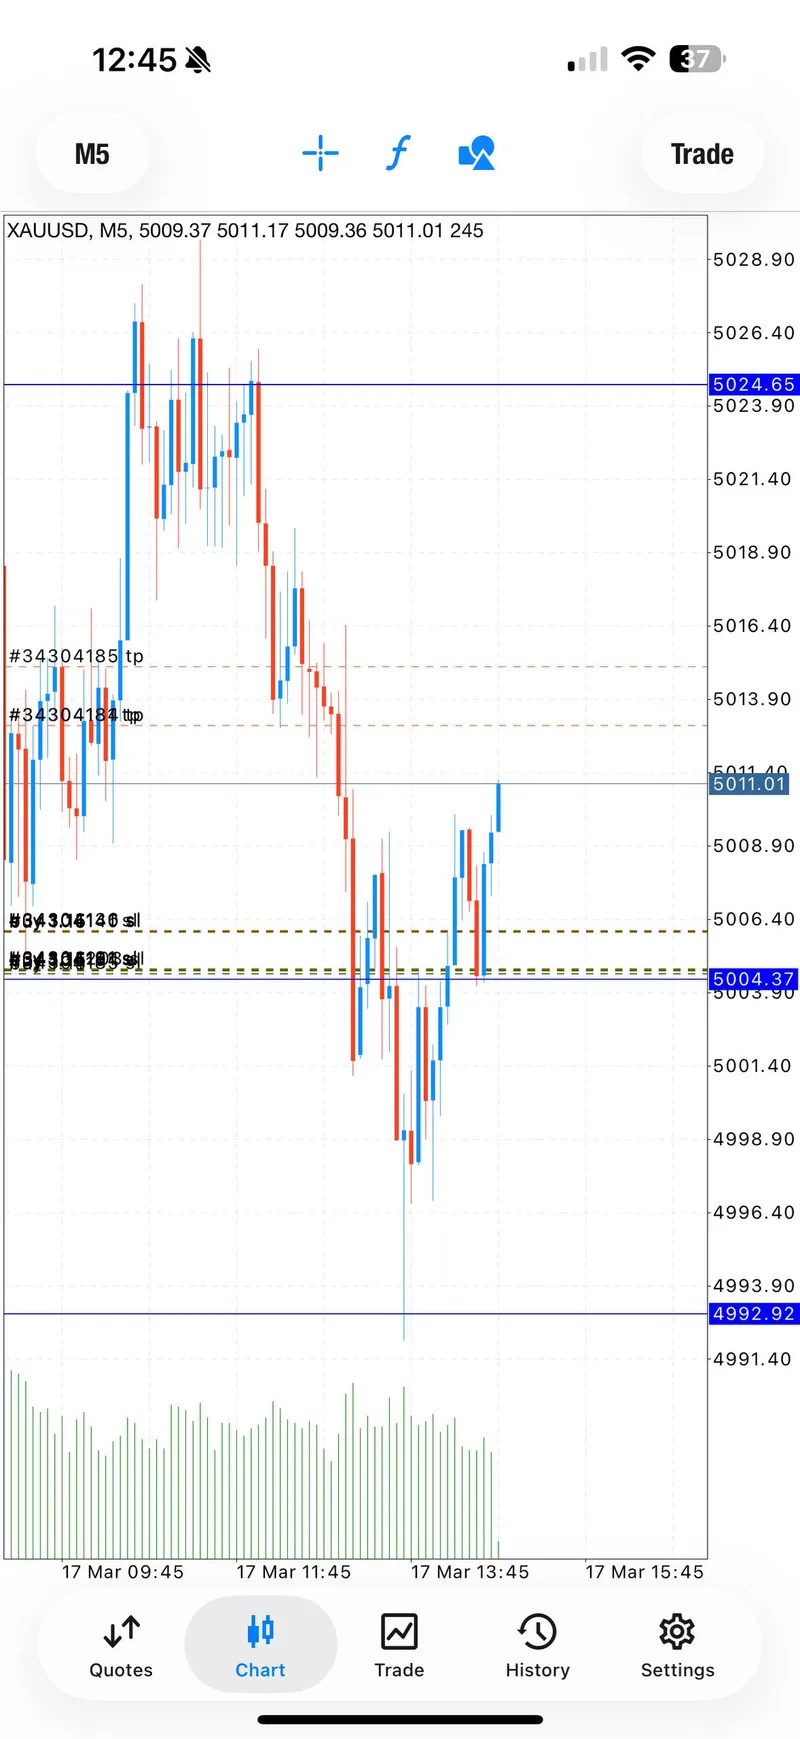
March 16 and March 17 need to be read as one complete GTMO story, not as two unrelated sessions. The first day was a volatility-heavy risk-management test. Gold briefly probed the lower part of the short-term range near the high-$4,970s, oil remained elevated on Middle East supply anxiety, and the tape kept punishing aggressive conviction before the market had settled. GTMO issued two SELL attempts during that unstable window. Both were fully defined, both used hard stops, and both ended as controlled exits rather than emotional hold-and-hope positions. That is the correct way to describe the first day: not a collapse, but a session where capital preservation mattered more than forcing a hero trade.
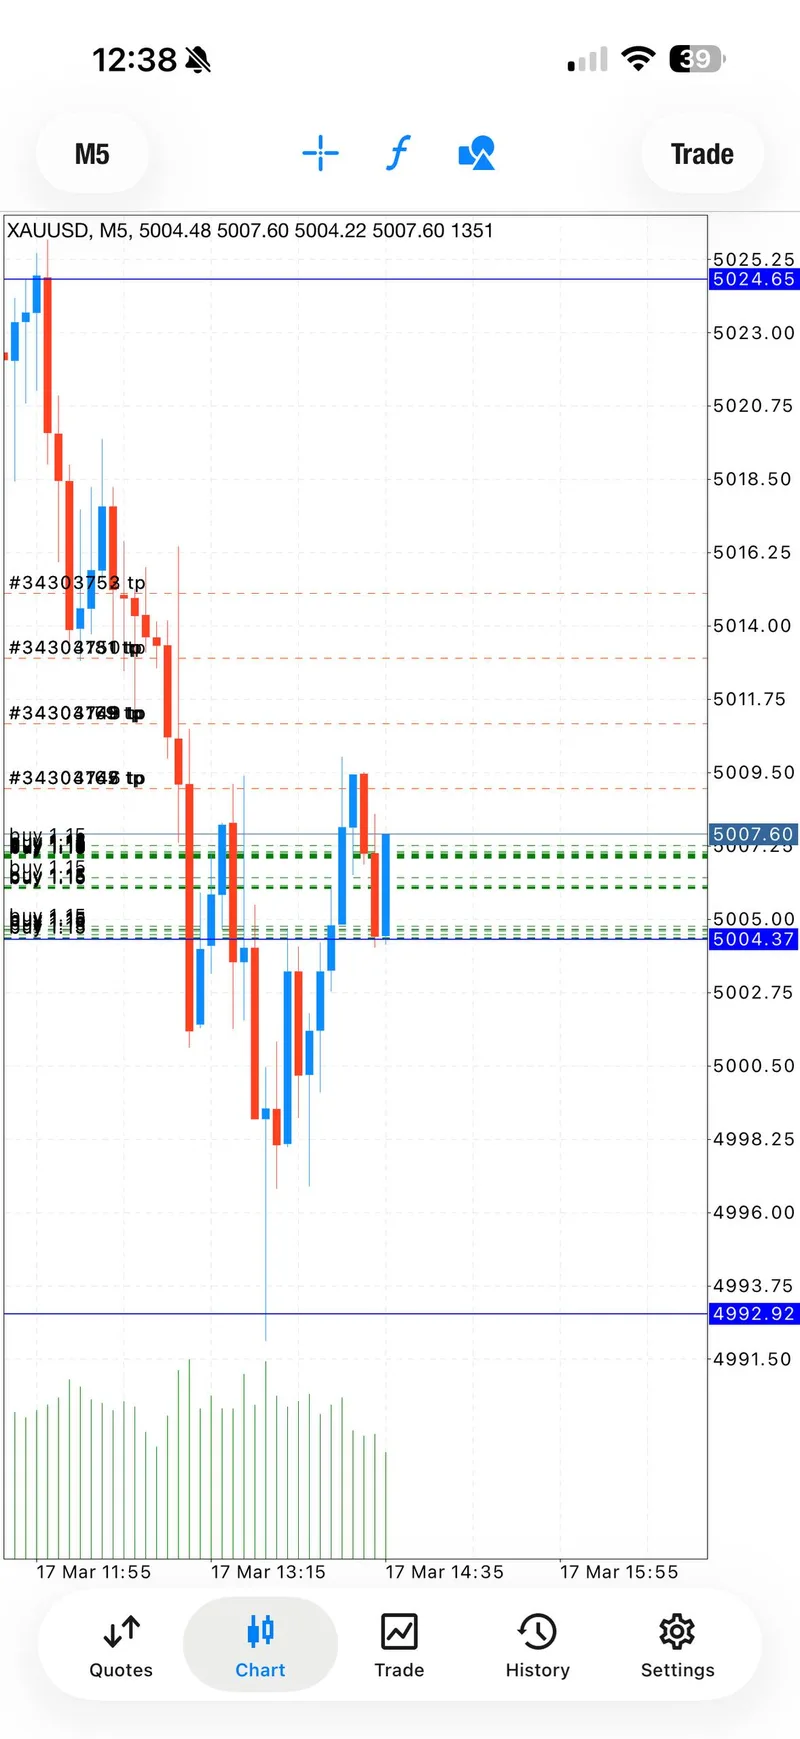
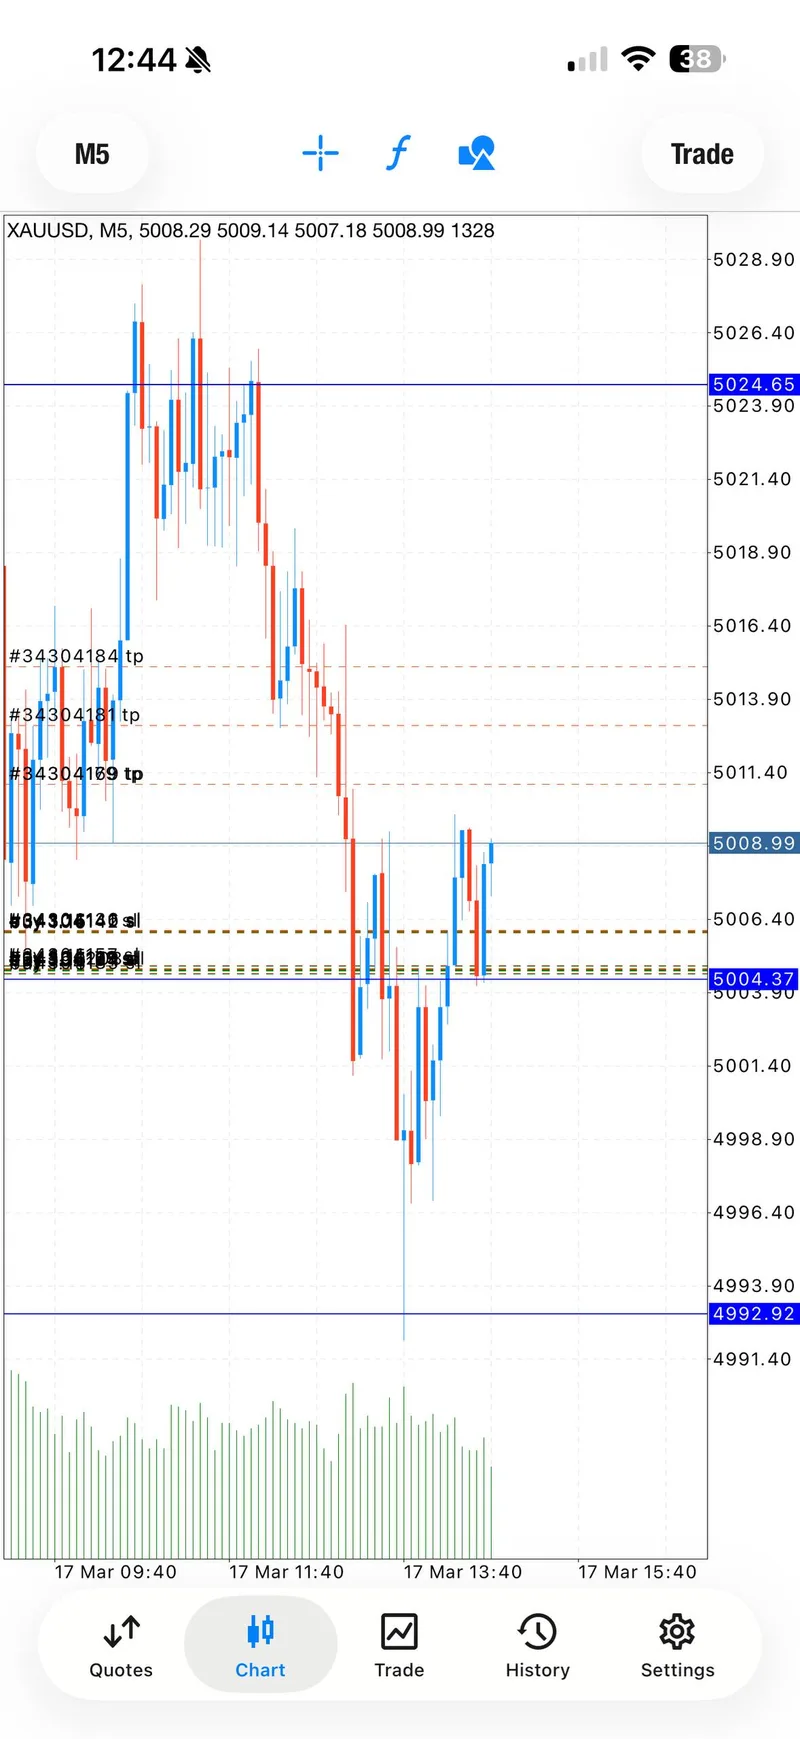
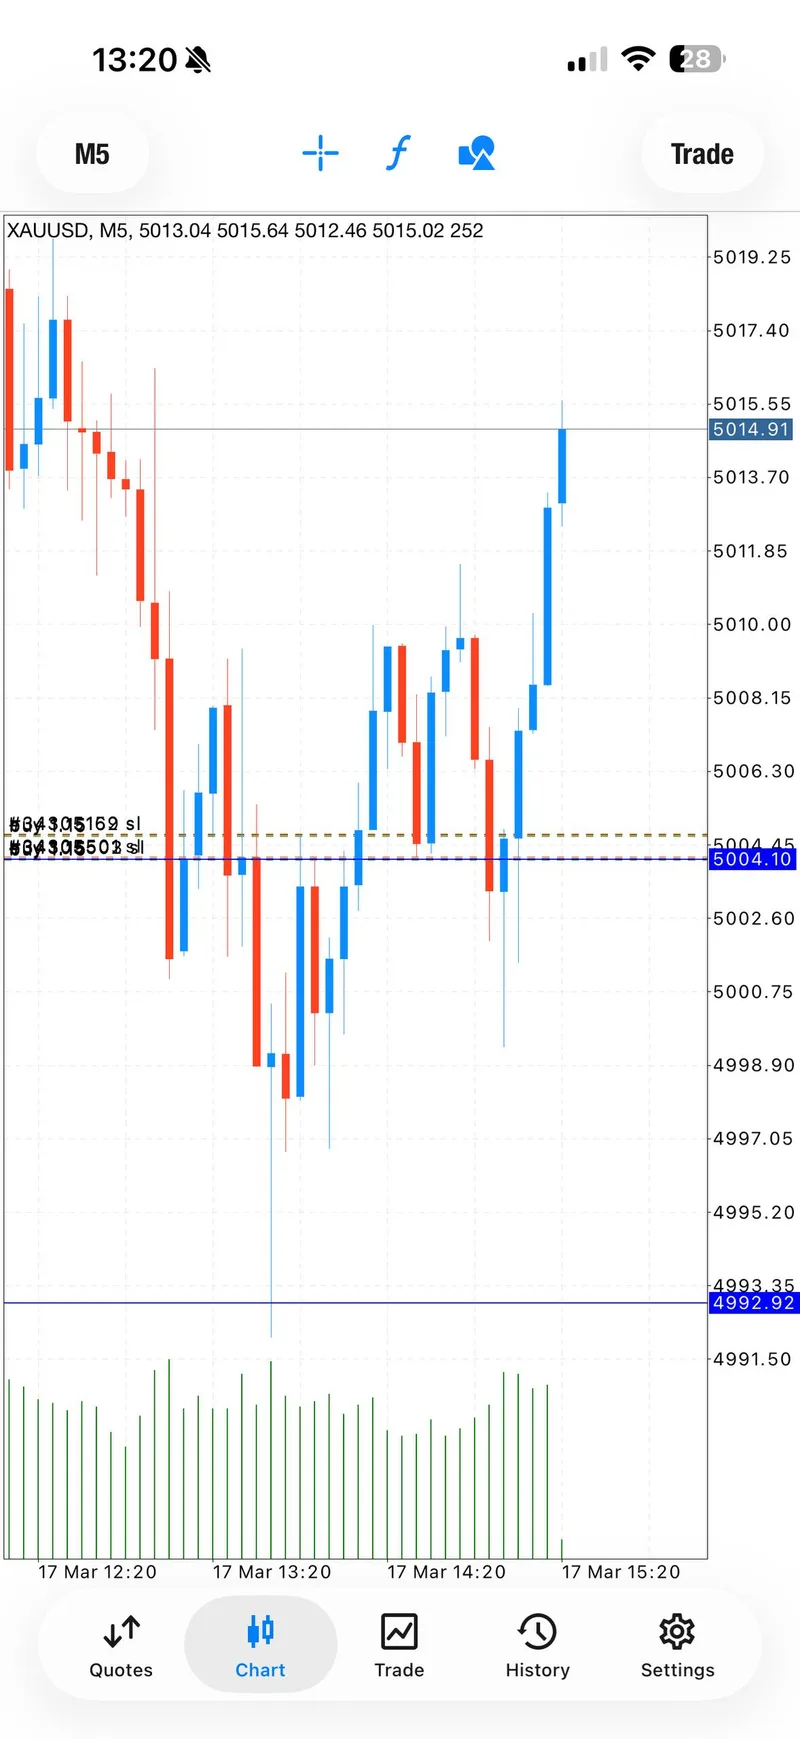
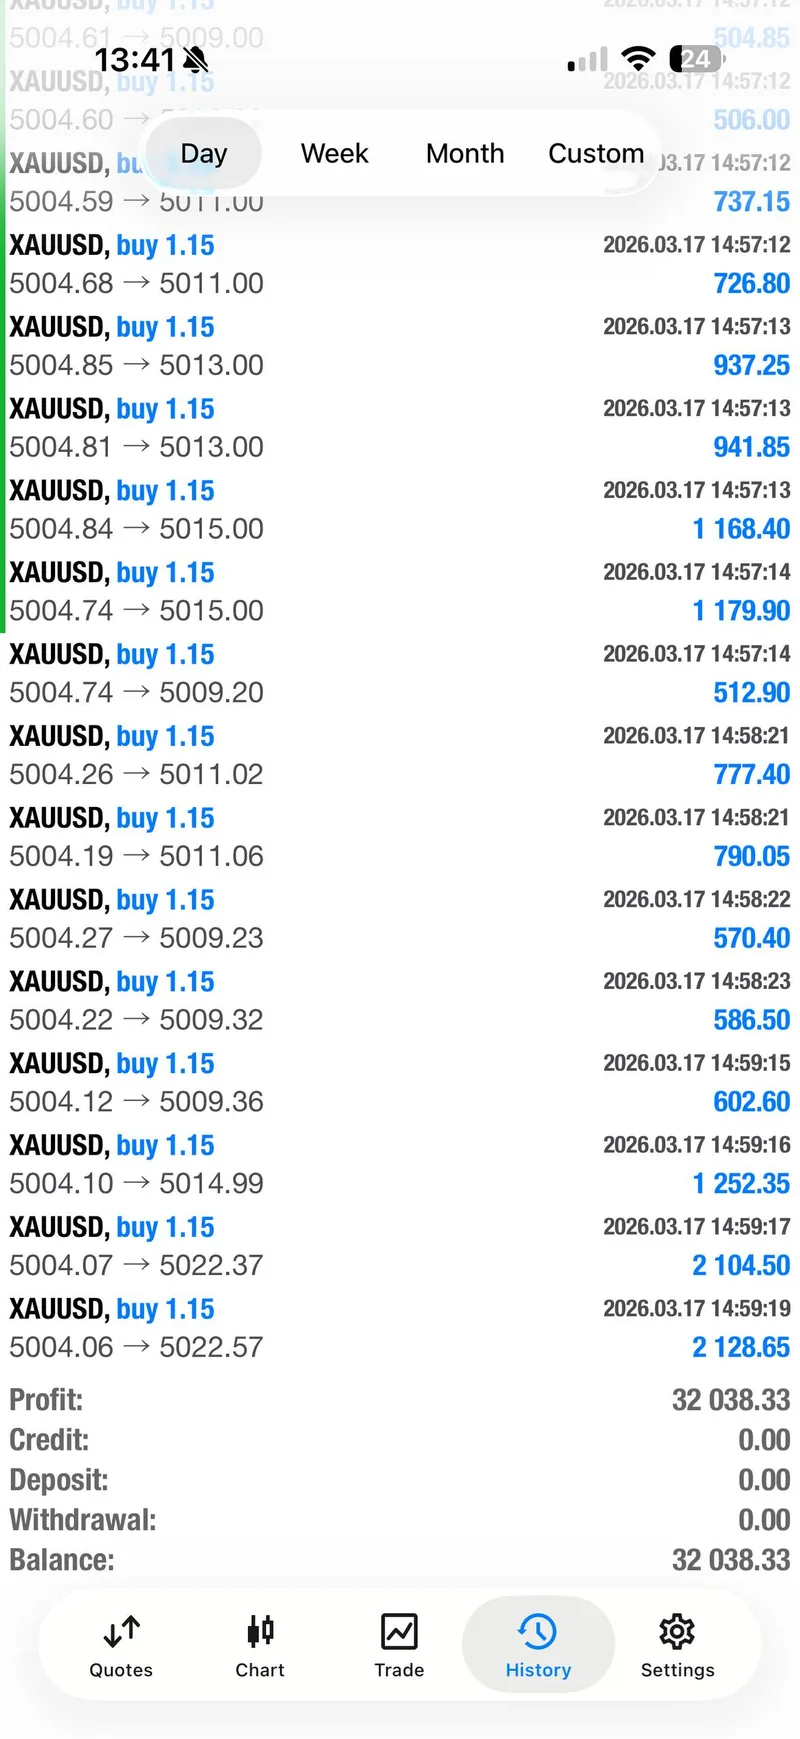
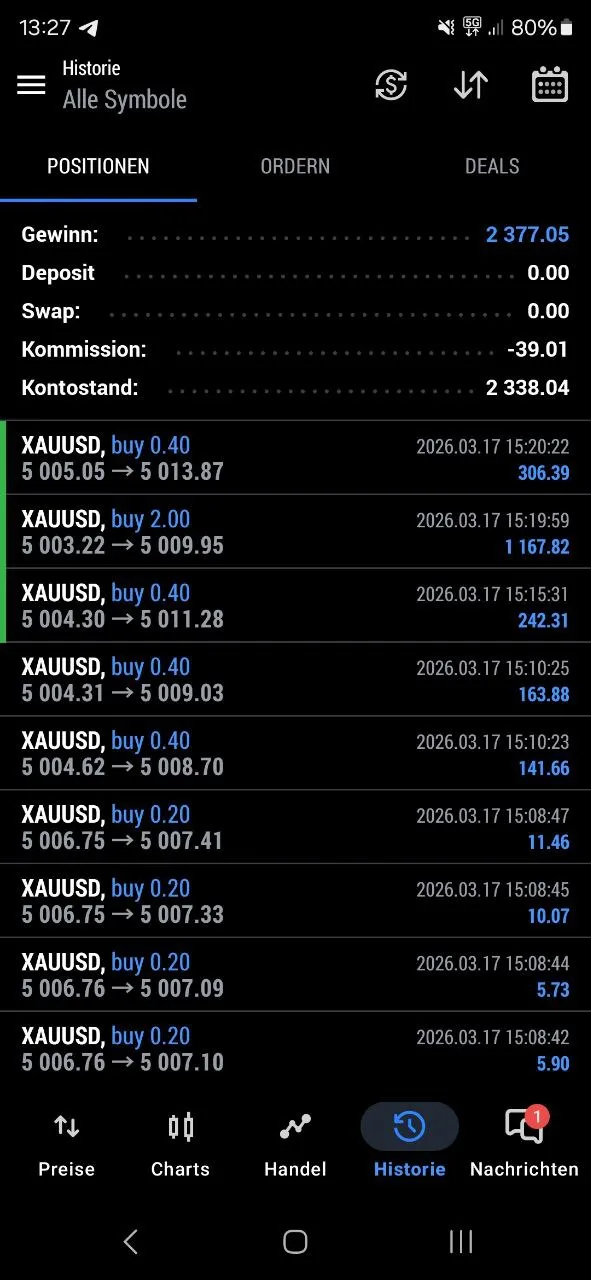
March 17 completely changed the tone. Ahead of the March 18 FOMC decision, gold stabilized, the US dollar and Treasury yields softened, and XAUUSD reclaimed the $5,000 handle decisively enough for GTMO to attack the 5007-5004 demand pocket twice. The result was a clean rebound sequence: early partial profits, a breakeven-protected management phase, a second buy cycle from the same zone, all four take-profits printing, and a later session screenshot showing a $32,000 day. If you want the broader context for how this recovery fits into the month, review the March 10 daily report, the March 13 comeback report, and the weekly trading summary for March 9-13.
Market Dashboard#
| Metric | March 17 Close / Latest | Change | Why It Mattered |
|---|---|---|---|
| XAUUSD | $5,022.49 | +0.32% | Confirmed the rebound back above $5,000 after the March 16 flush |
| Fed Funds Rate | 3.50%-3.75% | Hold expected | Kept traders focused on the March 18 FOMC tone and dot plot |
| DXY | 99.56 | -0.15% | Softer dollar removed some pressure from gold into the rebound day |
| US 10Y Yield | 4.202% | -0.42% | Lower yields improved the backdrop for a non-yielding asset like gold |
| WTI Crude | $95.28 | +3.05% | Sustained the geopolitical and inflation-sensitive risk backdrop |
| VIX | 22.37 | -4.85% | Showed that panic eased on March 17 even while macro uncertainty remained |
| Gold Regime | Bullish, consolidating | Stabilizing | The market was not trending cleanly, but buyers still defended dips |
The most important combined takeaway is that the market did exactly what a consolidating bull regime often does around a major central-bank event: it punished weak entries during the first stress wave, then rewarded traders who were willing to re-engage once price reclaimed structure. March 16 was about surviving instability. March 17 was about exploiting the rebound once the market gave a cleaner signal.
2. Macro Drivers Behind The Two-Day Swing#
Middle East Energy Shock Raised Volatility First#
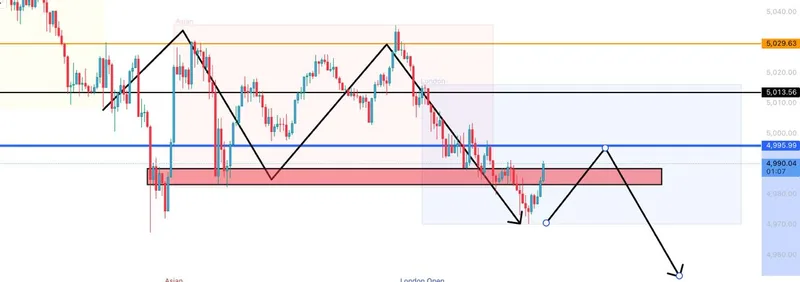
The opening stress on March 16 was tied to energy-driven geopolitical tension. Higher oil prices kept inflation worries alive and raised the probability of disorderly price swings across safe-haven assets. That kind of backdrop does not automatically send gold straight up. In practice, it often creates a first phase of noisy, headline-driven volatility where both buyers and sellers get trapped before the market chooses direction. That is the environment GTMO had to trade into during the loss day.
Pre-FOMC Positioning Took Over On March 17#
By March 17, the market was no longer trading pure shock. It was trading anticipation. With the Fed expected to hold rates on March 18, traders shifted focus toward the statement language, the dot plot, and how long policymakers might want to keep real rates restrictive. That pre-FOMC transition matters because gold often stabilizes before the event when the market sees less reason to keep pressing fresh shorts. Once the immediate liquidation pressure faded, the $5,000 area regained importance as a sentiment line.
Softer Dollar And Lower Yields Helped Gold Reclaim $5,000#
The user-supplied market dashboard for March 17 lines up with the intraday signal story. DXY slipped to 99.56, the US 10Y yield eased to 4.202%, and VIX cooled from the prior day's anxiety. That combination is exactly the kind of short-term macro mix that can support a gold rebound without requiring a full macro regime change. Gold did not need a brand-new bull case on March 17. It only needed less pressure from the dollar-and-yield complex plus enough confidence for dip buyers to defend the 5007-5004 pocket.
For higher-timeframe context on how Gold Trader Mo frames event weeks, the weekly gold market forecast for March 10-14 remains a useful companion read.
3. Technical Outlook#
The two sessions created a very clean technical message. March 16 proved that the market could still flush into lower support when liquidity was emotional. March 17 proved that once $5,000 reclaimed and the 5007-5004 zone held, the path back through the tactical ladder was fast. From an execution standpoint, the lower-$5,000s became the most important battlefield of the entire two-day package.
Key Price Levels#
| Price Level | Value | Why It Matters |
|---|---|---|
| Major Resistance | $5,022.49 | March 17 close and first meaningful reclaim above the round number |
| Near Resistance | $5,015 | Highest posted target in the winning buy sequence |
| Intraday Pivot | $5,007-$5,004 | The demand zone GTMO used twice on March 17 |
| Psychological Support | $5,000 | The line that separated panic from stabilization |
| Near Support | $4,993-$4,989 | March 16 second sell zone and failed reclaim area |
| Major Support | Around $4,970 | The broader test area referenced in the combined market note |
Structure Read#
A simple way to read the combined tape is this: the March 16 sells worked only briefly because the market could not sustain downside continuation once the panic move matured, while the March 17 buys worked because the same region flipped back into defended demand. The technical message was not trend perfection. It was regime transition inside a bullish-consolidation environment. Traders who insisted on one-direction certainty got punished on the first day. Traders who waited for reclaimed structure on the second day were paid.
Scenario Matrix#
| Scenario | Trigger Condition | Target | Probability |
|---|---|---|---|
| Bull | Hold above $5,000 and keep absorbing dips around 5007-5004 | $5,015 to the $5,022+ close zone, then higher if FOMC is benign | 45% |
| Base | Oscillate around $5,000 ahead of the Fed with sharp intraday rotations | Range trade between roughly $4,993 and $5,015 | 35% |
| Bear | Lose $5,000 and reopen the March 16 liquidation path | Retest of the upper-$4,970 area | 20% |
4. Trading Signals#

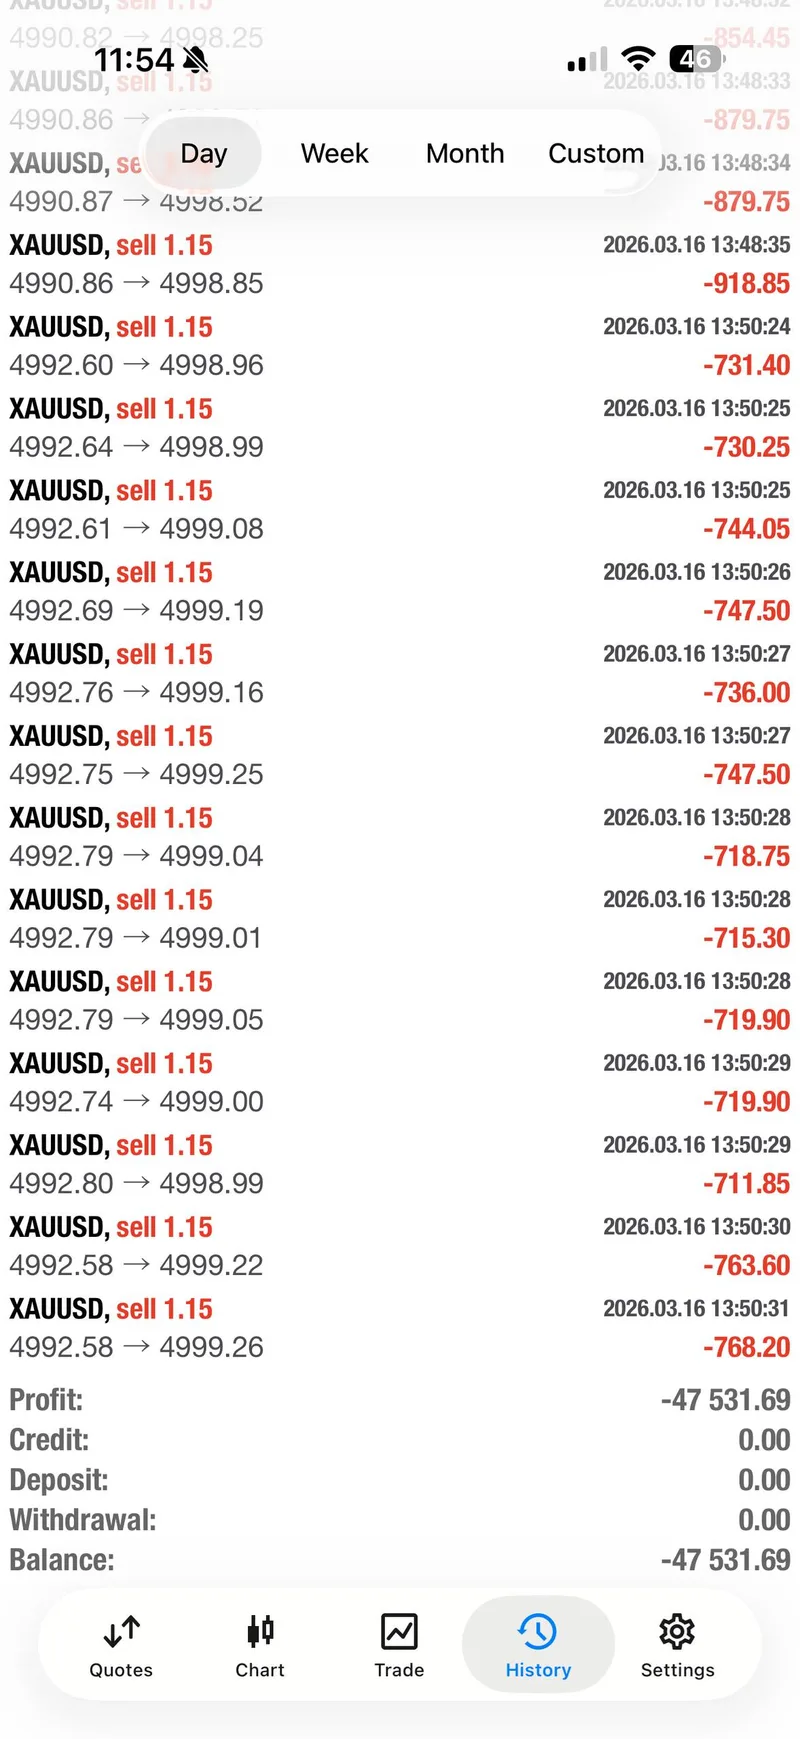
The combined record shows four actionable campaigns across two days: two controlled loss-side sells on March 16, then two buy cycles from the same demand zone on March 17. That split is important because it shows both sides of the GTMO process. The first day was about honoring invalidation in a poor tape. The second day was about reloading once price action improved.
March 16 — Risk Management Session#
Signal 1#
- Entry: 4977.4-4981 SELL
- SL: 4985
- TP: 4974, 4972, 4970, open
- Result: Controlled exit after the setup failed; stop honored and no unprotected hold
Signal 2#
- Entry: 4989.2-4993 SELL, later widened toward 4994 during volatility
- SL: 4997, then adjusted to 4999 as volume expanded
- TP: 4986, 4984, 4982, open
- Result: Second controlled exit; market stayed too volatile, trade was closed, and the session was stopped
March 16 should be framed as a professional stop day. GTMO explicitly told traders not to over-risk, reduced acceptable size, and then closed the session rather than forcing a revenge trade. The public note that followed made the point clearly: the market conditions were not aligned, emotions were elevated, and stepping back was the right decision.
March 17 — Recovery And Rebound Session#
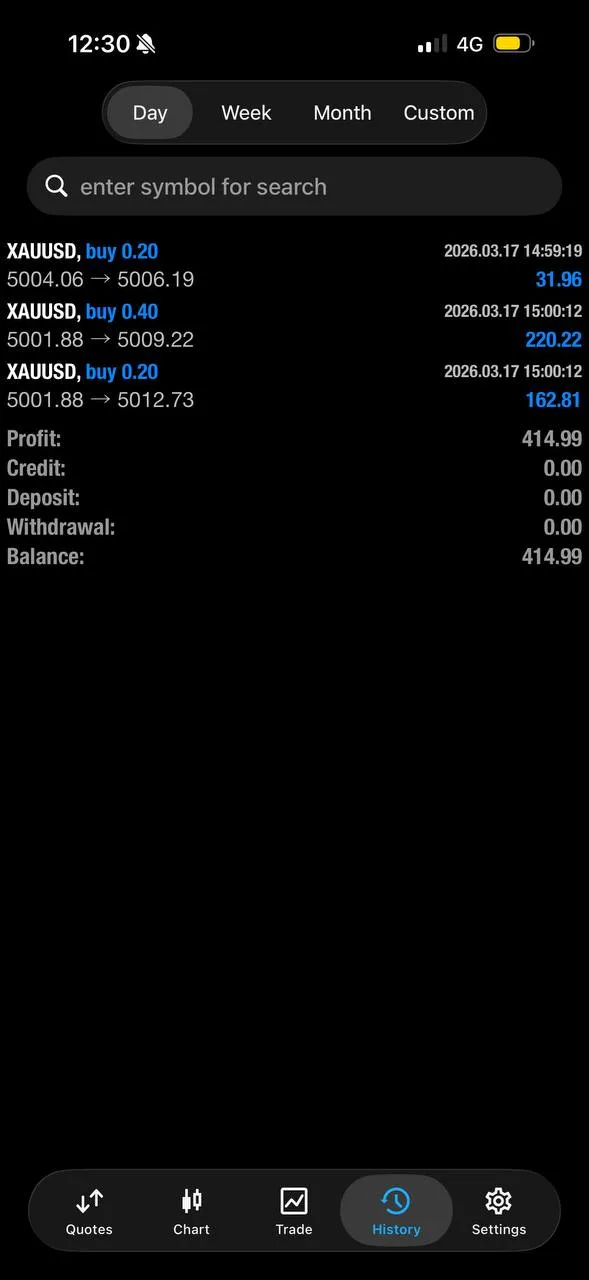
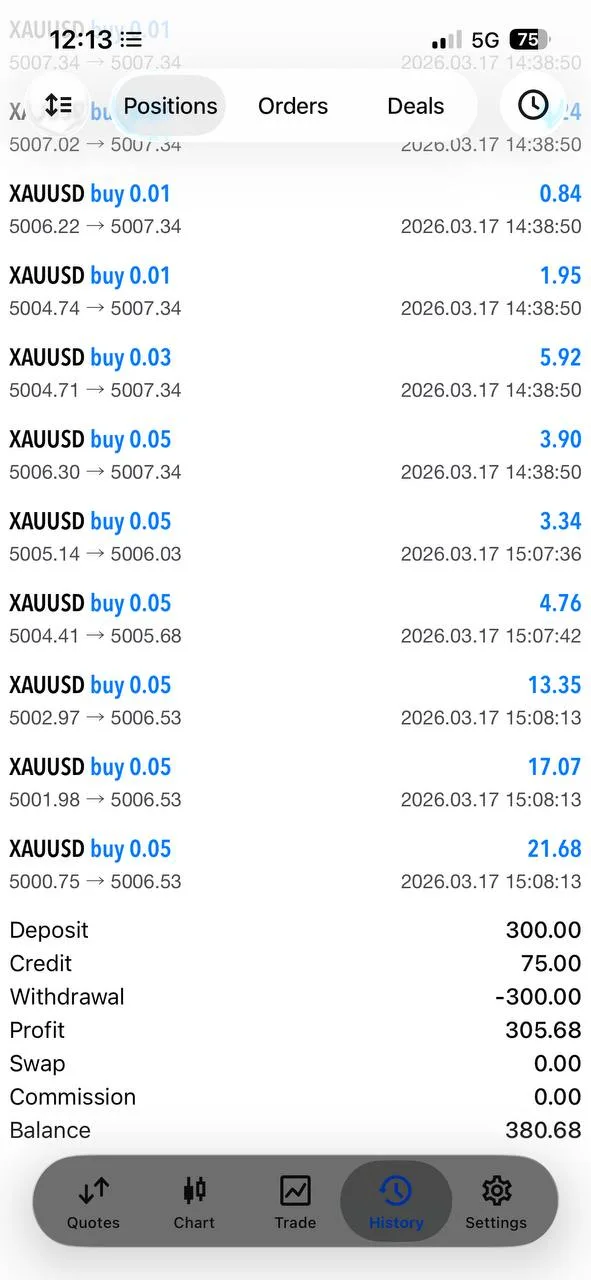
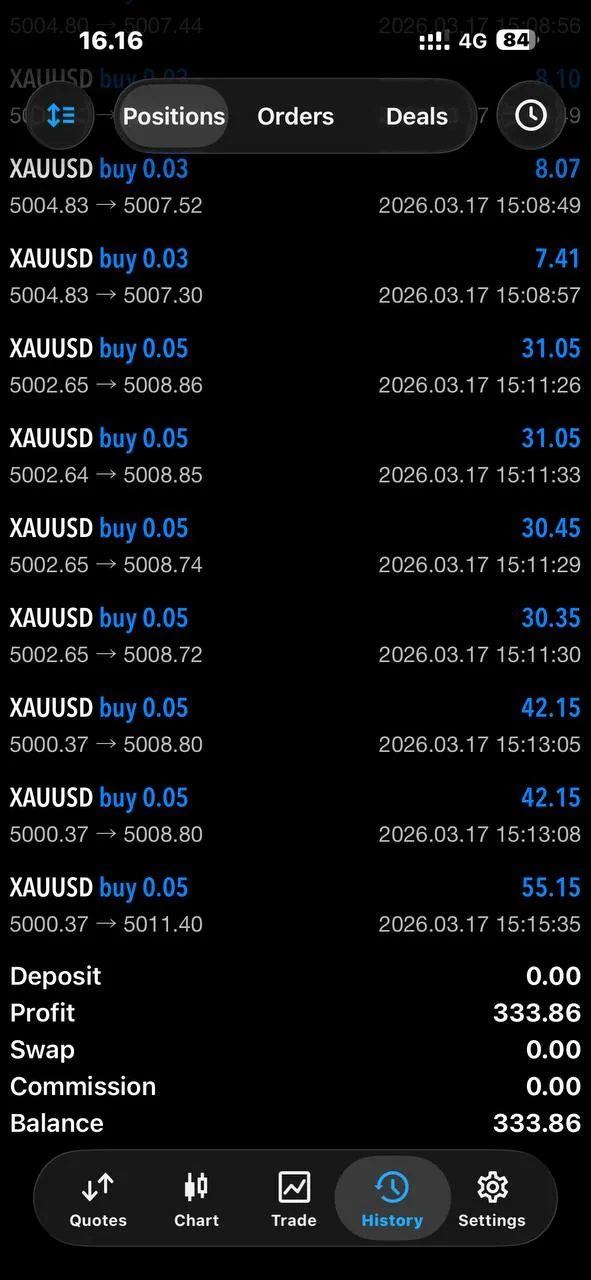
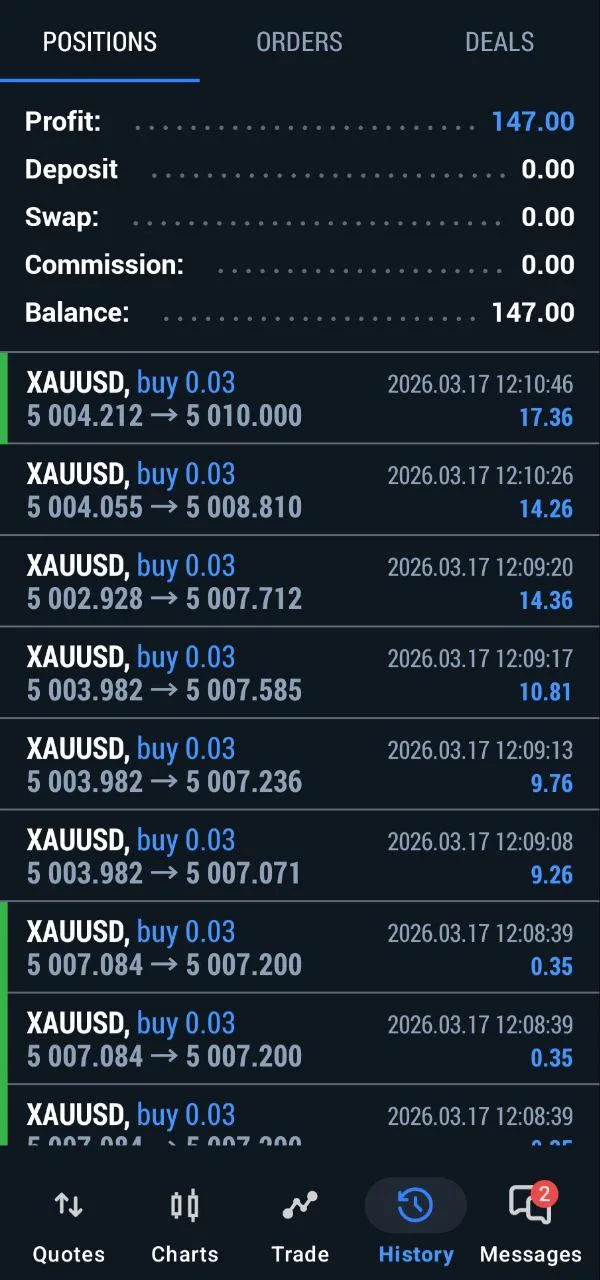
Signal 3#
- Entry: 5007-5004 BUY
- SL: 5000
- TP: 5009, 5011, 5013, 5015, open
- Result: TP1 and TP2 were confirmed, partial profits were banked, and breakeven was set on the remaining entries
Signal 4#
- Entry: 5007-5004 BUY reloaded from the same zone
- SL: 5000, later tightened to 4998 as volume increased
- TP: 5009, 5011, 5013, 5015, open
- Result: All 4 take-profits hit, the move extended toward 150-200+ pips on the best entries, and the day later printed a $32,000 session screenshot
This is the exact arc traders want to see after a difficult day: first regain control, then scale intelligently, then press when structure confirms. On March 17 the updates did not stay vague. The channel documented the trade through the whole progression: entries turned blue, partial profits were taken, breakeven was set, TP2 and TP3 were confirmed, all four targets completed, and the final PnL screenshot turned the rebound into hard evidence.
5. Signal Performance Breakdown#
The March 16 losses and March 17 rebound were caused by two different market conditions, not by random inconsistency. That distinction is what gives the combined post its educational value.
Why The Loss Day Happened#
March 16 was dominated by unstable flow. Oil-sensitive risk, sharp intraday volume, and an unrewarding short-term structure made continuation selling much harder to hold cleanly than it first appeared. GTMO did the right things even though the outcomes were negative: the setups were defined, the stops were visible, position sizing warnings were explicit, and the trading day was ended once the market kept refusing clean follow-through. That is exactly how a loss day should look when discipline is intact.
Why The Rebound Day Worked#
March 17 worked because the market gave traders what March 16 never did: a defensible, repeatable zone that price kept respecting. Once 5007-5004 held, the buy thesis had room to breathe. The messaging also improved the quality of execution. GTMO repeatedly instructed the channel to reduce risk, close weaker entries first, set breakeven, and stay at the desk because volume was expanding. That turned the session from a simple green day into a process-driven recovery.
The Combined Lesson#
The best combined takeaway is not that every bad day gets erased immediately. The real lesson is that disciplined risk management preserves the ability to participate in the next clean opportunity. March 16 did not destroy the week because risk was capped. That preserved both capital and confidence for March 17. If you compare this sequence with the March 13 comeback report, the pattern becomes clear: GTMO performs best when the market finally offers a clean structure, and the whole edge depends on staying solvent and composed long enough to exploit it.
6. Gold Positioning & Flows#
There is no verified same-day COT print or ETF flow number inside this two-day collection package, so the correct editorial approach is to stay with confirmed regime signals rather than invent precision. The broader message still points in the same direction: gold remains structurally supported, but event-week positioning creates sharp tactical swings inside that larger bullish story.
Central-bank demand, reserve diversification, and geopolitical hedging still matter. None of those themes disappeared on March 16 simply because intraday sells stopped out. What changed between the two days was short-term flow. On March 16, traders were still reacting to headline noise and oil-linked stress. On March 17, the market rotated into a more orderly pre-FOMC holding pattern, which made the bullish-consolidation regime visible again.
That is why the reclaim above $5,000 matters more than one single candle. It signals that dip-buying demand is still active even when the market temporarily punishes overconfident entries. In practical terms, the flow backdrop still favors tactical flexibility inside a medium-term constructive gold theme.
7. Community Results#
The community evidence from March 17 is strong enough to matter in a public report because it reflects live participation, not hindsight marketing. Traders were not only reacting to the final PnL screenshot. They were reacting all through the move as entries turned blue, breakeven was set, targets printed, and the rebound restored confidence after the previous day's frustration.
Member Voices#
"King Mo is back 🚀🔥🔥🔥🙏 Thank you @gtmo"
- Martin, posted after the recovery sequence accelerated on March 17
"You deserve this more than anyone Mo!"
- Trav, shared while the winning session was still unfolding
"Thank you Mo, I appreciate what you do for this community ❤️❤️"
- Kled H, posted during the rebound day as confidence returned
"Still got 1 runner..😉💪🏻 Thank you Mo..👑"
- Thomas Maximus, highlighting that traders were still managing open profit after partials
"Thanks King @GTMO"
- Nazim Raza, a direct reaction during the profitable part of the March 17 session
"Well deserved all 4 TakeProfits hitt and 200 pips flying🚀🤑"
- Community member screenshot shared once the full rebound cycle had matured
The social proof matters because it matches the signal timeline. Traders were not praising a fabricated result posted hours later. They were reacting to a documented recovery sequence from the live zone, through risk reduction, into full target completion. That alignment between message flow and result evidence is why the daily gold trading reports archive remains useful for serious followers of Gold Trader Mo: it preserves both the trading logic and the human reaction around it.
8. Event Risk — Next 48 Hours#
The next 48 hours are defined by the March 18 FOMC event window. Gold has already shown that it can trade both sides of the range before the decision, so traders should assume volatility can expand again even after the March 17 rebound.
| Time UTC | Event | Previous | Forecast / Focus | Gold Impact |
|---|---|---|---|---|
| Mar 18, 18:00 | FOMC rate decision | 3.50%-3.75% | Hold expected | A hawkish hold can pressure gold; a softer tone can keep the rebound alive |
| Mar 18, 18:30 | Powell press conference | Cautious inflation rhetoric | Watch the dot plot and duration of restrictive policy | The biggest catalyst for DXY, yields, and XAUUSD direction |
| Rolling | Middle East / oil headlines | WTI $95.28 | Elevated energy sensitivity | Any new escalation can rebuild safe-haven demand quickly |
| Mar 19 Asia-Europe overlap | Post-FOMC repricing | DXY 99.56, US 10Y 4.202% | Follow-through matters more than the first spike | Sustained softness in yields would support gold above $5,000 |
The correct mindset after this two-day sequence is selective, not euphoric. March 17 proved that gold still has strong rebound power inside this regime. March 18 can easily force a fresh volatility reset. The best traders will respect both truths at the same time.
FAQ#
Why combine March 16 and March 17 into one report?#
Because the second day only makes full sense when you understand the first one. March 16 showed the cost of forcing trades in a high-volatility environment. March 17 showed how quickly that pressure can reverse once structure improves and the same market starts rewarding disciplined re-entry.
Did Gold Trader Mo hide the March 16 losses?#
No. The signal record is explicit: two March 16 sell campaigns had clear entries, stops, and targets, and both ended as controlled exits. That transparency is exactly why the March 17 rebound has more credibility.
What was the key execution edge on March 17?#
The edge was not just the entry itself. It was the full management sequence: buy the defended 5007-5004 zone, reduce risk when price improved, set breakeven, reload only when the structure still supported it, and let the second cycle complete the full target ladder.
10. Connect with Gold Trader Mo#
- 🆓 Free Signals: GTMO Trades
- 💬 Support: @gtmobest
- 📺 YouTube: GTMOFX
- 📸 Instagram: mojirjees
- 🌐 Website: Gold Trader Mo
⚠️ Risk Disclaimer: Trading gold (XAUUSD) carries significant risk. Past performance does not guarantee future results. Only trade with capital you can afford to lose. This content is educational and does not constitute financial advice.