
Weekly Gold Forecast Snapshot#
Gold opens June with the kind of week that can punish lazy conviction. The tape finished last Friday constructive, but the references do not line up cleanly across venues: GoldPrice.org marks the May 29 close near $4,495, while the local Trading Economics-style packet sits closer to $4,541. That gap matters. It tells us not to sell false precision. It tells us to work with zones.
The Gold Trader Mo desk read is direct: XAUUSD starts June 1-5 in a decision range, not a confirmed trend. The week is built around U.S. labor data, ISM activity reads, Treasury-yield pressure, and Friday's official jobs report. If you want Mo's live read while these releases hit the market, message @GTMOBest and ask support for free VIP channel access.
The first support shelf is $4,425-$4,366. The first upside test is $4,516-$4,580. Above that, buyers can argue the recovery is becoming accepted. Below that support shelf, the market starts questioning whether late-May strength was only a relief bounce.
Where Gold Stands As The Week Opens#
Gold recovered into the end of May, but the recovery is still being judged against a tough macro backdrop. Official U.S. Treasury data showed the 10-year yield at 4.45% on May 29, with the 2-year at 3.98% and the 30-year at 4.99%. That is not a relaxed rates environment for non-yielding gold.
The dollar/yield channel therefore stays central. Gold can rally while yields are elevated if safe-haven demand is strong enough, but it is harder to sustain a clean upside break when the dollar and real-yield pressure are both leaning against the move. That is why this week is less about one heroic price target and more about confirmation quality.
Mo's archive from last week also matters for reader psychology. The prior sessions showed buyers defending recovery attempts, sellers testing lower shelves, and traders repeatedly being forced to respect risk. Readers can compare that progression through the May 27 gold trading report, the May 28 gold trading report, and the May 29 gold trading report. This forecast is not a recap of those signals. It is the forward map for what comes next: labor data, services activity, and the market's willingness or refusal to accept higher gold prices after the headlines.
The Main Drivers That Could Move Gold This Week#
Monday, June 1 starts with ISM Manufacturing PMI at 10:00 AM ET. It is the first macro checkpoint. A soft manufacturing print can cool growth and yield pressure; a firm print can keep the dollar supported and make gold work harder for upside.
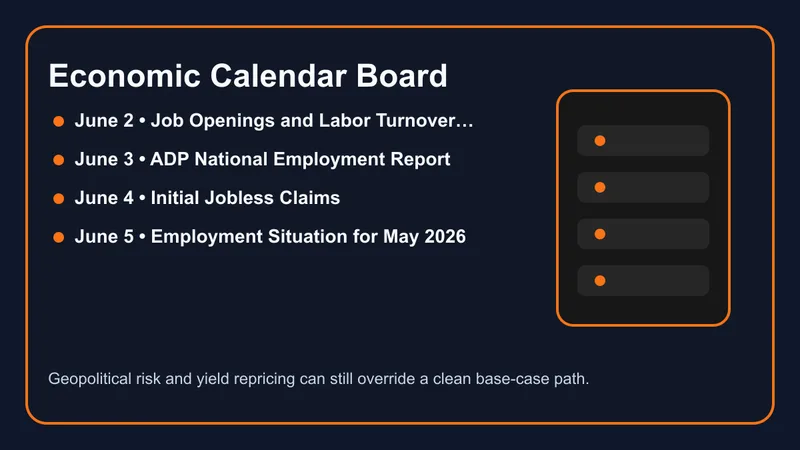
Tuesday, June 2 brings the BLS Job Openings and Labor Turnover Survey for April 2026 at 10:00 AM ET. This is not May JOLTS. The distinction matters because public copy should not pretend the release says more than it does. Still, openings are an early labor-temperature check before the market gets ADP and payrolls.
Wednesday, June 3 is the first real pressure point. ADP's National Employment Report is scheduled that day, and ISM Services PMI follows at 10:00 AM ET. Services are the cleaner U.S. demand story. If services stay firm and ADP rebounds, gold may need safe-haven demand to offset a stronger dollar/yield reaction. If both cool, gold gets a cleaner path to test resistance.
Thursday, June 4 has weekly jobless claims at 8:30 AM ET. It is a setup event, not the week's final verdict. Friday, June 5 is the main event: the BLS Employment Situation for May 2026 at 8:30 AM ET. April payrolls were +115,000 and unemployment held at 4.3%. The market now wants to know whether labor is cooling enough to soften yields or firm enough to keep the Fed patient.
That is why this week should feel urgent without hype. Gold is sitting in a technical range, and the calendar has enough labor firepower to break it.
Key Technical Levels and Decision Zones#
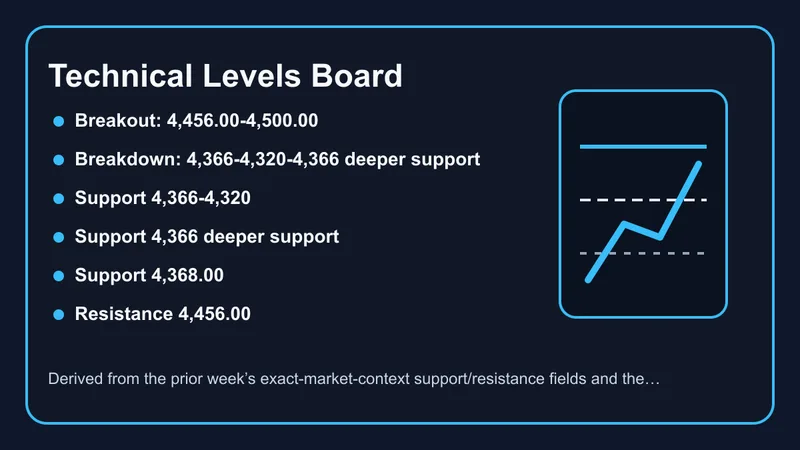
The first support band is $4,425-$4,366. If gold keeps defending this zone while yields fail to accelerate, the base case stays intact and buyers can keep probing higher. A wick below support is not enough by itself; the question is whether sellers can keep price accepted below the band.
The first resistance band is $4,516-$4,580. This is where the week becomes interesting. A push into resistance is not automatically bullish. A close and hold through the band, especially after labor data, is what starts turning recovery into acceptance.
The deeper downside shelf is $4,320-$4,300. That area should not be used as casual fear bait. It becomes relevant only if support breaks and the dollar/yield reaction confirms pressure. If gold reaches that zone on a clean macro shock, the desk should stop treating the move as normal range noise.
The upside extension zone is $4,650-$4,770. That only belongs in the conversation if gold first clears and holds the $4,516-$4,580 band. Until then, the responsible approach is to respect the range.
Bullish, Base, and Bearish Scenarios#
Bullish scenario#
Probability: 30%.
Gold turns constructive if ISM or labor data weaken enough to cool yields while the dollar loses traction. The trigger is acceptance above $4,516-$4,580, not just a fast spike through it. If that holds, the next path is $4,650 first, then $4,770 if Friday payrolls confirms softer labor pressure.
The bullish case is invalidated if gold breaks above resistance and then quickly falls back below $4,425. That would make the move look like a liquidity squeeze rather than a real trend shift.
Base scenario#
Probability: 45%.
The base case is a choppy decision range between $4,425-$4,580 until the market digests Wednesday's ADP/ISM Services mix and Friday's official jobs report. This is the most realistic path because the week has too many scheduled catalysts to assume a clean trend from Monday alone.
In this scenario, Mo's desk judgment matters more than blind prediction. Support holds until it does not. Resistance caps until it is accepted. Between those two facts, traders need patience, clean risk, and fast reassessment.
Bearish scenario#
Probability: 25%.
The bearish path opens if labor data stay firm, yields reprice higher, the dollar catches a bid, and gold loses $4,425-$4,366 with acceptance. The first downside stress zone is $4,320-$4,300. If that fails under strong dollar/yield pressure, the week shifts from consolidation into defensive breakdown.
The bearish case is invalidated if gold reclaims $4,516 and holds above $4,580 after the data. In that case, sellers had the macro window and failed to convert it into price acceptance.
Economic Calendar and Market Risks#
Monday is the first macro touch. Do not overreact to the first ISM move unless gold also confirms through the decision zone. Tuesday is the labor preview through JOLTS. Wednesday is the midweek pivot because ADP and ISM Services can move yield expectations together.
Thursday is a setup day. Jobless claims can sharpen the payroll narrative, but they rarely settle the whole gold story alone. Friday is the real test. If payrolls cool and wages do not scare the market, gold has room to attack resistance. If payrolls and wages stay firm, gold can lose the recovery tone fast.
The better read is not "buy" or "sell" in advance of the week. The better read is: know the trigger, know the invalidation, and do not confuse a headline spike with accepted direction.
How To Think About Positioning This Week#
This is the type of week where a static chart is not enough. The market can look calm before ADP, shift after ISM Services, and completely reprice after NFP. Non-technical readers should understand the simple version: gold is near a major decision zone, the U.S. labor calendar is heavy, and Friday can decide whether buyers have a real recovery or only a late-May bounce.
That is exactly where a live desk has value. The article gives the map. Mo's live channel helps readers follow the market as the map gets tested. Message @GTMOBest for free VIP access if you want the week interpreted while the data lands, not after the move is already obvious.
FAQ#
What is the main gold catalyst this week?#
Friday's BLS Employment Situation for May 2026 is the main catalyst because it can move Fed expectations, Treasury yields, the U.S. dollar, and gold at the same time. Wednesday's ADP and ISM Services releases are the important midweek setup.
What is the key XAUUSD level this week?#
The first support shelf is $4,425-$4,366. The first resistance band is $4,516-$4,580. A clean hold beyond either side changes the weekly bias.
Is this forecast a trade signal?#
No. This is market commentary and education. Trading involves risk, capital can be lost, and no forecast guarantees an outcome.
Connect With Gold Trader Mo#
Use this weekly gold forecast alongside the daily reports, the market-analysis archive, and the weekly trading summaries. For Mo's live week-ahead context and free VIP access, message @GTMOBest.
Disclaimer#
This weekly forecast is for education and commentary only. Trading involves risk, capital can be lost, and past performance never guarantees the next session will look the same.