
Weekly Gold Forecast Snapshot#
If you want MO's live read while this map is being weighed, message @GTMOBest to join the free VIP channel. The point of this weekly gold forecast is simple: know which move matters before the headline arrives, and know what would prove the move wrong.
Gold enters August 10-14 with a strong bid behind it, but the next leg is not automatic. The latest dated market reference is $4,343.43 on August 7, up 2.44% on Trading Economics' table. Trading Economics also warns that its price is an OTC/CFD reference rather than an official benchmark, so MO is using it as an anchor for structure, not as a promise that every broker will print the same tick.
The bigger fact is the labor shock behind that move. The official BLS Employment Situation for July 2026 reported nonfarm payroll employment down 23,000, unemployment at 4.1%, labor-force participation at 61.4%, and average hourly earnings up 3.2% year over year. BLS also revised May and June payroll changes down by a combined 103,000. That is the kind of data that can pull yields and the dollar lower together, giving non-yielding gold room to breathe.
MO's thesis for the coming week is therefore conditional-bullish, not blindly bullish. Gold has the bid. Wednesday's CPI decides whether the market accepts it. A clean hold above $4,300 and acceptance through $4,380 would open a credible run toward $4,500. A daily close below $4,200 would say the post-payroll move is being rejected and would put the $4,130-$4,180 reaction shelf back on the map.
Where Gold Stands As The Trading Week Gets Underway#
The market is in a constructive-but-extended regime. The bullish impulse is supported by softer labor evidence and a less comfortable rates story, but the move is also arriving directly into a week with three major US data windows. That combination matters. When gold is extended and the calendar is quiet, continuation can feed on itself. When gold is extended and CPI is two sessions away, the market usually needs proof that the macro engine is still behind the chart.
The dollar and Treasury yields are the first cross-check. The cited post-payroll sources agree on directionally softer pricing, but they do not agree cleanly on every exact close. MO will not manufacture precision from conflicting snapshots. The actionable question is whether yields keep easing after the first Monday-Tuesday positioning, and whether the dollar can recover without gold losing $4,300. If yields soften and gold holds, buyers have evidence. If yields reverse higher and $4,300 fails, the rally is more vulnerable than the headline suggests.
There is no scheduled FOMC decision in the target week. The Federal Reserve's official calendar shows July 28-29 as the previous 2026 meeting and September 15-16 as the next scheduled meeting. That makes CPI, PPI, retail sales, and the rates market's reaction to Treasury supply more important than a rate-decision headline.
Readers who want a broader archive can compare this forecast with the market-analysis archive, the daily reports, the previous weekly forecast, and the weekly trading summary. The archive provides continuity; this article is the forward decision map.
The Main Drivers That Could Move Gold This Week#
The first driver is the rate channel. Gold does not pay a coupon, so real-yield pressure can quickly change the quality of a breakout. If the market reads the weak employment report as a reason for lower future rates, gold can keep attracting demand even after a sharp first move. If CPI forces the market to rebuild a higher-for-longer rate premium, the same chart can lose momentum without any dramatic geopolitical headline.
The second driver is the dollar. A weaker dollar gives gold more room, but a risk-off dollar bid can sometimes rise alongside gold. MO is watching the relationship, not a single index print. The best bullish confirmation is gold holding above $4,300 while dollar strength fails to produce a clean downside break. The more dangerous combination for the bullish case is a recovering dollar, rising yields, and gold failing every retest of $4,300.
The third driver is the sequence of data rather than one isolated release. CPI arrives Wednesday, PPI follows Thursday, and retail sales is scheduled for Friday. The BLS CPI calendar confirms the July CPI release for August 12 at 08:30 ET, or 19:30 GMT+7. The BLS PPI calendar confirms July PPI for August 13 at the same time. The Census release schedule is the reference for Friday's retail-sales release.
The fourth driver is Treasury supply. The US Treasury tentative auction schedule shows bill, 3-year, 10-year, and 30-year supply across August 10-13. These auctions are not the headline catalyst, but they can sharpen the yield response around CPI. MO will treat them as a rates cross-check, not as a reason to invent a directional call.
Key Technical Levels and Decision Zones#
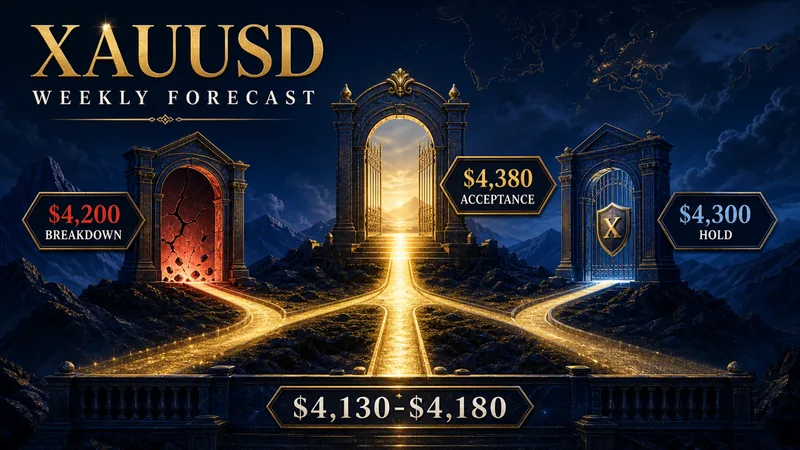
The chart has four usable questions for the week.
$4,300 — hold or reclaim. This is the first line that tells MO whether buyers are defending the post-payroll structure. A brief wick below it is not automatically bearish. Repeated closes below it, especially while yields rise, would be more serious.
$4,380 — acceptance gate. The market can trade above resistance for minutes and still fail. MO wants to see a close above $4,380 followed by a retest that holds. That is the difference between a breakout headline and accepted price discovery.
$4,500 — psychological upside reference. This is the next major upside level in the dated technical material. It is a destination in the bullish path, not a guaranteed target and not an instruction to chase an extended candle.
$4,200, then $4,130-$4,180 — downside map. A decisive daily close below $4,200 would weaken the bullish structure. If sellers keep acceptance below that line, the $4,130-$4,180 band becomes the next reaction shelf. A fast rejection from that band would mean something different from orderly downside continuation, so MO will read the response, not just the first touch.
This decision map is deliberately narrower than a list of every number appearing in a technical article. The point is to give a non-technical reader a clear answer: $4,300 is the first hold, $4,380 is the acceptance gate, $4,200 changes the read, and $4,130-$4,180 is where the next downside reaction should be judged.
Bullish, Base, and Bearish Scenarios#
MO's editorial weights are 40% base, 35% bullish, and 25% bearish. These are planning weights, not market-implied odds, and they can change if CPI, PPI, yields, or the dollar invalidate the starting structure.
Bullish scenario#
The bullish path needs the market to prove that the labor shock changed more than one Friday session. A benign CPI reaction, continued yield relief, and a dollar that cannot regain control would give buyers the best backdrop. Technically, the sequence is straightforward: gold holds $4,300, closes above $4,380, and defends that level on the first retest. If that happens, the market can run toward $4,500.
The invalidation is equally clear. A fast rejection back below $4,300 after the breakout would turn the move into a failed acceptance attempt. A hot PPI print that reverses yields and the dollar higher would also damage continuation, even if the first CPI reaction looks bullish.
Base scenario#
The base case is a $4,200-$4,380 rotation while traders wait for the data sequence to settle. This is not a boring outcome. It is the most honest framework when the market has already repriced aggressively and the next major catalyst is still ahead. Gold can trade above $4,380, dip toward $4,300, and still remain in the base case until a close proves acceptance or rejection.
The base case is triggered when CPI and PPI do not create a decisive yield shock, gold holds the $4,300 area, and the dollar remains mixed. It is invalidated by clean acceptance above $4,380 or by a daily close below $4,200 followed by a failed reclaim. The path is rotation first, direction second.
Bearish scenario#
The bearish path needs the rates trade to turn. A hot CPI/PPI sequence or a strong retail-sales print could push yields higher, restore dollar demand, and make the post-payroll gold move look too extended. In that case, a close below $4,200 would be the key structural warning, with $4,130-$4,180 as the next reaction shelf.
The bearish path is not confirmed by one red candle. MO wants acceptance: price below $4,200, a failed recovery, and a macro backdrop that keeps the rate channel hostile. A clean reclaim of $4,300 would invalidate the breakdown read and put the market back into the range or bullish branches.
Economic Calendar and Market Risks#

The week is front-loaded with information, but the events do not all carry the same weight.
-
Monday, August 10: Treasury 13-week and 26-week bill auctions. The opening session is about whether gold can hold the post-payroll structure before the main data arrives.
-
Tuesday, August 11: Treasury 3-year note and 6-week bill auctions. These are secondary rates watchpoints; the important question is whether front-end yields begin to rebuild pressure ahead of CPI.
-
Wednesday, August 12, 19:30 GMT+7: US July CPI. This is the first verdict on whether the labor-driven yield relief can survive an inflation reading.
-
Thursday, August 13, 19:30 GMT+7: US July PPI, alongside the Treasury 10-year note and 30-year bond auction sequence across the week. PPI is the confirmation reading; long-end demand can amplify or blunt the rates reaction.
-
Friday, August 14: US July retail sales. The number matters because it can decide whether the week closes with softer-growth support or renewed reflationary pressure.
Geopolitical risk remains a watchpoint, but MO is not using a dramatic headline as the base case without a dated source. If a fresh shock hits, safe-haven demand can override the cleaner yield-and-dollar map. If nothing new happens, the scheduled data should remain the more disciplined anchor.
What Traders Should Watch Day by Day#
Monday and Tuesday are about behavior around $4,300. If gold holds that area while yields stay contained, buyers are doing the first piece of work. If price loses it before CPI and cannot reclaim it, the market is warning that the Friday impulse was not yet accepted.
Wednesday is the decision day. The first reaction to CPI can be violent and still be wrong. MO wants to see whether the market holds the direction after the first liquidity sweep. A cooler print that cannot lift gold above $4,380 is less bullish than it looks. A hot print that cannot push gold below $4,300 is less bearish than it looks.
Thursday is the cross-check. PPI should either validate the CPI interpretation or force the market to rewrite it. The long-end Treasury auction sequence is useful here because it can show whether rates traders accept the new inflation story.
Friday is about closure. Retail sales can create a final move, but the more important question is where gold finishes relative to $4,300, $4,380, and $4,200. A weekly map earns its value from the closing structure, not from a single dramatic candle.
How To Think About Positioning This Week#
The practical risk frame is conditional positioning. Do not treat $4,380 as a reason to chase; treat it as an acceptance gate. Do not treat $4,200 as a magic stop; treat it as the level where the bullish thesis needs to be rewritten. Around CPI and PPI, reduce the temptation to turn a first spike into certainty.
There is also a difference between being right on direction and being right on timing. Gold can remain broadly constructive and still retrace before it moves higher. It can print a new intraday high and still fail the weekly acceptance framework. MO's map is built to keep those distinctions visible so a reader can act on evidence rather than emotion.
If you want the live context behind the levels, the daily market read, and the way MO handles the invalidation when the tape changes, message @GTMOBest. The free VIP channel is for traders who want the conversation around the map, not a promise that every setup will win.
FAQ#
What is the main catalyst for gold this week?#
Wednesday's US CPI at 08:30 ET / 19:30 GMT+7 is the main scheduled verdict. PPI on Thursday and retail sales on Friday matter because they can confirm or reverse the first inflation-and-growth interpretation through yields and the dollar.
Is the weekly gold forecast bullish or bearish?#
MO's starting bias is conditional-bullish, with a 40% base rotation, 35% bullish continuation, and 25% bearish breakdown weighting. The bullish case needs acceptance above $4,380. A daily close below $4,200 changes the read.
What XAUUSD levels matter most this week?#
$4,300 is the first hold/reclaim area. $4,380 is the acceptance gate. $4,500 is the psychological upside reference. Below, $4,200 is the structural line and $4,130-$4,180 is the secondary reaction shelf.
How should traders handle CPI and PPI volatility?#
Wait for the first reaction to prove itself. The cleaner signal is follow-through: whether gold holds the level it breaks, whether yields stay aligned, and whether the dollar confirms the move. Trading involves risk, and no forecast guarantees a result.
Connect with Gold Trader Mo#
The edge in a volatile week is not pretending to know every tick. It is knowing the thesis, the trigger, and the invalidation before the market forces the decision. For Gold Trader Mo's live context and free VIP access, message @GTMOBest.
This article is educational market commentary, not financial advice or a promise of profit. Trading involves risk, and capital can be lost.